


Introduction
Individual patient isolation and transportation systems provide mobile biocontainment for patients with highly infectious diseases, including viral hemorrhagic fever (eg, Ebola virus disease [EVD], Lassa fever). Reference Christopher and Eitzen1–Reference Nicol, Mepham and Naylor4 These systems create a self-encapsulated negative air pressure environment around the patient, minimizing exposure of health care personnel to infectious aerosols and body fluids. Until recently, their use has been limited to military and government aeromedical evacuation and repatriation of infected or exposed patients to specialized facilities capable of high-level containment care. Reference Cieslak and Kortepeter5
Civilian emergency medical services (EMS) professionals may be most familiar with stretcher transport isolators. Comprising a flexible, transparent plastic envelope supported by a scaffold, these compact and rapidly deployable systems have glove access points and pass-through ports for limited patient care. Ambient air enters through high-efficiency particulate air (HEPA) filters and exhausts through additional HEPA filters and organic vapor and acid gas cartridges to the exterior (eg, ambulance patient compartment) with the assistance of a blower unit, which creates a negative pressure environment within the isolator. During the EVD outbreak in West Africa from 2014 to 2015, stretcher transport isolators proved instrumental in the aeromedical evacuation of several patients regionally and internationally. Reference Dindart, Peyrouset and Palich6,Reference Biselli, Lastilla and Arganese7 Many EMS agencies across the United States now integrate use of stretcher transport isolators into preparedness plans to provide safe ground transport of patients with EVD and other emerging, highly infectious diseases. Reference Lowe, Jelden and Schenarts8
Designed for infection prevention, little is known about the air quality inside a stretcher transport isolator during actual patient use. Inadequate ventilation of this confined space can lead to the accumulation of human bioeffluent emissions including exhaled carbon dioxide (CO2), water (H2O) vapor, and volatile organic compounds (VOCs). In this study, CO2 and H2O concentrations within a commercial stretcher transport isolator carrying a healthy volunteer were measured during 2 operational exercises. Next, a simple compartmental model was developed to predict CO2 concentrations within the isolator, highlighting the importance of adequate ventilation in reducing CO2 and optimizing patient safety during high-level containment ground transport.
Methods
Data Collection
Two similar stretcher isolator models were used in 2 operational exercises. Both models (Advantage, Biochem) were Individual Patient Isolation Systems (ISO-PODTM) produced by the same manufacturer (AirBoss of America Corporation, Ontario, Canada). These puncture-resistant systems measure 85 inches by 28 inches by 18 inches and are equipped with a single 4 cubic foot per minute (CFM) blower, which provides at least 12 air exchanges per hour. The blower pulls air through intake and exhaust HEPA filters so that the interior of the isolator is a negative pressure environment.
Healthy volunteers were solicited from Abbott Emergency Medical Services and Los Angeles County Emergency Medical Services as part of training exercises. Consent was obtained from each volunteer and all data have been anonymized. While a formal physical examination was not performed, the 2 volunteers were considered physically fit to conduct their usual duties as EMS professionals per each agency’s occupational health program.
In May 2019, Abbott EMS, Missouri Department of Health and Senior Services, and other regional health care partners conducted a full-scale exercise funded in part by the US Department of Health and Human Services (DHHS) Assistant Secretary for Preparedness and Response (ASPR) to test integrated health care service delivery for patients under investigation or with confirmed EVD. As part of this operational exercise, Abbott EMS performed a 257-mile ground transport of a healthy volunteer in a stretcher transport isolator from Barnes-Jewish Hospital in St. Louis, Missouri, an Ebola Assessment Hospital, to University of Iowa Hospitals and Clinics in Iowa City, Iowa, an Ebola Treatment Center. Both hospitals are designated regional partners in the Centers for Disease Control and Prevention’s tiered approach to EVD care in the United States. An ISO-PODTM Advantage transport isolator was used, following manufacturer instructions and standard operating procedures developed by Abbott EMS. The isolator was secured to a stretcher in the patient compartment of the ambulance, and a healthy volunteer was monitored by an EMS professional in expanded personal protective equipment during the 5.5-hour transport. The stretcher transport isolator remained sealed for the entire exercise with the ambulance patient compartment doors closed. The patient compartment was lined with impervious barrier drapes, which allowed the ambulance ventilation system to supply and exhaust air from the ambulance patient compartment. Ambient air temperature, relative humidity, and CO2 concentrations were recorded at 15-minute intervals within the isolator and inside the ambulance patient compartment using 2 consumer-grade CO2 monitors (XT-10 CO2 Monitor; CO2METER, Inc., Ormond Beach, FL) selected for cost and measurement range. Baseline calibration for CO2 was performed per manufacturer instructions. The volunteer’s vital signs, pulse oximetry, and capnography readings were recorded at 15-minute intervals accompanied by continuous cardiac monitoring. The volunteer was maintained on supplemental oxygen at a rate of 2 L/minute.
Following transport from St. Louis to Iowa City, failure of the blower unit was simulated by turning it off for 10 minutes (with the healthy volunteer enclosed in the isolator and the patient compartment doors closed). As before, the volunteer was maintained on supplemental oxygen at a rate of 2 L/minute and closely monitored. The volunteer was aware of the blower failure test and could perceive the change in sound when the blower was turned off and on. Ambient air temperature, relative humidity, and CO2 concentrations within the isolator and patient compartment were recorded every 2 minutes. Conducted as part of safety monitoring for an operational exercise, this work was determined to not be human subjects research by the Washington University School of Medicine Human Research Protection Office.
In November 2019, Los Angeles County EMS conducted a 1.5-hour stationary exercise simulating ground transport of a healthy volunteer inside an ISO-PODTM Chem/Bio transport isolator, using a different commercially available indoor air quality monitor to measure CO2, relative humidity, and temperature (Q-Trak Indoor Air Quality Monitor Model 7575; TSI Inc., Shoreview, MN). As this exercise occurred in a stationary ambulance with the engine turned off, the patient compartment doors were left open to the outside environment, a hospital parking lot. Differences between the conditions of this simulation and a real ground transport scenario include the enhanced ventilation of the patient compartment and the absence of motion from ambulance movement. While the specific indoor air monitor used by Los Angeles County EMS also measured carbon monoxide (CO) and total volatile organic compounds (VOC), these measurements are not addressed in this study. CO and VOC measurements with low-cost, commercial sensors may be subject to significant artifacts from small environmental changes. In addition, a single total VOC measurement would not sufficiently elucidate the diverse sources and processes possible in this scenario, including possible removal by the isolator’s organic vapor and acid gas cartridges (which would not trap CO2); more sensitive, speciated measurements would be necessary to support characterization of VOCs.
Modeling Methods
The concentrations of CO2 and H2O inside of the isolator
 $({C_{isolator,\;\;C{O_2}}},{C_{isolator,\;\;{H_2}O}})$
were each modeled with a differential mass balance on the isolator compartment (assumed to be well-mixed), accounting for losses and gains from blower ventilation and volunteer inhalation, exhalation, and perspiration (Figure 1):
$({C_{isolator,\;\;C{O_2}}},{C_{isolator,\;\;{H_2}O}})$
were each modeled with a differential mass balance on the isolator compartment (assumed to be well-mixed), accounting for losses and gains from blower ventilation and volunteer inhalation, exhalation, and perspiration (Figure 1):
 $${V_{isolator\;}}\cdot{{d{C_{isolator}}} \over {dt}} = Net\;Exhaled\;Mass + Perspired\;Mass - \;Net\;Mass\;Removed\;by\;Blower$$

Figure 1. Flow diagram of modeled losses and gains of CO2 and H2O to the air within the isolator from inhalation, exhalation, perspiration, and ventilation, and with operation of the isolator’s blower.
where
 ${V_{isolator}}$
is the volume of the isolator (0.567 m3, calculated from the nominal blower flow rate [113 L/min] and clean air change rate [12 hr -1]) and t is time. Approximating the volume of the isolator as a half-cylindrical prism (28” diameter and 86” length) yields a lower estimate (0.433 m3) for which the air exchange rate would be even higher (15.7 hr -1). Using a value for
${V_{isolator}}$
is the volume of the isolator (0.567 m3, calculated from the nominal blower flow rate [113 L/min] and clean air change rate [12 hr -1]) and t is time. Approximating the volume of the isolator as a half-cylindrical prism (28” diameter and 86” length) yields a lower estimate (0.433 m3) for which the air exchange rate would be even higher (15.7 hr -1). Using a value for
 ${V_{isolator}}$
that is higher than the actual air volume inside the isolator would result in lower modeled concentrations.
${V_{isolator}}$
that is higher than the actual air volume inside the isolator would result in lower modeled concentrations.
Net exhaled mass and net mass removed by the blower were each calculated as the product of the appropriate volumetric flow rate and concentration difference:
 $${V_{isolator\;}}\cdot{{d{C_{isolator}}} \over {dt}} = R\cdot{V_{tidal}}\cdot\left( {{C_{exhaled}} - {C_{isolator}}} \right) + P + Q\cdot\left( {{C_{outside}} - {C_{isolator}}} \right)$$
where R is respiratory rate,
 ${V_{tidal}}$
is tidal volume, Q is the nominal blower flow rate (113 L/min with the exception of the simulated blower failure test for which Q = 0 L/min), and P is the water perspiration rate.
${V_{tidal}}$
is tidal volume, Q is the nominal blower flow rate (113 L/min with the exception of the simulated blower failure test for which Q = 0 L/min), and P is the water perspiration rate.
The differential balance was integrated to calculate
 ${C_{isolator}}$
as a function of time:
${C_{isolator}}$
as a function of time:
 $${C_{isolator}}\left( t \right) = {1 \over {{v_{isolator\;}}}}\left( {a + d\cdot\exp \left( {b\cdot t} \right)} \right)$$
 $${\rm{where}}\,\,a = R\cdot{V_{tidal}}\cdot{C_{exhaled}}\;+ \;{C_{outside}}\cdot Q$$
 $$b = - R\cdot{V_{tidal}} - Q$$
 $$d = {C_{isolator}}\left( {t = 0\;min} \right)\cdot{V_{isolator\;}} + {a \over b}$$
To compare the impact of changing the blower volumetric flow rate on concentrations at steady state (after a sufficiently long time had passed allowing concentrations to reach a stable, constant value),
 ${{d{C_{isolator}}} \over {dt}}$
was set to equal zero:
${{d{C_{isolator}}} \over {dt}}$
was set to equal zero:
 $${C_{isolator,\;steady\;state}} = {{R\cdot{V_{tidal}}\cdot{C_{exhaled}} + Q\;\cdot{C_{outside}}} \over {R\cdot{V_{tidal}} + Q}}$$
To better evaluate how well the model represented the experimental data, realistic assumptions were chosen for model parameters that were not measured, as subsequently described. In the absence of individual measurements, tidal volume
 $({V_{tidal}})$
was assumed to be 0.5 L/breath.
Reference Gisolf, Wilders and Immink9
Since the measurement time resolution of instantaneous respiratory rate and end tidal CO2 (EtCO2) was low, and since these variables were not recorded for all tests, respiratory rate (R) for all tests was assumed to be constant and equal to the mean recorded respiratory rate during the St. Louis to Iowa City transport exercise (18.7 breaths/minute). While this respiratory rate is relatively high (18.7 breath/minute), the estimated tidal volume (0.5 L) is smaller with respect to the volunteers’ gender and weight (males of 97 kg and 82 kg in the St. Louis/Iowa City and Los Angeles County exercises, respectively), so that the resulting calculated minute ventilation rate (9.4 L/min) may be more typical than the estimates of its 2 factors. If available, capnography and respiratory flow rate waveform monitoring would enable precise measurement of respiratory emissions (as opposed to the estimates used here). Average exhaled concentrations
$({V_{tidal}})$
was assumed to be 0.5 L/breath.
Reference Gisolf, Wilders and Immink9
Since the measurement time resolution of instantaneous respiratory rate and end tidal CO2 (EtCO2) was low, and since these variables were not recorded for all tests, respiratory rate (R) for all tests was assumed to be constant and equal to the mean recorded respiratory rate during the St. Louis to Iowa City transport exercise (18.7 breaths/minute). While this respiratory rate is relatively high (18.7 breath/minute), the estimated tidal volume (0.5 L) is smaller with respect to the volunteers’ gender and weight (males of 97 kg and 82 kg in the St. Louis/Iowa City and Los Angeles County exercises, respectively), so that the resulting calculated minute ventilation rate (9.4 L/min) may be more typical than the estimates of its 2 factors. If available, capnography and respiratory flow rate waveform monitoring would enable precise measurement of respiratory emissions (as opposed to the estimates used here). Average exhaled concentrations
 $({C_{exhaled,\;\;C{O_2,}}}{C_{exhaled,\;\;{H_2}O}})$
were assumed to be 38 000 ppm CO2 (equivalent to 28.9 mmHg CO2, which is 87% of the average EtCO2 value from the St. Louis to Iowa City transport exercise) and 60.1 mbar H2O.10,11 In addition, perspiration by volunteers was assumed to be 0.42 mL/min of liquid H2O (P) which immediately evaporated.12
$({C_{exhaled,\;\;C{O_2,}}}{C_{exhaled,\;\;{H_2}O}})$
were assumed to be 38 000 ppm CO2 (equivalent to 28.9 mmHg CO2, which is 87% of the average EtCO2 value from the St. Louis to Iowa City transport exercise) and 60.1 mbar H2O.10,11 In addition, perspiration by volunteers was assumed to be 0.42 mL/min of liquid H2O (P) which immediately evaporated.12
Concentrations outside of the isolator
 $({C_{outside,\;\;C{O_2}}},{C_{outside,\;\;{H_2}O}})$
were measured for the St. Louis to Iowa City transport exercise as well as the blower failure test as previously described, and spline fits of these measured values were used in the model for this test (for CO2, mean = 988 ppm, min = 696 ppm, max = 2015 ppm; for H2O, mean = 13.5 mbar, min = 15.8 mbar, max = 18.3 mbar). In the absence of measurements of
$({C_{outside,\;\;C{O_2}}},{C_{outside,\;\;{H_2}O}})$
were measured for the St. Louis to Iowa City transport exercise as well as the blower failure test as previously described, and spline fits of these measured values were used in the model for this test (for CO2, mean = 988 ppm, min = 696 ppm, max = 2015 ppm; for H2O, mean = 13.5 mbar, min = 15.8 mbar, max = 18.3 mbar). In the absence of measurements of
 ${C_{outside,\;\;C{O_2}}}$
and
${C_{outside,\;\;C{O_2}}}$
and
 ${C_{outside,\;\;{H_2}O}}$
for the Los Angeles County stationary exercise, the concentration outside the isolator was assumed to be constant and equal to the initial measured concentration inside the isolator (496 ppm CO2, 15.0 mbar H2O).
${C_{outside,\;\;{H_2}O}}$
for the Los Angeles County stationary exercise, the concentration outside the isolator was assumed to be constant and equal to the initial measured concentration inside the isolator (496 ppm CO2, 15.0 mbar H2O).
Results
During both exercises, CO2 and H2O concentrations were elevated inside the isolator, reaching a steady-state value of 4434 ± 1013 ppm CO2 and 22 ± 2 mbar H2O in the transport exercise from St Louis to Iowa City relative to measurements of the ambulance interior of 988 ± 377 ppm CO2 and 16 ± 1 mbar H2O (Figure 2). While the volunteer’s vital signs demonstrated some variability over time, no trends requiring clinical intervention were identified during transport (see Figure 2). Interestingly, self-reported fatigue and pain consistently increased past the third hour of the transport exercise (see Figure 2). Midway through the transport, the volunteer experienced a “mild headache” that worsened to a “tolerable,” “moderate headache” by the time the ambulance reached Iowa City. In the Los Angeles County stationary exercise, concentrations increased from 496 ppm CO2 and 15 mbar H2O to 3038 ± 269 ppm CO2 and 20 ± 1 mbar H2O after 6 minutes (Figure 3).

Figure 2. Measured and modeled environmental parameters and clinical monitoring data obtained during the transport exercise from St Louis, MO, to Iowa City, IA. The volunteer was enclosed within the isolator just prior to the start of data collection.

Figure 3. Measured and modeled environmental parameters from the Los Angeles County stationary exercise. The volunteer was enclosed within the isolator just prior to the start of data collection.
Just prior to simulated blower failure, baseline CO2 and H2O initially attained steady state values (4841 ± 573 ppm CO2 and 19 ± 1 mbar H2O) similar to those previously measured during the St Louis to Iowa City transport exercise (Figure 4). When the blower was turned off for a total of 10 minutes, concentrations exceeded the maximum value measurable by the CO2 sensor (10 000 ppm) within 8 minutes. Water vapor concentration continued to increase to a maximum of 23.4 mbar H2O at 13 minutes after the blower was initially turned off. The volunteer reported that the air inside of the isolator rapidly became “humid” and “stale.” When the blower was turned on again, concentrations (4007 ± 177 ppm CO2, 20.1 ± 0.4 mbar H2O) similar to the initial steady state levels were restored.
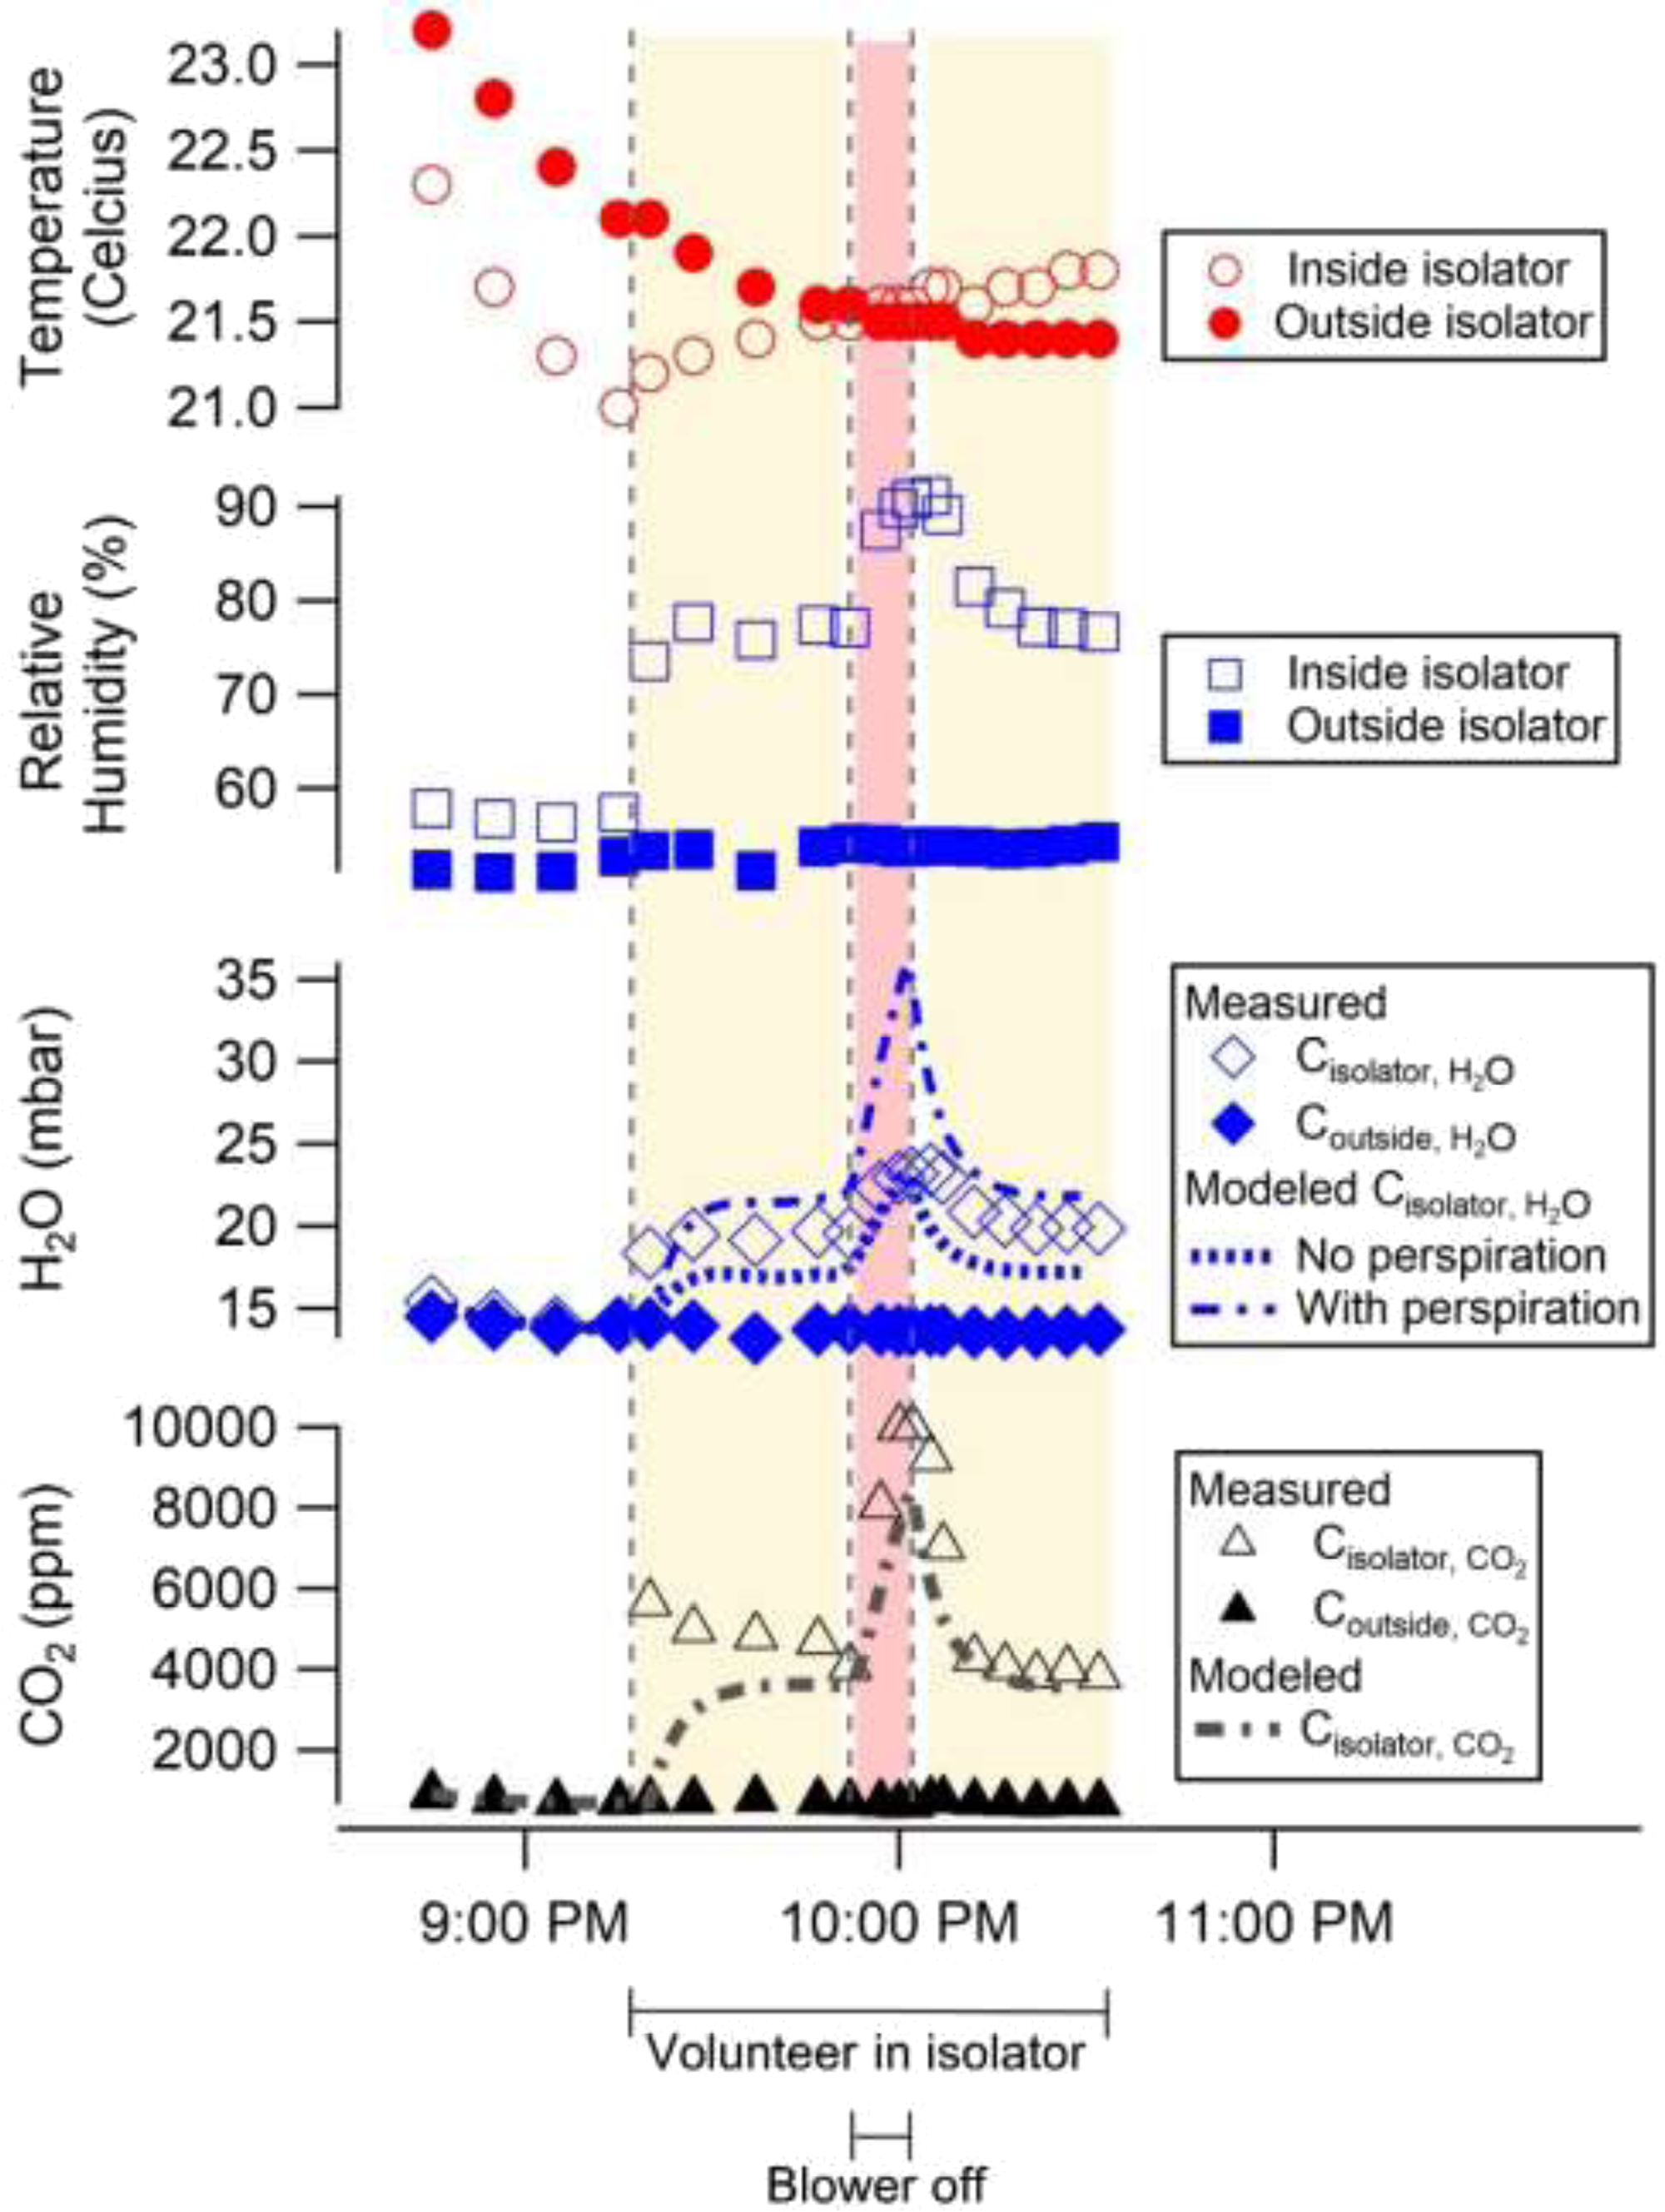
Figure 4. Measured and modeled environmental parameters from a simulated blower failure. The subject entered the isolator at 9:17 PM (with running blower, yellow shading), the blower was turned off at 9:52 PM for 10 minutes (red shading), and then the blower was turned back on at 10:02 PM (yellow shading).
Modeling Results
The agreement between the compartmental model and experimental data supports the hypothesis that the main drivers of CO2 and H2O concentrations in the isolator are human emissions (from respiration and perspiration) and blower air exchange. Even without contemporaneous, time-resolved measurements of respiration rate, tidal volume, exhaled concentrations, and perspiration rate, the median absolute errors for all 3 tests were below 13% for CO2 and below 8% for H2O with perspiration. The mean percentage errors ranged between 17% to 11% for CO2, -9.8 to -10.2% for H2O without perspiration, and 10% to 12% for H2O with perspiration (Supplemental Table 2). Incorporating time-resolved measurements of these parameters would likely improve error metrics even further. For example, an increase in CO2 emissions due to elevated metabolic activity from recent physical activity or digestion could explain the underprediction of CO2 at the beginning of all 3 tests. Reference Zwillich, Sahn and Weil13 The volunteer for the transport exercise and blower failure simulation did eat a light breakfast 2 hours prior to the transport exercise, but simultaneous measurements of respiratory flow rate and exhaled CO2 concentration would be necessary to understand if higher initial emissions were responsible for the initial elevation in CO2. For all 3 tests, accounting for perspiration decreased the median absolute percent error for H2O concentrations. In the St Louis to Iowa City transport exercise and in the Los Angeles County stationary exercise, H2O concentration was underpredicted to a greater degree than CO2 concentration when perspiration was neglected, as would be expected if perspiration was an important source of H2O. Given that H2O concentration was overpredicted with the assumed 0.42 mL/min of perspiration, it is likely that the volunteers’ actual perspiration rate was an intermediate value. In the blower failure test, the model successfully represented the dynamic changes in CO2 concentration as the volunteer entered the isolator and the blower was turned off for 10 minutes and then on again (see Figure 4). The Pearson’s R correlation coefficient between the modeled and experimental data for the blower failure test was 0.91.
The compartmental model was used to investigate how CO2 concentration would increase following blower failure for a longer duration than is possible to determine experimentally with a volunteer in the isolator (Supplemental Figure 1). Without forced airflow to remove CO2, the modeled CO2 concentration in the isolator exceeded the Occupational Safety and Health Administration (OSHA) Permissible Exposure Level (PEL, 5000 ppm, 8-hr time-weighted average) within 7.4 minutes of blower failure. The National Institute for Occupational Safety and Health (NIOSH)-recommended short-term exposure limit (STEL, 30 000 ppm, 15-minute time-weighted average) was exceeded at 93 minutes. 14
Finally, steady-state CO2 concentration inside the isolator was modeled for a range of blower flow rates for 2 different outside CO2 concentrations (which reflect the transport exercise from St Louis to Iowa City and the stationary exercise in Los Angeles County) (Supplemental Figure 2). The CO2 concentration outside of the isolator was lower in the Los Angeles County stationary exercise, likely because the patient compartment doors were open, allowing passive air exchange between the patient compartment and outdoor air. Increasing the air exchange rate of the isolator decreases the steady-state concentration of CO2 inside the isolator. Adding a second blower to the isolator would decrease the modeled steady-state CO2 concentration from 3810 ppm to 2455 ppm if the outside concentration was 988 ppm (as modeled for the St Louis to Iowa City transport exercise), and from 3356 ppm to 1983 ppm if the outside concentration was 496 ppm (as modeled for the Los Angeles County stationary exercise).
Discussion
Stretcher transport isolators enable high-level biocontainment for patients with highly infectious diseases during prehospital care. Active ventilation of this space is necessary to mitigate accumulation of human bioeffluent emissions including exhaled CO2 and water vapor. Reference Carrer, de Oliveira Fernandes and Santos15 While ambient outdoor CO2 concentrations are currently near 400 ppm, indoor CO2 concentrations are elevated by human respiration to 600 to 1000 ppm. Reference Gerlach and Oelßner16,Reference Jacobson, Kler and Hernke17 If an indoor space has reduced ventilation or a high density of people, CO2 concentrations can often exceed 2000 ppm (0.2%). Reference Jacobson, Kler and Hernke17,Reference Zhang, Wargocki and Lian18 Drowsiness and increases in odor intensity attributed to poor air quality can occur at CO2 concentrations of 1000 to 2000 ppm (0.1–0.2%). Reference Bonino19 Headaches, somnolence, poor concentration, increased heart rate, and nausea can manifest at CO2 concentrations anywhere from 2000 to 5000 ppm (0.2–0.5%). Reference Zhang, Wargocki and Lian18,Reference Bonino19 At higher concentrations, hypercapnia can develop; a CO2 concentration of 40 000 ppm (4.0%) is considered immediately dangerous to life or health. Once CO2 concentrations exceed 50 000 ppm (5.0%), severe hypercapnia and respiratory acidosis can lead to seizure, coma, and death. Reference Permentier, Vercammen, Soetaert and Schellemans20
Although steady-state measurements during normal use did not exceed OSHA 8-hr exposure limits for CO2, a critically ill patient requiring emergency transport could be more sensitive to elevated ambient CO2, which has been shown to affect inflammatory processes. Reference Jacobson, Kler and Hernke17 In addition, humans emit other bioeffluents (eg, volatile organic compounds), which may also impact human health. Reference Tang, Misztal, Nazaroff and Goldstein21 When exposed to 3000 ppm of self-generated CO2 with accompanying bioeffluents generated from metabolism, healthy individuals exhibited higher systolic blood pressure, higher salivary alpha-amylase, and lower performance on a cognitive function test than when exposed to CO2 at the same concentration but generated by dosing the room with compressed pure CO2. Reference Zhang, Wargocki and Lian18
In this study, steady-state CO2 concentrations during normal use of the isolator exceeded 3000 ppm, which is above typical indoor concentrations. Ventilation standards for health care facilities (as per the American Society of Heating, Refrigerating and Air-Conditioning Engineers [ASHRAE]) are expressed in air changes per hour (ACH), and the blower of the isolator model used in this study met the minimum requirement for inpatient isolation rooms (12 per hour). 22 However, this metric (ACH) assumes that the patient’s exhaled emissions are diluted by mixing throughout the volume of a typical room, which would be much larger than a stretcher isolator. In the isolator, exhaled CO2 is mixed into a much smaller volume and rapidly accumulates, so that a volumetric ventilation rate per person is a more appropriate specification. For this metric, the isolator ventilation rate (1.9 L/s per person) is below the ASHRAE design standard (2.5 L/s per person) for a residential dwelling or a cell in a correctional facility. 23 Carrer et al. propose an even higher minimum base ventilation rate (4 L/s per person) to prevent harm to human health from poor air quality. Reference Carrer, de Oliveira Fernandes and Santos15 While not intended to address isolators used for high-level containment transport, this base ventilation rate provides a minimum health-based benchmark.
Without active air exchange, a stretcher transport isolator can be vulnerable to rapid accumulation of CO2 and other bioeffluents, as demonstrated by the measurements and modeling which simulated failure of the 4 CFM blower (see Figure 4). In the model, CO2 levels exceeded the OSHA PEL within 10 minutes and the NIOSH recommended short-term exposure limit of 30 000 ppm (15-minute time-weighted average) within 93 minutes (Supplemental Figure 1). In a real-world patient transport situation involving a blower failure, EMS professionals would need to execute a safe process for restoring ventilation or opening the isolator to prevent patient suffocation, while minimizing exposure of health care personnel to infectious aerosols and body fluids. A policy for handling blower failure should be created and incorporated into training and standard operations.
Redundancy in ventilation systems would mitigate the risk of unsafe CO2 levels in the event of a blower unit failure. In the case of the ISO-PODTM Advantage’s current design, this could be accomplished by adding a second blower. In addition, if both blowers were typically in operation (provided that elevated noise and airflow were not a nuisance, and that the additional power demand could be met), the doubled air exchange rate (from 12 hr -1 to 24 hr -1) would improve air quality during normal use of the isolator (Supplemental Figure 2). In particular, the CO2 concentration inside of the isolator would be decreased from 3810 ppm to 2455 ppm if the concentration outside of the isolator was 988 ppm (representative of the St. Louis to Iowa City transport exercise), and from 3356 ppm to 1983 ppm if the concentration outside of the isolator was 496 ppm (reflecting the Los Angeles County stationary exercise). Adding a second blower would increase mean ventilation rate to 3.8 L/s per person, or 95% of the recommended base ventilation rate (>4 L/s per person), although this benchmark assumes a much larger indoor volume per person, so that an even higher ventilation rate may be needed for the same level of health benefit. Reference Carrer, de Oliveira Fernandes and Santos15 Alternatively, a single blower with doubled capacity would similarly improve air quality during normal use but would be more vulnerable to blower failure, which would be less likely to simultaneously befall 2 smaller blowers. The proposed solution of adding a second blower to the isolator studied was not tested. Future work is needed to evaluate this and optimize solutions balancing patient safety and comfort with practical limitations of the ambulance environment.
Furthermore, the variance in baseline CO2 concentrations measured in the ambulance compartments in the St Louis and Los Angeles County exercises illustrates the importance of maintaining adequate ventilation in the ambulance compartment itself. Any failure to ensure fresh air delivery to the ambulance compartment, or failure to engage the exhaust fan, if so equipped, could exacerbate the situation by permitting ambient CO2 in the ambulance compartment to rise, further compromising air quality in the isolator.
In addition to optimizing ventilation of the stretcher transport isolator and ambulance patient compartment, patient selection is also important. Patients should be clinically stable for transport; once a patient is placed in an isolator, the ability to provide complex medical care or perform procedures is significantly limited. Patients breathing at high respiratory rates, whether from infection or other medical conditions, or from the psychological effects of confinement (eg, anxiety, claustrophobia) could potentially hasten the accumulation of CO2 within the isolator.
While this study finds that human emissions and ventilation are the main drivers of CO2 and H2O concentrations inside of the isolator, the precise concentrations at a given time for a given scenario will depend on individual circumstances. For example, the increased ambulance compartment ventilation in the Los Angeles County stationary exercise (with back doors open to outside air) contributed to the 31% difference in average isolator CO2 concentration relative to the higher concentration measured in the St Louis to Iowa City transport exercise. In addition to variability in isolator internal volume (given its flexible walls diaphoresis and the variability of volume displaced by the patient), blower capacity could also differ from unit-to-unit due to wear. Finally, the emissions of the patient could change during transport and vary with their weight, body temperature, metabolism, and disease state. Febrile and critically ill patients are likely to be tachypneic, which may contribute to increased CO2 and H2O emissions in exhaled breath; likewise, diaphoresis may also contribute to increased water vapor emissions.
Limitations
A limitation of this study was that these observations were made from a small convenience sample of 2 operational exercises (each with a single volunteer) involving 2 similar stretcher transport isolators from the same manufacturer. The specific isolator models were selected by convenience as they were already integrated into the participating EMS agency emerging illness preparedness programs. The compartmental model could be improved by direct measurement of ventilation rates and isolator volume as well as more precise measurement of the mass of exhaled CO2 (with capnography and respiratory flow rate waveform monitoring). Such measurements could aid in evaluating whether the internal volume is well-mixed (as the model assumes). Regarding the isolator volume, a known amount of CO2 could be injected with a mass flow controller into an unventilated isolator; the resulting change in concentration could be used to more precisely calculate the isolator’s internal volume from which the person’s volume could be subtracted. Finally, other human bioeffluent emissions (eg, volatile organic compounds), which also affect air quality, were not measured or investigated in this study. Reference Zhang, Wargocki and Lian18,Reference Tang, Misztal, Nazaroff and Goldstein21
Conclusions
As transport isolators see increasing use in civilian EMS for emerging infectious disease response, it is important to be aware of the potential for accumulation of CO2 within this confined space. Adequate ventilation through increased air exchange is necessary to reduce CO2 levels and optimize patient safety and comfort during high-level containment transport.
Acknowledgments
We would like to thank the Abbott EMS Special Isolation Team led by Christine League and William D. Warsing for their participation in this study. We also thank Jiayu Li, PhD, for her technical input into this study. Finally, we thank Paula F. Nickelson, MEd, CHEP, from the Missouri Department of Health and Senior Services for her encouragement and the opportunity to conduct part of this research during the St Louis to Iowa City transport exercise.
Funding statement
AJD received support through a National Science Foundation Graduate Research Fellowship (DGE-1745038). BJW acknowledges support from the Alfred P. Sloan Foundation (G-2018-11133). SYL received support through the Foundation for Barnes-Jewish Hospital and the Washington University Institute of Clinical and Translational Sciences, which in part is supported by the NIH/National Center for Advancing Translational Sciences (NCATS), Clinical and Translational Science Award (CTSA) program (UL1TR002345).
Conflict(s) of interest
The authors declared no potential conflicts of interest with respect to the research, authorship, and/or publication of this paper.
The findings and conclusions in this manuscript represent the opinion of the authors and do not necessarily represent those of the US Department of Health and Human Services, Missouri Department of Health and Senior Services, and National Science Foundation.
Supplementary material
To view supplementary material for this article, please visit https://doi.org/10.1017/dmp.2021.156


