


The full clinical phenotype of many developmental disorders is rarely present at birth, instead becoming visible across a span of time. This is especially true in the case of autism spectrum disorder (ASD) because core deficits span complex social communication and interaction behaviors that emerge slowly even in the typical baby, manifesting late in the first year. In ASD, understanding how and when core social symptoms unfold, what types of symptoms are most strikingly observed early, how stable symptoms are across early development, and whether or not subgroups of infants show different symptom onset patterns is essential in order to identify and treat ASD at the earliest ages possible. Understanding similarities and differences between toddlers with ASD who show clear and strong early signs in contrast to those whose symptoms may emerge more slowly or later are key goals in the field of early identification and could lead to a deeper understanding of etiologies or epigenetic factors that shape early development in ASD.
Almost none of the research on these important questions has come from prospective studies in the general pediatric population. Instead, nearly all that is known comes from prospective studies of a special subpopulation: baby siblings known to be at high risk for ASD because they have older siblings with ASD (Bryson et al., Reference Bryson, Zwaigenbaum, Brian, Roberts, Szatmari, Rombough and McDermott2007; Chawarska et al., Reference Chawarska, Shic, Macari, Campbell, Brian, Landa and Bryson2014; Christensen et al., Reference Christensen, Hutman, Rozga, Young, Ozonoff, Rogers and Sigman2010; Cornew, Dobkins, Akshoomoff, McCleery, & Carver, Reference Cornew, Dobkins, Akshoomoff, McCleery and Carver2012; Ibanez, Grantz, & Messinger, Reference Ibanez, Grantz and Messinger2013; Landa & Garrett-Mayer, Reference Landa and Garrett-Mayer2006; Landa, Gross, Stuart, & Bauman, Reference Landa, Gross, Stuart and Bauman2012; Macari et al., Reference Macari, Campbell, Gengoux, Saulnier, Klin and Chawarska2012; Nadig et al., Reference Nadig, Ozonoff, Young, Rozga, Sigman and Rogers2007; Rozga et al., Reference Rozga, Hutman, Young, Rogers, Ozonoff, Dapretto and Sigman2011; Young et al., Reference Young, Rogers, Hutman, Rozga, Sigman and Ozonoff2011; Zwaigenbaum et al., Reference Zwaigenbaum, Bryson, Rogers, Roberts, Brian and Szatmari2005). These studies report overall that, during the first 12 months of life, babies who eventually develop ASD appear largely indistinguishable from those who do not: they exhibit similar levels of social engagement, babbling, and visual attention patterns (Landa & Garrett-Mayer, Reference Landa and Garrett-Mayer2006; Landa et al., Reference Landa, Gross, Stuart and Bauman2012; Rozga et al., Reference Rozga, Hutman, Young, Rogers, Ozonoff, Dapretto and Sigman2011; Sacrey, Bryson, & Zwaigenbaum, Reference Sacrey, Bryson and Zwaigenbaum2013; Zwaigenbaum et al., Reference Zwaigenbaum, Bryson, Rogers, Roberts, Brian and Szatmari2005). Then, between 12 and 24 months, reduced levels of social attention and social communication as well as increased repetitive behavior with objects emerges (Elison et al., Reference Elison, Wolff, Reznick, Botteron, Estes and Gu2014; Zwaigenbaum, Bauman, Choueiri, et al., Reference Zwaigenbaum, Bauman, Choueiri, Fein, Kasari, Pierce and Wetherby2015; Zwaigenbaum et al., Reference Zwaigenbaum, Bryson, Rogers, Roberts, Brian and Szatmari2005). For example, Ozonoff et al. (Reference Ozonoff, Iosif, Baguio, Cook, Hill, Hutman and Young2010) followed infants eventually diagnosed with ASD who were predominantly recruited from a larger longitudinal infant sibling study as well as a low-risk group of typically developing (TD) children from ages 6 to 36 months. The two groups were indistinguishable at younger ages, and differences between them did not emerge until 12 to 18 months of age. From those early ages to age 3 years there was a slow decline in social skills in the group that eventually developed ASD, including declines in social engagement, social smiling, and looking toward faces.
In another prospective baby–sibling design study, Ozonoff et al. (Reference Ozonoff, Young, Landa, Brian, Bryson, Charman and Iosif2015) found that over half of the baby siblings diagnosed with ASD at 3 years of age were not classified as such at 18 or 24 months. This study highlighted the heterogeneity in the onset of symptoms in baby siblings and the difficulty in identifying all individuals with ASD at a very young age, as behavioral symptoms may become apparent at different points in development across children. Ozonoff et al. (Reference Ozonoff, Young, Landa, Brian, Bryson, Charman and Iosif2015) also reported that many toddlers eventually diagnosed with ASD initially exhibited some delays in development (e.g., language delays) prior to being identified with ASD, suggesting that differential diagnoses at very young ages may often be unclear as well. Thus, the key issue may not be variable symptom expression per se, but a weakness in sensitivity and specificity properties of diagnostic instruments. Late-onset cases of ASD documented at older ages through retrospective reports were found to have initially received different diagnoses, commonly including language impairment, general developmental delay, and intellectual disability (Davidovitch, Levit-Binnun, Golan, & Manning-Courtney, Reference Davidovitch, Levit-Binnun, Golan and Manning-Courtney2015; Jónsdóttir, Saemundsen, Antonsdóttir, Sigurdardóttir, & Ólason, Reference Jónsdóttir, Saemundsen, Antonsdóttir, Sigurdardóttir and Ólason2011; Wiggins, Baio, & Rice, Reference Wiggins, Baio and Rice2006).
A recent review (Zwaigenbaum, Bauman, Stone, et al., Reference Zwaigenbaum, Bauman, Stone, Yirmiya, Estes, Hansen and Wetherby2015) cautioned about generalizing from high-risk baby siblings to infants in the general pediatric population where much less is known about developmental changes and diagnostic stability at very early ages. Thus, missing are prospective studies of the general pediatric population that investigate the age of initial diagnosis and early developmental changes in autism symptom domains prior to a confirmed ASD diagnosis. Perhaps differences in onset patterns and severity of symptoms at very early ages may be contributing to the wide range of ages at which toddlers receive their initial diagnoses and the difficulty of obtaining reliable and consistent diagnostic judgments over time. Alternatively, perhaps current diagnostic instruments are less sensitive to symptom detection at very early ages so that infants and toddlers with subtle early symptoms are not detected. In addition, while reliance on only standardized test scores to understand symptom and diagnostic onset patterns provides a macroscopic view of this issue, more in-depth analyses of early developmental behaviors may give more sensitive and “preclinical” information about early-onset patterns social and stereotyped behaviors in ASD (Bedford et al., Reference Bedford, Elsabbagh, Gliga, Pickles, Senju and Charman2012; Wan et al., Reference Wan, Green, Elsabbagh, Johnson, Charman and Plummer2012; Zwaigenbaum et al., Reference Zwaigenbaum, Bryson, Rogers, Roberts, Brian and Szatmari2005). Finally, toddlers in the general pediatric population who move onto the spectrum from an initial nonspectrum diagnosis are especially important to study as they may represent an etiologically distinct group or may have different long-term outcomes from those who show early symptom onset. While most researchers refer to such individuals as “late onset” and in some cases provide the unique distinction of “regression,” these labels imply completely typical development prior to a specific age point. However, such labels may not best characterize a slow unfolding of symptoms or the presence of symptoms that went undetected by standardized diagnostic instruments. As such, we instead prefer the terms early and late diagnosed, as this leaves open the possibility that symptoms were always present, and it is merely time at which the toddler was diagnosed and/or the severity of symptoms displayed that differs between toddlers. To resolve the latter questions as well as the above issues, prospective longitudinal studies of toddlers in the general pediatric population are required.
Here, we report a longitudinal study of a large sample of 1- to 2-year-olds identified by failure of universal developmental screening procedures or parent or physician concern from the general pediatric population. Beginning at 12 months of age using the 1-Year Well-Baby Check-Up Approach (Pierce, Carter, et al., Reference Pierce, Carter, Weinfeld, Desmond, Hazin, Bjork and Gallagher2011), early developmental patterns were examined longitudinally until age 3 years using multiple nonstandard as well as standard behavioral measures of early development. Nonstandard measures included examining levels and quality of engagement with caregiver during free play; levels of expressive language during free play; examinations of how a toddler explores his or her environment (Pierce & Courchesne, Reference Pierce and Courchesne2001); and patterns of eye gaze using eye tracking (Pierce, Carter, et al., Reference Pierce, Carter, Weinfeld, Desmond, Hazin, Bjork and Gallagher2011; Pierce, Conant, Hazin, Stoner, & Desmond, Reference Pierce, Conant, Hazin, Stoner and Desmond2011; Pierce et al., Reference Pierce, Marinero, Hazin, McKenna, Barnes and Malige2016). Early- and late-diagnosed toddlers were identified in our sample based on the time course of first provisional, or at-risk ASD diagnosis and referral for autism specific services. Developmental trajectories and initial behavioral presentations between early- and late-diagnosed toddlers were also compared. Consideration of the presence or absence of a regression symptom onset pattern was determined by examining changes in raw test scores across time.
Methods
Participants
Eligible participants were recruited from a larger ongoing study examining ASD detection in the general population using universal broadband screening, the Communication and Symbolic Behavior Scales (CSBS; Wetherby, Brosnan-Maddox, Peace, & Newton, Reference Wetherby, Brosnan-Maddox, Peace and Newton2008) at ages 12 to 24 months (i.e., 1-Year Well-Baby Check-Up Approach; see Pierce, Carter, et al., Reference Pierce, Carter, Weinfeld, Desmond, Hazin, Bjork and Gallagher2011, for more information) as well as from community referrals. To be included in the current study, participants were required to have at least two assessments prior to age 3 years with their first assessment occurring before 24 months (M = 16.58) and last assessment at 32 months or later to confirm diagnoses (M = 36.98). Toddlers were also required to have participated in all standardized assessments at every diagnostic visit. Ninety-five percent of children also participated in at least one nonstandard experimental assessment at every diagnostic visit. This resulted in a total sample size of 273 toddlers (107 toddlers with ASD, and 52 toddlers with language delay [LD] and 114 TD toddlers for comparison).
Diagnoses for all toddlers were determined using best practice guidelines for diagnosing toddlers with ASD and other developmental disorders, including the use of standardized observational measures of child behavior and parent report (Perry, Condillac, & Freeman, Reference Perry, Condillac and Freeman2002). Doctoral-level psychologists with specialized experience in child development and ASD interviewed the parents about the child's development, observed the child's performance on a battery of assessments (described below), and used clinical judgment to make a final diagnosis. Toddlers were followed longitudinally, and were reassessed every 9–12 months until age 3 years. Toddlers participated in all standardized assessments described below at each longitudinal evaluation. Each experimental measure attempted collection at each evaluation; however, missing data across paradigms exists for instances of scheduling difficulties or technical difficulties. All procedures were approved by the institutional Human Research Protections Program, and informed consent was obtained for all participants.
Measures
At each evaluation child functioning was assessed using the Autism Diagnostic Observation Schedule (ADOS), the Mullen Scales of Early Learning (MSEL), and the Vineland Adaptive Behavior Scales (VABS). Toddlers also participated in three experimental measures, including an eye-tracking task, an exploration task, and a parent–child freeplay interaction. Additional background information was also gathered including family history of ASD and any treatment received by the child.
ADOS
The ADOS is a semistructured assessment used to measure behavioral features of ASD (Lord, Rutter, DiLavore, & Risi, Reference Lord, Rutter, DiLavore and Risi2002; Lord et al., Reference Lord, Rutter, DiLavore, Risi, Gotham and Bishop2012). The appropriate module of the ADOS (i.e., Toddler, 1, or 2) was used as a tool to help inform the clinician's overall diagnostic judgment. The first edition of the ADOS was used for the first 256 assessments, and the second edition was used for the remaining longitudinal assessments across children.
MSEL
The MSEL assesses cognitive and motor development through a series of structured tasks and provides standardized scores for visual reception, receptive language, expressive language, and fine motor skills (Mullen, Reference Mullen1995).
VABS
The VABS provides a measure of adaptive behavior through caregiver report and provides standardized scores for communication, daily living skills, socialization, and motor skills (Sparrow, Balla, Cicchetti, Harrison, & Doll, Reference Sparrow, Balla, Cicchetti, Harrison and Doll1984; Sparrow, Cicchetti, & Balla, Reference Sparrow, Cicchetti and Balla2005). The first edition of the VABS was used for the first 59 assessments, and the second edition was used for all following assessments.
Geometric Preference Test (Geo-Pref Test)
The Geo-Pref Test is an eye-tracking paradigm that analyzes visual stimuli preferences (Pierce, Conant, et al., Reference Pierce, Carter, Weinfeld, Desmond, Hazin, Bjork and Gallagher2011; Pierce et al., Reference Pierce, Marinero, Hazin, McKenna, Barnes and Malige2016). During the eye-tracking task two dynamic images were presented side-by-side for a total of 60 s. One side featured a social stimulus, with scenes of children engaging in aerobics and dancing, whereas the other side featured a nonsocial stimulus, with a series of short sequences of moving geometric shapes. See Figure 1 for sample images. The percentage of time spent looking at social or nonsocial stimuli at initial evaluations was compared across diagnostic groups. Previous research has demonstrated that the Geo-Pref Test has high specificity for ASD and identifies a potentially unique phenotype characterized by a strong preference to visually examine nonsocial, moving geometric stimuli rather than social stimuli (Pierce, Conant, et al., Reference Pierce, Carter, Weinfeld, Desmond, Hazin, Bjork and Gallagher2011; Pierce et al., Reference Pierce, Marinero, Hazin, McKenna, Barnes and Malige2016). Forty-three percent of the sample had valid data available from the Geo-Pref Test. Fifty percent of the sample did not participate in the Geo-Pref Test assessment at intake (i.e., they participated in a different eye-tracking assessment); 5% of the sample did not have valid data due to behavioral difficulties of the child, resulting in an insufficient amount of data; and 2% were excluded due to technical difficulties.

Figure 1. (Color online) Illustration of experimental measures. (a) Sample images from the Geometric Preference Test. In this eye-tracking paradigm a social stimulus (children doing aerobics) and a geometric stimulus (moving geometric shapes) are displayed for 1 min, and the child's gaze is recorded. (b) Layout of the exploration paradigm. Standardized locations of items are depicted and description of items are as follows: (1) ball of string, (2) glitter wand, (3) ball with two small nets, (4) shoebox that contains a stretch tube that emits noise, (5) picture book, (6) shoebox that contains a piece of purple cloth, (7) Slinky®, (8) toy tuck, (9) large plastic container with lid that contains an expanding sphere toy, (10) two lizards, (11) toy boat, (12) girl doll and boy doll, (13) clear plastic container with lid that contains a piece of printed cloth, (14) rhino, (15) multicolored cube with spinning wheels, (16) flat gold circle, (17) Elmo® keys that emit sound effects, and (18) Koosh® ball. (c) Layout of the parent–child interaction paradigm. Standardized locations of items are depicted and description of items are as follows: (1) pirate hat, cowboy hat, tiara, crown, hand puppets; (2) two nets with balls, football; (3) drums, toy radio, maracas, two cans connected by a string, toy microphone; (4) baby doll, stroller, two bottles; (5) small picture book, Mr. Potato Head®, Thomas the Train®, and Raggedy Ann® doll.
Exploration task
In the 10-min exploration task, toddlers were video recorded and allowed to play in a 12- × 12-ft. room with toys placed in standardized locations throughout the room (Pierce & Courchesne, Reference Pierce and Courchesne2001). See Figure 1 for a depiction of the observation room. Some of the toys were functional items (e.g., a ball), while others were nonfunctional (e.g., a piece of string). In addition, some of the toys were placed in containers that were difficult to open, while the remaining toys were simply placed on the floor. The caregiver was in the room with the child, but was seated to the side, instructed not to interact with the child, and was given reading material to appear occupied. Exploration tasks completed at initial evaluations were coded for the number of items and containers explored, the amount of movement about the observation room, and the percentage of time engaged in (a) appropriate exploration and play, (b) stereotypic exploration and play, and (c) off-task behavior. These results were compared across diagnostic groups. See coding procedures below for further information. Previous research has shown that children with ASD, in comparison with TD peers, show reduced rates of exploration, increased passivity, and often play nonfunctionally or stereotypically (Pierce & Courchesne, Reference Pierce and Courchesne2001). Eighty-four percent of the sample had an exploration video available. The task was not attempted with the remaining children due to scheduling difficulties and/or technical difficulties with video recording equipment.
Quantity of exploration coding
Exploration observations at initial assessments were coded using a continuous 5-s partial-interval scoring procedure. Using this procedure, the 10-min observation was broken down into 5-s intervals during which the observer recorded whether the child was exploring any of the assessment items. If the child explored an item during the interval, defined as touching and interacting with an object, the interval was marked for exploration. The interval was not marked if the behavior did not occur during the interval. Exploration of each item in the assessment was recorded individually, allowing for a count of the number of toy items and containers explored to be calculated. Videos were also coded to identify the child's movement about the observation room. The assessment room was divided into quadrants marked by masking tape (see Figure 1 for diagram of the layout). Continuous 5-s quasi whole-interval scoring was used to identify which quadrant the child was in for the majority of the interval. The number of quadrant changes was then calculated for each child to quantify the amount of movement during the observation. If the child was not in view of the camera, the interval was marked as “unscorable.” The number of items explored, the number of containers explored, and the amount of movement about the observation room were used in analyses.
Type of exploration coding
Exploration observations at initial assessments were coded for the type of exploration or play the child was engaging in. Videos were coded using a continuous 5-s quasi whole-interval scoring procedure. Using this procedure, the 10-min observation was broken down into 5-s intervals, and the scorer marked a single play category to best represent the entire interval. Scorers selected one of three main coding categories: appropriate exploration and play, stereotypic exploration and play, and off-task behavior. Appropriate play included any engaged behavior with an object that was not stereotypic. In order to code stereotypic exploration and play, coders were first given a list of classic examples of stereotyped behaviors (e.g., spinning wheels or visual inspection of objects) to familiarize them with more common behaviors. In order to capture more nuanced instances of repetitive play, coders were instructed to code any repeated play action that occurred for 10 or more seconds (e.g., repeatedly knocking down a toy doll or rotating a box lid repeatedly), as stereotyped exploration and play as well. Off-task behavior included time not interacting with an object (e.g., looking around the room or trying to access parent). If the child was out of the view of the camera, the interval was marked as “unscorable.” The percentage of the total intervals in which the target behavior occurred was recorded for each behavior category, resulting in the percentage of time spent engaging in appropriate exploration or play, stereotypic behavior and play, or off-task, and these scores were then used in analyses.
Parent–child interaction (PCI) task
The PCI task consisted of a 10-min, video-recorded, free-play interaction between the child and one parent. The parent–child dyad was given access to a standardized set of age-appropriate toys placed in standardized locations about the observation room (see Figure 1 for a depiction of the observation room setup). The parent was instructed to play with the child as he or she normally would at home. PCI observations completed at initial evaluations were coded for child gestures, approach to parent, social vocalizations, orientation toward parent, and social referencing. Results were compared across diagnostic groups. See coding procedures below for further information. Differences in social responsiveness reported by caregivers or observed during interactions with caregivers have been identified as early markers of ASD (Wan et al., Reference Wan, Green, Elsabbagh, Johnson, Charman and Plummer2012; Zwaigenbaum et al., Reference Zwaigenbaum, Bryson, Rogers, Roberts, Brian and Szatmari2005). Sixty-eight percent of the sample had an exploration video available. The task was not attempted with the remaining children due to scheduling difficulties and/or technical difficulties with video recording equipment.
PCI coding
PCI observations at initial assessments were coded for several child social behaviors. Videos were coded using a continuous 5-s partial-interval scoring procedure. Using this procedure, the 10-min observation was broken down into 5-s intervals, and the scorer recorded whether any of the target behaviors (i.e., reaching, pointing, showing, giving, approach, social vocalizations, or social referencing) occurred at any point during the interval. The interval was not marked if the behavior did not occur during the interval, and the interval was only marked once if the behavior occurred multiple times during the interval. Orientation toward parent was coded if the child oriented his or her body toward the parent for the majority of the interval. If the child was out of the view of the camera, the interval was marked as “unscorable.” The total number of intervals in which the target behavior occurred was recorded for each target behavior, and the percentage of intervals engaging in the behavior was calculated. The percentage of intervals the child used all gestures combined, used social gestures, approached the parent, used social vocalizations, was oriented toward parent, and demonstrated social references were included in the analyses.
Interrater reliability
Interrater reliability was calculated for a random sample of videotapes from both the exploration and PCI tasks. Two coders independently coded 30% of videos for each paradigm to check reliability of scoring. All coders were kept blind to child diagnoses throughout the coding process. Reliability was assessed using single measures intraclass correlation (two-way mixed-effect model using absolute agreement). High agreement was found across all variables (rs = .763–.993, all ps < .001).
Identification of simplex and multiplex cases
Given that the majority of symptom onset research has utilized the sibling design, here we sought to estimate the percentage of subjects in our study who were either simplex or multiplex cases. Based on parent report, participants were considered a simplex case if they had siblings but none had an ASD, a multiplex case if they had one or more siblings with ASD, and a stoppage case if they were the only child in the family, and therefore simplex or multiplex status could not be determined.
Treatment information
At the final diagnosis age visit, parents filled out a treatment survey form documenting the quantity of services ever received by the child, including developmental services (e.g., speech therapy, physical therapy, and occupational therapy) and autism-specific treatment (e.g., behavioral or developmental-based therapy).
Data analysis
Group membership designation
Diagnostic group designation for the early-onset (EarlyDx-ASD) and late-onset (LateDx-ASD) groups was determined using diagnostic criteria for ASD based on the ADOS and clinical judgment. Toddlers identified as at risk for ASD at initial evaluations and all subsequent evaluations were included in the EarlyDx-ASD group. For purposes of this study, children were identified as “at risk” for ASD until that diagnosis was confirmed at age 3 years when a final diagnosis was given by the psychologist. This procedure was used in order to avoid undue stress on parents during a time when the certainty of diagnoses may be less robust. However, all children reported herein met final clinical criteria for ASD and were referred for appropriate autism-focused services as soon as they are identified as at risk for ASD. Toddlers identified as nonspectrum at initial evaluations, but then later identified as at risk for ASD were included in the LateDx-ASD group. All diagnoses were confirmed at age 3 years. Toddlers identified with a non-ASD LD at initial evaluations were included in the LD group. Ten toddlers in the LD group continued to demonstrate a delay in language at age 3, and 42 did not. On average, children no longer met criteria for LD at 32.1 months of age (SD = 6.3, range 20.2–48). Toddlers in the TD group were identified as typical at all assessments and did not have a history of autism in the family. The EarlyDx-ASD was seen an average 3.1 times (SD = 0.8, range = 2–5), the LateDx-ASD group 3.3 times (SD = 0.8, range = 2–5), the LD group 3.1 times (SD = 0.8, range = 2–5), and the TD group 3.4 times (SD = 0.8, range = 2–5). A Pearson chi-square test revealed no significant differences between groups for the number of evaluations completed.
Between-group analysis
Due to the positive skew of the data from experimental measures, Poisson regression was used to examine potential group differences for the exploration and PCI paradigms as they represented count data (number of intervals engaging in a behavior). Total time in the experiment was used as an offset variable to accommodate for any brief periods of time the child was off-screen, precluding accurate coding. Age was included as a covariate. Significant effects were followed by planned contrasts with Bonferroni correction for multiple comparisons. The Geo-Pref Test data also presented with a positive skew, and a Kruskal–Wallis nonparametric test was used to examine differences between diagnostic groups. Bonferroni-corrected pairwise comparisons are reported.
Trajectory analysis
Growth curve analysis (JMP Pro 11, SAS Institute Inc.) was used to examine longitudinal trajectories of development on the ADOS, MSEL, and VABS from approximately 12 months up to 48 months of age. Growth curve analysis is a type of multilevel modeling used for longitudinal data that estimates between-subject differences while taking into account within-subject change through the use of both fixed and random components. In this type of analysis, separate intercepts and slopes are calculated for each child in order to control for the high correlations among repeated measures on the same individuals over time. Thus, a growth trajectory is estimated for each subject and then is combined with estimates from the other individuals to estimate an overall mean growth rate for the entire group. Due to this design, growth curve analysis offers flexibility in dealing with repeated observations and variable amounts of time between repeated measurements across subjects (Curran, Obeidat, & Losardo, Reference Curran, Obeidat and Losardo2010). These benefits made growth curve analysis useful within the constraints of the current data.
Growth curve modeling was used to compare the EarlyDx-ASD and LateDx-ASD cases with respect to the initial scores on the MSEL and VABS at 12 months of age (i.e., the intercept), and the rate of change from 12 to 48 months of age (i.e., the slope). Within each model of MSEL and VABS scores, diagnostic group, age at the time of assessment, and the interaction between diagnostic group and age at assessment were considered as fixed effects. Age at which each subject's assessment was conducted was also specified as a random effect in the model. This specification allowed each individual to have his or her own slope (growth rate of each MSEL or VABS score) in the model apart from the population slope (growth rate). Because subjects had variable amounts of assessments, ranging from 2 to 5 assessments over the course of the study, linear models were used, as higher order models could not be modeled for all subjects due to a lack of sufficient number of time points.
Change scores
In order to determine if toddlers with ASD lost skills during the course of the study, a change score was created for each child using raw scores from within each subscale of the MSEL. Specifically, the raw score from the initial evaluation age was subtracted from the exit evaluation age raw score. This analysis was performed to look for evidence of regression of skills over time in toddlers with ASD.
Results
Onset patterns of ASD
Of the 107 toddlers eventually identified with ASD, 69 toddlers were diagnosed early with ASD (EarlyDx-ASD), defined as meeting diagnostic criteria for ASD based on the ADOS and clinical judgment at their initial evaluation (mean age = 19.6 months, SD = 3.8, range = 12.2–24.9) and continued to have an ASD diagnosis at all subsequent evaluations. Conversely, 38 toddlers were diagnosed late (LateDx-ASD), defined as being initially identified as nonspectrum at ages <24 months (mean age = 16.35 months, SD = 3.6, range = 12.4–24.8) but were identified as meeting diagnostic criteria for ASD at a subsequent evaluation (mean age = 28.35 months, SD = 6.3, range = 18.6–43.5). At the initial evaluation, 21 of the 38 LateDx-ASD fell in the little-to-no concern level on the ADOS Toddler module (ADOS-T), 8 in mild-to-moderate concern, and 9 in the moderate-to-severe concern. However, none of these children were diagnosed with ASD at this initial time point; rather, 11 toddlers were identified as TD (6 of whom had older siblings with ASD), 15 with a LD, 9 with a developmental delay, 1 with a motor delay, and 2 toddlers considered to have some features of ASD but did not show enough symptoms of ASD to meet DSM criteria and scored within normal ranges on assessments. Conversely, at their initial evaluation 5 of the EarlyDx-ASD fell in the mild-to-moderate concern level on the ADOS-T and 64 fell in the moderate-to-severe concern level, and all were identified with ASD. For the LD group, 43 fell in the little-to-no concern level, 4 in the mild-to-moderate concern, and 5 in the moderate-to-severe concern level, and all were identified with LD at their initial evaluation. Finally, all of the TD toddlers fell in the little-to-no concern area at the initial evaluation. See Table 1 and Figure 2 for further description.

Figure 2. (Color online) Percentage of toddlers who were in the little-to-no, mild-to-moderate, or moderate-to-severe ranges of concern on the Autism Diagnostic Observation Schedule at their first diagnostic evaluation.
Table 1. Clinical profile on standardized assessments at initial evaluation age across diagnostic groups
Note: Means (standard deviations) and Bonferroni-corrected pairwise comparisons are provided. Dx, diagnosis; ASD, autism spectrum disorder; LD, language delay; TD, typically developing; MSEL, Mullen Scales of Early Learning; VABS, Vineland Adaptive Behavior Scales; ADOS, Autism Diagnostic Observation Schedule.
*p ≤ .05. **p ≤ .01. ***p ≤ .001.
Early behavioral phenotype
Group averages, standard deviations, and Bonferroni-corrected post hoc comparisons between diagnostic groups are listed in Table 2. A sample of main findings is depicted in Figure 3. Poisson regressions with age at evaluation as a covariate and with an offset variable of total number of intervals child was in view during the observation to adjust for any minor observation time differences were used to examine potential group differences within each experimental measure (eye tracking, exploration, and PCI paradigms). Significant effects were followed by planned contrasts with Bonferroni correction for multiple comparisons. A Kruskal–Wallis test was used to examine differences between groups on the Geo-Pref Test, followed by Bonferroni-corrected post hoc comparisons.
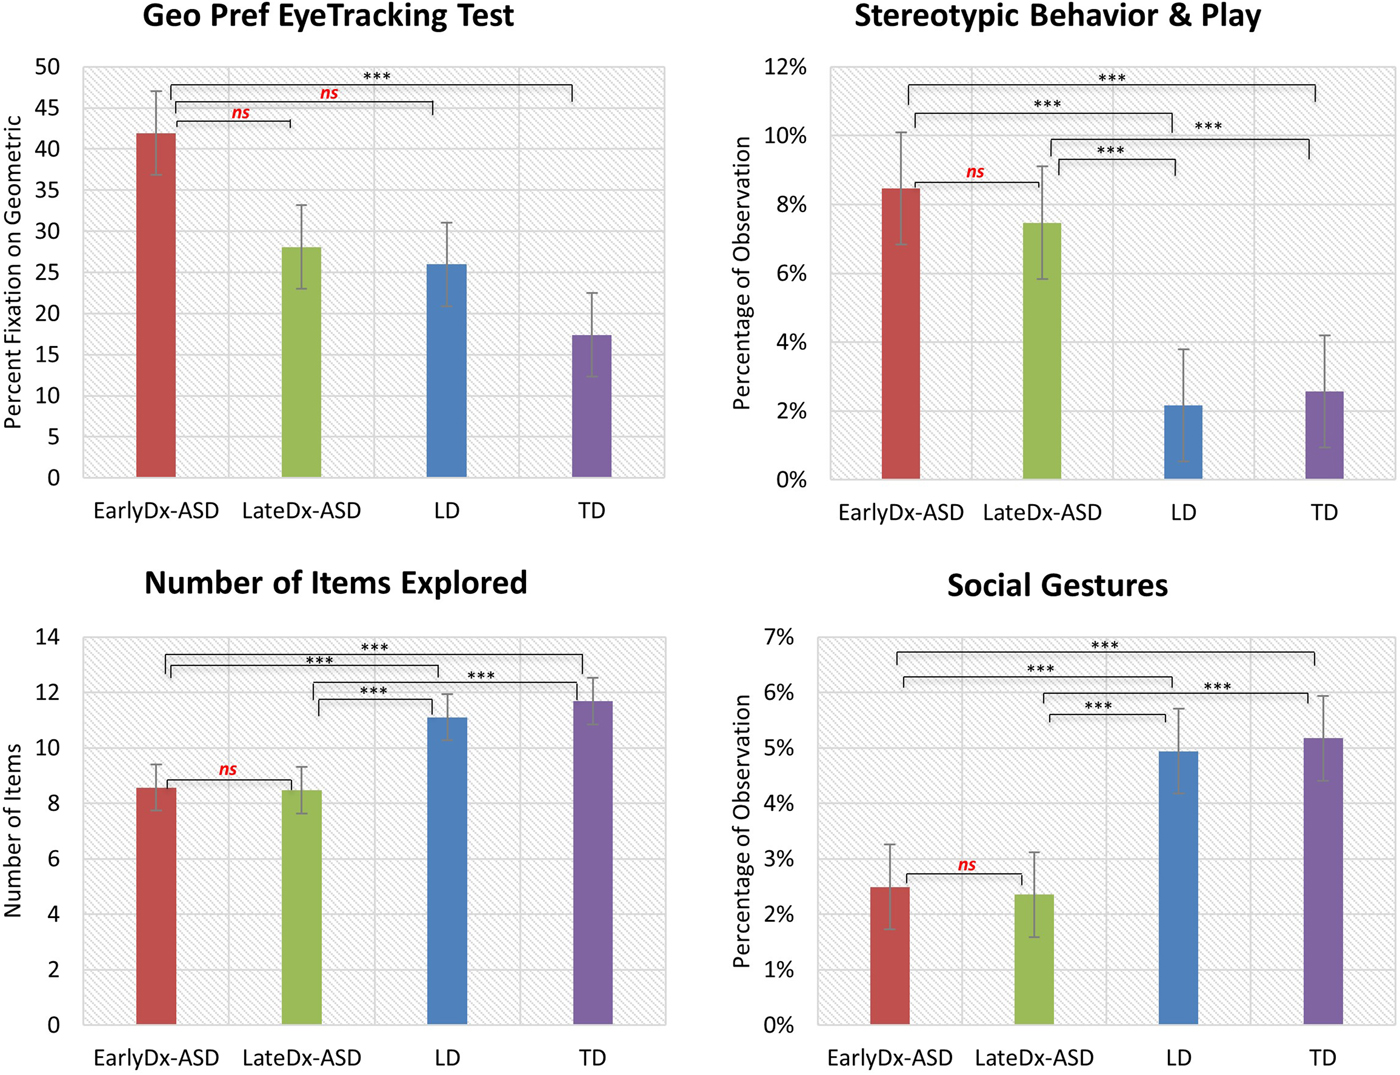
Figure 3. (Color online) Main findings from early behavioral phenotype analysis across diagnostic groups. Differences in preferences for social or geometric images, stereotyped and repetitive behavior, exploratory behavior, and social behavior were seen across diagnostic groups at young ages.
Table 2. Performance on eyetracking, exploration, and PCI tasks at initial evaluation age across diagnostic groups

Note: Means (standard deviations) and significance of Bonferroni-corrected pairwise comparisons are provided. Dx, diagnosis; ASD, autism spectrum disorder; LD, language delay; TD, typically developing.
*p ≤ .05. **p ≤ .01. ***p ≤ .001.
Geo-Pref Test
One hundred eighteen participants (33 EarlyDx-ASD, 13 LateDx-ASD, 21 LD, 51 TD) had eye-tracking data from the Geo-Pref Test available from their initial evaluation age visit. Seventy-nine percent of these children are represented in previous reports of the utility of the Geo-Pref Test (Pierce, Conant, et al., Reference Pierce, Carter, Weinfeld, Desmond, Hazin, Bjork and Gallagher2011; Pierce et al., Reference Pierce, Marinero, Hazin, McKenna, Barnes and Malige2016). One hundred thirty-seven (32 EarlyDx-ASD, 22 LateDx-ASD, 29 LD, 54 TD) children did not complete the Geo-Pref Test due to either difficulties with scheduling or the child was assessed with a different eye-tracking paradigm on that date. Thirteen (4 EarlyDx-ASD, 2 LateDx-ASD, 2 LD, 5 TD) were excluded due to behavioral difficulties of the child resulting in an insufficient amount of data or data that did not meet quality standards, and 5 (1 LateDx-ASD, 4 TD) were excluded for technical difficulties. A Kruskal–Wallis test showed an overall significant difference in the amount of time looking at geometric stimuli across groups (χ2 = 23.28, p < .001).
Exploration quantity
Two hundred twenty-eight participants (58 EarlyDx-ASD, 34 LateDx-ASD, 39 LD, 97 TD) had data available from their initial evaluation age visit. The remaining children did not complete the exploration task due to scheduling or technical difficulties. Poisson regression revealed significant differences between groups on the number of items explored (Wald χ2 = 52.47, p < .001) and the number of containers explored (Wald χ2 = 16.63, p = .001). There were no significant differences between groups on the amount of movement about the observation room (Wald χ2 = 2.03, p = .57).
Exploration type and play
Poisson regressions showed significant differences between groups on the amount of appropriate exploration and play (Wald χ2 = 81.88, p < .001), the amount of stereotypic exploration and play (Wald χ2 = 284.97, p < .001), and the amount of off-task behavior (Wald χ2 = 90.36, p < .001).
PCI
One hundred eighty-seven participants (50 EarlyDx-ASD, 25 LateDX-ASD, 33 LD, 79 TD) had data available from their initial evaluation age visit. The remaining children did not complete the PCI observation due to scheduling or technical difficulties. Poisson regression revealed significant difference between groups on the amount of all gestures (Wald χ2 = 71.88, p < .001), social gestures (Wald χ2 = 134.53, p < .001), social vocalizations (Wald χ2 = 392.65, p < .001), social referencing (Wald χ2 = 160.39, p < .001), amount of approach to parent (Wald χ2 = 13.78, p = .003), and orientation toward parent (Wald χ2 = 13.41, p = .004).
Diagnostic and psychometric developmental trajectories
Longitudinal scores across assessments were used to create developmental trajectories using mixed-effect modeling. For ADOS total scores, null effects were observed for age (F = 0.029, p = .864), a main effect for diagnostic group (F = 633.93, p < .0001), and an Age × Diagnostic Group interaction (F = 46.626, p < .0001). Expressive language (EL), receptive language (RL), and visual reception (VR) domains of the MSEL were analyzed. Significant main effects of age were found for the EL and RL domains (EL: F = 33.087, p < .0001; RL: F = 14.584, p = .0002; VR: F = 0.265, p = .607), and a main effect for diagnostic group was found for all variables (EL: F = 111.254, p < .0001; RL: F = 122.431, p < .0001; VR: F = 74.416, p < .0001). A significant interaction between age and diagnostic group was found for the EL and VR domains (EL: F = 8.726, p < .0001; RL: F = 1.639, p = .181; VR: F = 8.271, p < .0001). On the VABS socialization (Soc) and communication (Comm) domains we observed significant main effects of age (Soc: F = 13.243, p = .0003; Comm: F = 66.364, p < .0001), diagnostic group (Soc: F = 115.567, p < .0001; Comm: F = 113.149, p < .0001), and an Age × Diagnostic Group interaction (Soc: F = 16.091, p < .0001; Comm: F = 9.034, p < .0001). See Figure 4 for trajectory graphs.

Figure 4. (Color online) Developmental trajectories of performance on the Autism Diagnostic Observation Schedule, the Mullen Scales of Early Learning, and the Vineland Adaptive Behavior Scales across diagnostic groups.
MSEL change scores
On average, the EarlyDx-ASD and LateDx-ASD groups showed positive change in raw scores across all MSEL domains from initial evaluations to exit evaluations. The mean change in raw score on the expressive language, fine motor, receptive language, and visuospatial domains on the MSEL for the EarlyDx-ASD group were +11.4, +8.5, +11.9, and +10.8, respectively, and +13.5, +9.3, +13.0, and +13.0 for the LateDx-ASD group (see Figure 5).
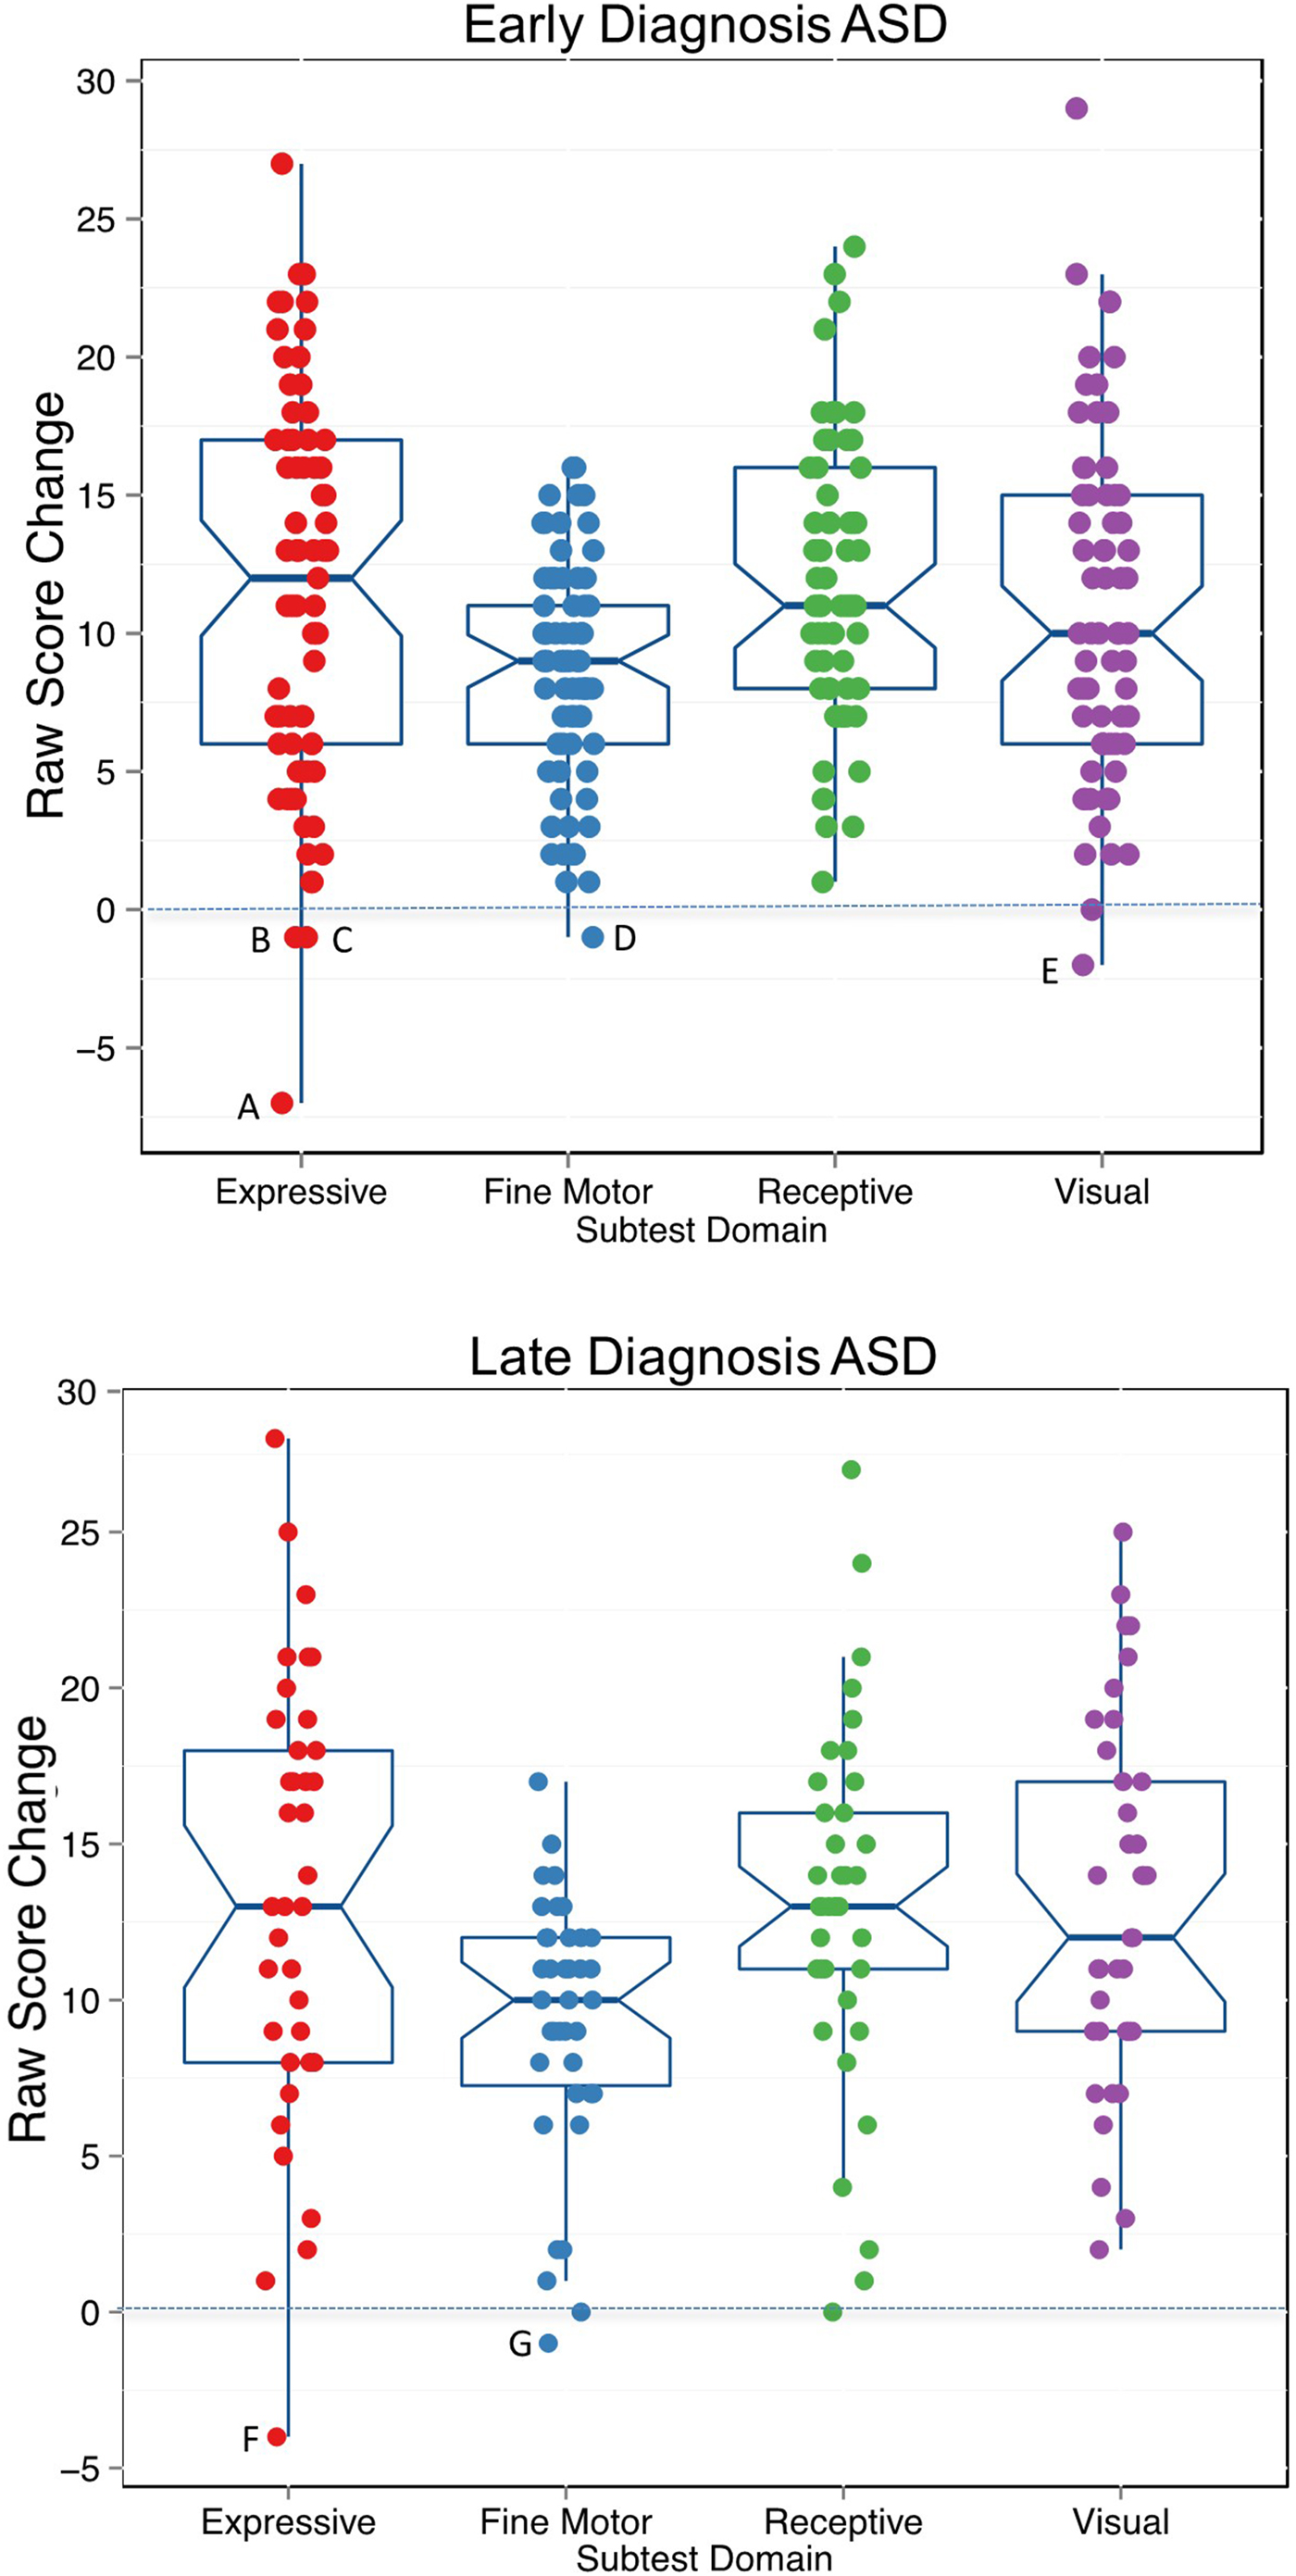
Figure 5. (Color online) Change in raw scores on the Mullen Scales of Early Learning for the early-onset diagnosis autism spectrum disorder (EarlyDx-ASD) and late-onset (LateDx-ASD) groups. Change was calculated by subtracting raw scores at initial evaluation age from raw scores at exit. Overall, 97% of children from each group demonstrated an increase in skill level between test visits as indicted by a positive change in scores over time. Only seven toddlers (indicated by letters) demonstrated loss in skill level as indicated by a negative change in raw scores. Average time between evaluations: EarlyDx-ASD: 16.2 months, SD = 5.6, confidence interval [14.8, 17.7]; LateDx-ASD: 18.7 months, SD = 5.2, confidence interval [16.9, 20.5].
Simplex and multiplex cases
In the EarlyDx-ASD group 11.6% (n = 8) of cases were identified as multiplex cases, 46.4% (n = 32) were identified as simplex cases, and 42.0% (n = 29) were identified as stoppage cases. In the LateDx-ASD group, 26.5% (n = 10) were identified as multiplex cases, 31.6% (n = 12) were simplex cases, and 42.1% (n = 16) were stoppage cases. A chi-square test revealed there were no significant differences of proportions of multiplex, simplex, or stoppage cases across diagnostic groups (χ2 = 4.462, df = 2, p = .107).
Treatment information
Treatment information was available for 95% of participants. As the EarlyDx-ASD and LateDx-ASD groups were identified as at risk for ASD at different ages (EarlyDx-ASD 19.61 months on average, LateDx-ASD 28.13 months on average), the age at which these children were referred for autism specific services differed as well. On average, the LateDx-ASD group started receiving services at a later age than the EarlyDx-ASD group (see Table 3).
Table 3. Average number of hours of treatment received per week and average number of months between first evaluations and service initiation by diagnostic group

Note: Values are means (standard deviations). Dx, diagnosis; ASD, autism spectrum disorder.
aABA based treatments include therapies such as pivotal response treatment or discrete trial training.
bDevelopmental services include speech therapy, occupational therapy, and physical therapy.
Discussion
In this first prospective longitudinal study of patterns of onset of ASD symptoms in the general pediatric population, we used nonstandard specialized tests and found abnormalities in multiple behavioral measures of social, exploratory, and stereotyped behaviors at initial evaluations in both EarlyDX-ASD and LateDx-ASD (Figure 3 and Table 2). Thus, at the same early age of 12–24 months, early and later age ASD diagnosed toddlers displayed similar social communication deficits and stereotyped behaviors, including reduced levels and quality of engagement with caregiver during free play; reduced social gestures, social vocalizations, and social referencing during free play; increased stereotyped behavior during free play; reduced exploration of their environment; and increased preference for geometric patterns over social images (Figure 3 and Table 2; Pierce, Conant, et al., Reference Pierce, Carter, Weinfeld, Desmond, Hazin, Bjork and Gallagher2011; Pierce et al., Reference Pierce, Marinero, Hazin, McKenna, Barnes and Malige2016). Moreover, in longitudinal analyses, we found no loss of previously displayed early cognitive skills in either LateDX-ASD or EarlyDx-ASD subjects. These findings suggest ASD is already present, albeit to varying degrees of clinical detectability, at 12 to 24 months of age regardless of whether or not a toddler meets diagnostic criteria at earlier or later ages. In addition, our results suggest that standardized measures do not consistently pick up these social and stereotyped behavior differences that can be identified with fine-grained behavioral coding, and so they appear to be prone to false negatives at very young ages. Overall, the PCI, Exploration task, and Geo-Pref Test are all sensitive methods for capturing behavioral differences in toddlers with ASD at early ages.
Previous studies also finding heterogeneity in age of first diagnosis (Fountain, Winter, & Bearman, Reference Fountain, Winter and Bearman2012; Gotham, Pickles, & Lord, Reference Gotham, Pickles and Lord2012; Landa et al., Reference Landa, Gross, Stuart and Bauman2012; Shumway et al., Reference Shumway, Thurm, Swedo, Deprey, Barnett, Amaral and Ozonoff2011) have variously speculated that this may be due to use of state-of-the-field diagnostic instruments, difficulty of differential diagnosis, and/or regression and changes in symptom presentation over time (Davidovitch et al., Reference Davidovitch, Levit-Binnun, Golan and Manning-Courtney2015; Jónsdóttir et al., Reference Jónsdóttir, Saemundsen, Antonsdóttir, Sigurdardóttir and Ólason2011; Wiggins et al., Reference Wiggins, Baio and Rice2006). First, through the present prospective study, it is clear that use of the ADOS gold-standard diagnostic instrument did not prevent missed early diagnoses despite its use by clinicians with specialized experience in the assessment of ASD and its administration to all participants at equally young ages. The large majority of children in the LateDx-ASD group scored within the little-to-no concern range on the ADOS-T at their initial evaluation (see Figure 2). A second possible explanation for late-age ASD diagnosis is regression or loss of skills in that subgroup. However, analyses of raw scores on receptive, expressive, visuospatial, and fine motor subdomains across age showed that 100 of the 107 ASD subjects had gain in skills while only 7 showed loss of skills and such loses were negligible (see Figure 5). Conversely, the children in the LateDx-ASD group did show an increase in ADOS scores over time, suggesting plateau or possible regression of skills specific to social domains, rather than cognitive domains. A third possibility has to do with the difficulty of differential diagnoses among various developmental disorders at early ages when symptoms may be more subtle and difficult to attribute to one disorder over another. This seems reflected by the diverse initial diagnoses (TD, LD, DD, Motor Delay, Other) given at early ages to individuals in the LateDx-ASD subgroup. This is especially a challenge because symptoms of ASD, such as language delays, social impairments, and behavioral problems, overlap with some symptoms seen in a variety of other types of developmental delay. A fourth possibility is that symptom presentation changes over time, and not all children show all the symptoms of ASD at a certain age (e.g., by 12 to 24 months). However, trajectories of language scores, Vineland social scores, and visual reception scores tended to be remarkably similar across EarlyDx-ASD and LateDx-ASD toddlers.
Instead, the present study suggests that differences in age of diagnosis may be due to severity of early language impairment, applicability of diagnostic criteria at young ages, and/or sensitivity of standard diagnostic tests. Small but significant differences in language ability at early ages that distinguished those with early- versus later-age ASD diagnoses may have impacted ADOS performance and scoring at very young ages (see Table 2). These two subgroups started off with somewhat different levels of receptive language development, but they converged to similar low levels of performance by 3 to 4 years of age. While both early- and later-age ASD subgroups had significantly lower than normal average language development, the later diagnosed group started out with slightly less impaired expressive and receptive language. Although elevated relative to TD toddlers, approximately half of the LateDx-ASD toddlers had ADOS scores that fell within the little-to-no concern range at early ages. In contrast, those with generally worse early language at early ages on average also had higher ADOS scores at early ages. Despite these early language differences between the subgroups, the later-age ASD diagnosed toddlers displayed reduced progression in receptive language, and as their receptive language fell further behind, their ADOS scores increased dramatically to the severity levels of early-age diagnosed toddlers. Note that these “declines” in receptive language scaled scores were not due to skill loss, per se, but instead were due to failure to gain at a normative developmental rate. Although rapid increases in ADOS scores were seen over time in the LateDx-ASD toddlers, suggesting a decline in social skills over time, their social interactions with mother in a naturalistic setting were already impaired at 16 months to a degree comparable to that of EarlyDx-ASD toddlers at 19 months (Figure 3 and Table 2). Thus, in the LateDx-ASD and EarlyDx-ASD toddlers, variability in early language impairment and trajectories may also be impacting the sensitivity of standardized diagnostic tools and clinical judgments at very early ages as well, resulting in missed ASD detections by those tools.
Analyses of the nonstandard specialized tests also revealed behavioral abnormalities that distinguished both early-age and later-age diagnosed ASD subgroups from LD toddlers. For the early-age ASD subgroup, these included a reduction of the number of items explored, increased stereotypic play during the exploration task, and lower rates of social gestures (Figure 3, Table 2). These findings generally replicate previous literature showing reductions in the aforementioned social behaviors in children with ASD as compared to TD children, and in this case LD children as well (Ozonoff et al., Reference Ozonoff, Iosif, Baguio, Cook, Hill, Hutman and Young2010; Pierce & Courchesne, Reference Pierce and Courchesne2001; Pierce et al., Reference Pierce, Marinero, Hazin, McKenna, Barnes and Malige2016; Wan et al., Reference Wan, Green, Elsabbagh, Johnson, Charman and Plummer2012; Zwaigenbaum et al., Reference Zwaigenbaum, Bryson, Rogers, Roberts, Brian and Szatmari2005). For the late-age ASD subgroup, differences from LD subjects similarly included a reduction of the number of items explored, increased stereotypic play during the exploration task, and lower rates of social gestures. Like toddlers with ASD, language-delayed toddlers also had reduced social vocalizations and referencing compared to TD toddlers, which highlights the importance of better understanding variation in the neural functional role of language in the development of social vocalization and communication.
The lack of difference in trajectory endpoint between the EarlyDx-ASD and LateDx-ASD groups is particularly concerning given that the LateDx-ASD group received a provisional ASD diagnosis an average of 8.7 months later than the EarlyDx-ASD group and therefore inevitably began receiving autism-focused treatment later as well. It is possible that this difference in treatment received negatively impacted the developmental trajectories of each ASD group. This highlights the need for more sensitive and accurate early screening methods that can detect even the LateDx-ASD individuals at early ages and the importance of beginning language as well as social interventions as soon as possible since beginning treatment at younger ages has been associated with better outcomes (Itzchak & Zachor, Reference Itzchak and Zachor2011).
Our sample represented a range of simplex, multiplex, and singleton children across both early- and late-diagnosed subgroups. Because there were no differences in the proportion of simplex and multiplex families in the early- and late-diagnosed ASD subgroups, late-diagnosed ASD apparently is not more common in families with older children with ASD compared to those without.
In our data, ASD behavior was present early in fine-grained behavioral coding regardless of whether the child was detected early or later by diagnostic tools. This early developmental presence of ASD is expected because abundant new postmortem, cellular, molecular, genetic, and animal model evidence shows that autism is a prenatal neural disorder (Avino & Hutsler, Reference Avino and Hutsler2010; Courchesne et al., Reference Courchesne, Mouton, Calhoun, Semendeferi, Ahrens-Barbeau, Hallet and Pierce2011; Parikshak et al., Reference Parikshak, Luo, Zhang, Won, Lowe, Chandran and Geschwind2013; Stoner et al., Reference Stoner, Chow, Boyle, Sunkin, Mouton, Roy and Courchesne2014; Willsey et al., Reference Willsey, Sanders, Li, Dong, Tebbenkamp, Muhle and State2013). At these prenatal beginning stages, heterogeneity is already present with variation in underlying genetics (Parikshak et al., Reference Parikshak, Luo, Zhang, Won, Lowe, Chandran and Geschwind2013), magnitude of cortical neuron excess (Courchesne et al., Reference Courchesne, Mouton, Calhoun, Semendeferi, Ahrens-Barbeau, Hallet and Pierce2011), and which cell types and layers are most affected (Stoner et al., Reference Stoner, Chow, Boyle, Sunkin, Mouton, Roy and Courchesne2014). Thus, variation in underlying neural structure and function may exist before, and underlie and explain, the variation in clinically detectable first behavioral symptoms. Therefore, if autism is not detected, then it may be because it was not clinically observed by experts instead of not yet present. The basic research and clinical concern is that 1 out of 3 toddlers with ASD missed at early ages is a substantial percentage, especially considering that this occurred despite use of state-of-the-field diagnostic tools and highly experienced clinicians and despite the early presence of social and stereotyped behavior abnormalities on nonstandard specialized tests.
Limitations
Our recruitment strategy relied primarily on pediatrician referrals of toddlers who failed the CSBS screen at 12 to 24 months of age. Some study toddlers were also parent referred. In addition, pediatricians were asked to periodically refer toddlers without concerns so as to recruit a TD contrast group. However, recruitment did not aim to recruit into the study all toddlers who passed the CSBS screen in pediatrician's offices, and so it remains possible that some of those toddlers demonstrated expected development at the time of screening, only to show delays later on, but were not included in the current study. In addition, because of the focus on community clinical practice and referral, toddlers were referred and initially assessed at varying ages between 12 and 24 months. The EarlyDx-ASD group was 3 months older on average than the other groups. It is unclear why this is, but could be due to natural variation in when clinicians refer within the natural course of their practice, or preference of parents to wait before acting on developmental concerns about ASD at a very early age. Nonetheless, despite the LateDx-ASD group being very slightly younger, they still had elevated social communication and ASD-related impairments similar to the EarlyDx-ASD group. Thus, these results further support the conclusion that ASD was already present in the LateDx-ASD group but was missed by standardized assessments. In the future, it would be valuable to replicate the results within a larger sample of LateDx-ASD children to determine the generalizability to this diverse group of toddlers. In addition, in order to provide clinically sensitive care to the families in the study, psychologists were not blind to previous diagnoses of the child. This may have influenced the diagnoses provided by the psychologist, but we found this to be most representative of real-world practice, and this would have biased results in a direction opposite to what we found: we found that, despite having previously given a non-ASD diagnosis at the earlier age to those in the LateDx-ASD group (and often a TD or simple LD diagnosis), psychologists changed their final diagnosis to the more serious diagnostic outcome: ASD. Future research would also benefit from analysis of change in ADOS severity scores over time. ADOS raw scores were analyzed as an exploratory look into symptom change. Unfortunately, the ADOS severity scores are limited in range, making it more difficult to assess patterns of change, especially given that approximately 20% of individuals with autism are given the highest severity scores possible, creating a ceiling effect in the sample of interest (Gotham, Pickles, & Lord, Reference Gotham, Pickles and Lord2009).
Conclusions
Important core symptoms of ASD were present in both early- and late-age diagnosed toddlers with ASD, and lack of evidence of regressive loss of previous cognitive and language skills in either early- or late-age diagnosed toddlers. Current clinical judgment procedures incorporating use of gold-standard diagnostic tools failed to identify at very early ages one-third of the toddlers who eventually received an ASD diagnosis. Presence of slightly less impaired language may be a factor in such missed early detections; for these missed cases, language development failed to sufficiently progress in the interim between the missed diagnosis and later correct detection. We think that earlier detection and appropriate early language intervention might potentially forestall such arrest and instead promote better language progression and clinical outcome. Therefore, this evidence, along with the biological evidence of prenatal beginnings, points to the need for far more sensitive and accurate detection and diagnostic tools than those presently in standard clinical use. Novel behavioral and biological tools will need to be efficient, practical, and economical for ordinary pediatric clinical settings. The specialized behavioral tests used here are easily administered, but the PCI and exploration tests are time consuming to validly score, and therefore more automated and efficient scoring methods would need to be developed in order for such types of tests to have routine clinical utility. Moreover, given the difficultly measuring behavioral symptoms reliably, especially at ages 12 to 24 months, the need for biological markers is apparent in order to create objective tests that could be used to identify ASD prior to any observable behavioral symptoms. Some novel tools under study have very high specificity but for certain ASD subtypes (Pierce, Conant, et al., Reference Pierce, Carter, Weinfeld, Desmond, Hazin, Bjork and Gallagher2011; Pierce et al., Reference Pierce, Marinero, Hazin, McKenna, Barnes and Malige2016), while others, including biological ones, have a good balance between very good sensitivity and specificity (Pramparo et al., Reference Pramparo, Pierce, Lombardo, Carter Barnes, Marinero, Ahrens-Barbeau and Courchesne2015). A reasonable strategy is to utilize multiple behavioral and biological detection and diagnostic tools to increase sensitivity while maintaining high specificity.
Ultimately, regardless of method, the need is to accurately identify all ASD risk cases at early ages so that treatment can begin far sooner. In the present study, toddlers were seen every 9 to 12 months as per the research protocol, and therefore toddlers in the LateDx-ASD group began receiving autism-focused treatments about a year after their initial evaluation. However, this research-driven, high level of monitoring developmental progress in toddlers is typically not the norm in general community practices where children often go for quite some time without receiving a diagnosis of ASD and getting the services they need. Considering the beneficial impact of early intervention (Boyd, Odom, Humphreys, & Sam, Reference Boyd, Odom, Humphreys and Sam2010; Corsello, Reference Corsello2005; Dawson, Reference Dawson2008; Eldevik et al., Reference Eldevik, Hastings, Hughes, Jahr, Eikeseth and Cross2009), earlier identification of all ASD children is imperative.


