Multiple forms of early life adversity predict the risk for later psychopathology (Bjorkenstam, Burstrom, Vinnerljung, & Koshidou, Reference Bjorkenstam, Burstrom, Vinnerljung and Kosidou2016; Cicchetti & Banny, Reference Cicchetti, Banny, Lewis and Rudolph2014; Green et al., Reference Green, McLaughlin, Berglund, Gruber, Sampson, Zaslavsky and Kessler2010; Gunnar & Quevedo, Reference Gunnar and Quevedo2007; Kendler, Kuhn, & Prescott, Reference Kendler, Kuhn and Prescott2004; Kessler, Davis, & Kendler, Reference Kessler, Davis and Kendler1997; O'Donnell & Meaney, Reference O'Donnell and Meaney2017; Shonkoff, Boyce, & McEwen, Reference Shonkoff, Boyce and McEwen2009). The Centers for Disease Control–Kaiser studies show that the number of adverse childhood experiences (ACEs) predicts a wide range of health outcomes such as drug use and abuse (Anda et al., Reference Anda, Croft, Felitti, Nordenberg, Giles, Williamson and Giovino1999; Dube, Anda, Felitti, Ewards, & Croft, Reference Dube, Anda, Felitti, Edwards and Croft2002; Dube et al., Reference Dube, Felitti, Dong, Chapman, Giles and Anda2003), depression (Chapman et al., Reference Chapman, Whitfield, Felitti, Dube, Edwards and Anda2004) and other mental health diseases (Edwards, Holden, Felitti, & Anda, Reference Edwards, Holden, Felitti and Anda2003), ischemic heart disease (Dong, Giles, et al., Reference Dong, Giles, Felitti, Dube, Williams, Chapman and Anda2004), risk for violence (Ports, Ford, & Merrick, Reference Ports, Ford and Merrick2016), and suicide attempts (Dube et al., Reference Dube, Anda, Felitti, Chapman, Williamson and Giles2001). The various forms of adversity in the ACE studies are considered in an additive manner, with the cumulative adversity index used to predict later health outcomes. This approach has the advantage of realistically reflecting the natural environmental conditions in which exposure to various forms of adversity at different periods in development are highly intercorrelated (Dong, Anda, et al., Reference Dong, Anda, Felitti, Dube, Williamson, Thompson and Giles2004). While this approach complicates efforts to understand how specific forms of adversity operate at various ages to contribute to health outcomes, it reflects a more realistic approach to defining the true association between adverse environments and health outcomes, thus maximizing the opportunities for prediction to best identify vulnerable individuals.
The ACE studies and many others focus on extreme forms of adversity such as abuse (physical, emotional, and sexual), household challenges (violence, substance abuse, mental illness, and divorce) and neglect (physical and emotional; Felitti et al., Reference Felitti, Anda, Nordenberg, Williamson, Spitz, Edwards and Marks1998). While such forms of adversity are more common than initially thought, in an average community sample, the intensity of adversity exposure across the population may be milder, with little variation on discrete components of these scores, and where the risk to develop a poor outcome will likely depend on a multitude of subtle disadvantages (Christakis, Reference Christakis2016; Copeland, Shanahan, Costello, & Angold, Reference Copeland, Shanahan, Costello and Angold2009). Such factors include birth outcomes, socioeconomic position, parental mental health, and so on, each of which cut across the entire population and predict the later risk for metabolic and mental health outcomes. Although to our knowledge the necessary comparative studies have not been performed, we may consider such measures as “milder” forms of adversity (or “ace's”; Christakis, Reference Christakis2016) since, taken alone, they may be somewhat less predictive of eventual health outcomes. However, such factors do extend across the population and thus create the opportunity to define the relative risk for each child across the entire population. Moreover, the compelling evidence for individual differences in sensitivity to environmental conditions (Belsky & Pluess, Reference Belsky and Pluess2009a; Pluess, Reference Pluess2015) across the population suggests that there may be a more significant impact of such “ace's” among more sensitive individuals. For example, children born small for gestational age are at increased risk for psychopathology (Breslau & Chilcoat, Reference Breslau and Chilcoat2000; Costello, Worthman, Erkanli, & Angold, Reference Costello, Worthman, Erkanli and Angold2007; Pesonen, Raikkonen, Strandberg, & Jarvenpaa, Reference Pesonen, Raikkonen, Strandberg and Jarvenpaa2006; Phillips et al., Reference Phillips, Barker, Fall, Seckl, Whorwood, Wood and Walker1998) and the association between birth weight and cognitive–emotional function in childhood is moderated by the genotype of the individual (Broekman et al., Reference Broekman, Chan, Goh, Fung, Gluckman, Saw and Meaney2011; Wazana et al., Reference Wazana, Moss, Jolicoeur-Martineau, Graffi, Tsabari, Lecompte and Meaney2015).
Another limitation of studies like the ACE program is that they have focused thus far on forms of adversity, such as abuse and neglect, that are unique to the postnatal environment. There is now strong evidence for the importance of prenatal factors in determining the risk for later psychopathology (Glover, Reference Glover2014; O'Donnell & Meaney, Reference O'Donnell and Meaney2017; Pearson et al., Reference Pearson, Evans, Kounali, Lewis, Heron, Ramchandani and Stein2013; Pluess & Belsky, Reference Pluess and Belsky2011) even when controlling for postnatal environmental influences. A “prenatal cross-fostering” study in humans, where pregnant mothers were related or unrelated to their child as a result of in vitro fertilization, served to distinguish maternally inherited effects from those directly associated with the maternal phenotype, and showed that maternal stress and emotional well-being were directly associated with socioemotional function in the child (Rice et al., Reference Rice, Harold, Boivin, van den Bree, Hay and Thapar2010). Despite the compelling evidence for the influence of prenatal adversity on mental health outcomes, no comprehensive approach to date has explored the long-term consequences of cumulative, prenatal adversity in children. Studies exploring the relationship between prenatal adversity and risk for childhood psychopathology focus either exclusively on the prenatal social environment (Slopen et al., Reference Slopen, Loucks, Appleton, Kawachi, Kubzansky, Non and Gilman2015), maternal mental health (O'Donnell, Gaudreau, et al., Reference O'Donnell, Gaudreau, Colalillo, Steiner, Atkinson and Moss2014; Pearson et al., Reference Pearson, Evans, Kounali, Lewis, Heron, Ramchandani and Stein2013), or biological risk (Lahti et al., Reference Lahti, Eriksson, Heinonen, Kajantie, Lahti, Wahlbeck and Raikkonen2014; Laursen, Munk-Olsen, Nordentoft, & Bo Mortensen, Reference Laursen, Munk-Olsen, Nordentoft and Bo Mortensen2007; Raikkonen et al., Reference Raikkonen, Pesonen, Heinonen, Kajantie, Hovi, Jarvenpaa and Andersson2008), but these conditions are highly intercorrelated in the lives of children and have yet to be considered in a cumulative manner. For example, socioeconomic status is associated with both antenatal maternal mood and birth outcomes (Kramer et al., Reference Kramer, Wilkins, Goulet, Seguin, Lydon and Kahn2009; Lorant et al., Reference Lorant, Deliege, Eaton, Robert, Philippot and Ansseau2003). In the current study, we used data from two longitudinal birth cohort studies to create a cumulative prenatal adversity score based on the number of adverse prenatal conditions. An adverse condition was defined as one significantly associated with an increased risk for psychopathology.
Models of differential susceptibility (Belsky & Pluess, Reference Belsky and Pluess2009b; Boyce & Ellis, Reference Boyce and Ellis2005) suggest that children more biologically sensitive to context might be disproportionately affected by such developmental factors explaining, in part, interindividual differences in the degree to which individuals respond to adversity (Luthar, Cicchetti, & Becker, Reference Luthar, Cicchetti and Becker2000). There is considerable evidence that such differential susceptibility is associated with genetic variation (Bakermans-Kranenburg & van IJzendoorn, Reference Bakermans-Kranenburg and van IJzendoorn2011, Reference Bakermans-Kranenburg and van IJzendoorn2015; Belsky et al., Reference Belsky, Jonassaint, Pluess, Stanton, Brummett and Williams2009; Brody et al., Reference Brody, Chen, Beach, Kogan, Yu, Diclemente and Philibert2014; Meaney, Reference Meaney2010; Pluess & Belsky, Reference Pluess and Belsky2013). A final aim of the current study was to define the degree to which the association between the neurodevelopmental outcomes and the prenatal adversity index was moderated by the genotype of the child. As a proof of concept, we studied the interaction between the adversity index score and a novel genetic score comprising genes coexpressed with the serotonin transporter in the brain. A functional polymorphism in the promoter region of the serotonin transporter solute carrier family C6, member 4 (SLC6A4) gene has been shown to moderate the influence not only of stressful life events but also of positive support, on the development of/resilience to psychopathology at different ages (Bukh et al., Reference Bukh, Bock, Vinberg, Werge, Gether and Vedel Kessing2009; Caspi et al., Reference Caspi, Sugden, Moffitt, Taylor, Craig, Harrington and Poulton2003; Eley et al., Reference Eley, Sugden, Corsico, Gregory, Sham, McGuffin and Craig2004; Ford, Mauss, Troy, Smolen, & Hankin, Reference Ford, Mauss, Troy, Smolen and Hankin2014; Kendler, Kuhn, Vittum, Prescott, & Riley, Reference Kendler, Kuhn, Vittum, Prescott and Riley2005; Li, Berk, & Lee, Reference Li, Berk and Lee2013; Ming et al., Reference Ming, Zhang, Chai, Chen, Hou, Wang and Yao2013; Rocha et al., Reference Rocha, Hutz, Salatino-Oliveira, Genro, Polanczyk, Sato and Kieling2015; Taylor et al., Reference Taylor, Way, Welch, Hilmert, Lehman and Eisenberger2006; Uher et al., Reference Uher, Caspi, Houts, Sugden, Williams, Poulton and Moffitt2011; Wilhelm et al., Reference Wilhelm, Mitchell, Niven, Finch, Wedgwood, Scimone and Schofield2006). Our approach was based on the assumption that genes operate in coherent networks that are reflected in patterns of coexpression. We used existing genomic databases and a novel bioinformatic approach to create a coexpression polygenic risk score (ePRS) that is based on functional genetic variants (expression quantitative trait loci) in genes that are coexpressed with the SLC6A4 gene in brain regions implicated in mood disorders, including depression and anxiety (Caspi et al., Reference Caspi, Sugden, Moffitt, Taylor, Craig, Harrington and Poulton2003; Uher et al., Reference Uher, Caspi, Houts, Sugden, Williams, Poulton and Moffitt2011; Uher & McGuffin, Reference Uher and McGuffin2010), as well as childhood emotional function (Bouvette-Turcot et al., Reference Bouvette-Turcot, Fleming, Wazana, Sokolowski, Gaudreau and Gonzalez2015; Pluess et al., Reference Pluess, Velders, Belsky, van IJzendoorn, Bakermans-Kranenburg and Tiemeier2011). We propose that this approach could provide stronger evidence for genetic moderation than focusing only on a single candidate polymorphism.
Method
We used data from two established prospective birth cohorts, Maternal Adversity, Vulnerability and Neurodevelopment (MAVAN; O'Donnell, Gaudreau, et al., Reference O'Donnell, Gaudreau, Colalillo, Steiner, Atkinson and Moss2014) and Growing Up in Singapore Towards Healthy Outcomes (GUSTO; Soh et al., Reference Soh, Tint, Gluckman, Godfrey, Rifkin-Graboi and Chan2014).
MAVAN
The MAVAN study sample included children from two recruitment/testing sites, one in Montreal (Québec) and the other in Hamilton (Ontario), Canada, followed from birth up to 6 years of age and evaluated using a wide range of measures of neurodevelopment. Eligibility criteria for mothers included age ≥18 years, singleton gestation, and fluency in French or English. Severe maternal chronic illness, placenta previa, and history of incompetent cervix, impending delivery, or a fetus/infant affected by a major anomaly or born at a gestational age of <37 weeks were exclusion criteria. Birth records were obtained directly from the birthing units. Approval for the MAVAN project was obtained from obstetricians performing deliveries at the study hospitals and by the ethics committees and university affiliates (McGill University, Université de Montréal, Royal Victoria Hospital, Jewish General Hospital, Centre hospitalier de l'Université de Montréal, and Hôpital Maisonneuve-Rosemount) and St. Joseph's Hospital and McMaster University, Hamilton. Informed consent was obtained from all participants.
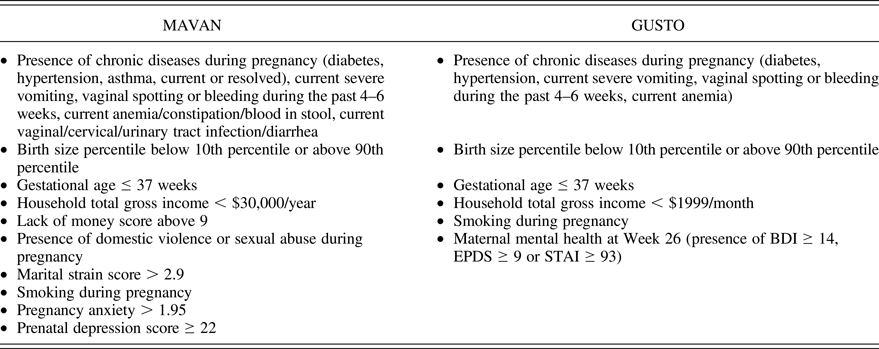
The MAVAN sample included 443 children with data that allowed the calculation of prenatal adversity scores (Table 1). For every item with a continuous score, we used either the 15th or the 85th percentile as the cutoff to add a point to the adversity scale. Presence of each component (described in each bullet of the table) yielded 1 point, and the scores represent the summation of points. The instruments used to extract the information and create the scores are described below.
Table 1. Variables and cutoffs used to create the cumulative prenatal adversity scores
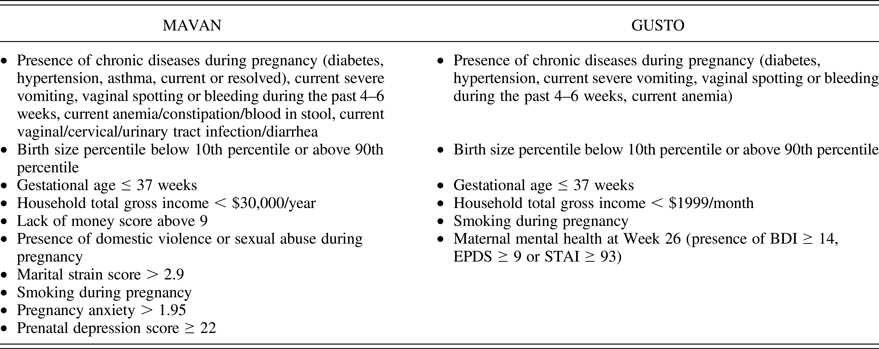
Note: The presence of each component (described in each bullet) yielded 1 point, and the scores represent the summation of points.
The health and well-being questionnaire is a composite of validated short versions of multiple measures (Kramer, Goulet, et al., Reference Kramer, Goulet, Lydon, Seguin, McNamara, Dassa and Koren2001):
-
1. the presence of chronic disease during pregnancy (current or resolved diabetes, hypertension, or asthma) or severe acute conditions (such as current severe vomiting, vaginal spotting or bleeding during the past 4–6 weeks, current anemia/constipation/blood in the stool, or current vaginal/cervical/urinary tract infection) is examined;
-
2. a subscale from the daily hassles is used to measure how often, and to what degree, the woman has lacked money for basic needs such as food, heating, and electricity since the beginning of pregnancy (Kanner, Coyne, Schaefer, & Lazarus, Reference Kanner, Coyne, Schaefer and Lazarus1981);
-
3. the Marital Strain Scale of Pearlin and Schooler is used to assess chronic stress with the romantic partner (Pearlin & Schooler, Reference Pearlin and Schooler1978);
-
4. the Abuse Assessment Screen is used to assess conjugal violence, using five items to assess the frequency, severity, perpetrator, and body sites of injury (Newberger et al., Reference Newberger, Barkan, Lieberman, McCormick, Yllo, Gary and Schechter1992; Parker, McFarlane, Soeken, Torres, & Campbell, Reference Parker, McFarlane, Soeken, Torres and Campbell1993); and
-
5. questions about anxiety during pregnancy are also assessed (Lobel & Dunkel-Schetter, Reference Lobel and Dunkel-Schetter1990; Lobel, Dunkel-Schetter, & Scrimshaw, Reference Lobel, Dunkel-Schetter and Scrimshaw1992).
Smoking during pregnancy was simply scored as a binary outcome. Household gross income was assessed according to the Institut de la statistique du Québec (Reference Québec1998). Maternal depressive symptoms were evaluated using the Centre of Epidemiological Studies Depression Scale administered during pregnancy. This scale assesses symptoms of depression on 20 items applying a Likert scale ranging from 0 to 3, with a higher score indicating more severe depressive symptoms (Radloff, Reference Radloff1977).
Birth weight and gestational age were assessed using birth records obtained directly from the birthing units. Birth weight percentiles were calculated using the Canadian reference (Kramer, Platt, et al., Reference Kramer, Platt, Wen, Joseph, Allen and Abrahamowicz2001).
Neurodevelopmental outcomes were assessed using the Bayley Scales of Infant and Toddler Development II (Bayley, Reference Bayley1993) applied at 36 months. The Bayley evaluation was performed by experienced professionals. Three major areas of development were used in this study: Total Behavioral Rating Scale, Motor Developmental Index (which includes fine and gross motor subtests) and Mental Developmental Index. The CBCL is a widely used method of identifying problematic behaviors in children. The CBCL is a parent-report form to screen for emotional, behavioral, and social problems. The scoring for the CBCL is based on groupings of sets of behaviors into a few syndrome scale raw scores; there are two broader scales that combine several of the syndrome scales: internalizing problems (e.g., anxious/depressed, withdrawn/depressed, and somatic complaints scores) and externalizing problems (e.g., aggressive behavior). There also is a “total problems score” and a set of “DSM-oriented” scales (Achenbach & Rescorla, Reference Achenbach and Rescorla2000). Maternal reports were available at the ages of 48 and 60 months. The School Readiness Battery assesses school readiness, which may be defined as the minimum developmental level allowing the child to respond adequately to school demands (Lemelin et al., Reference Lemelin, Boivin, Forget-Dubois, Dionne, Seguin, Brendgen and Perusse2007). The MAVAN School Readiness Battery includes a series of well-validated diagnostic screening tests of school readiness such as the Lollipop Test (Chew & Morris, Reference Chew and Morris1984), Number Knowledge (Okamoto & Case, Reference Okamoto and Case1996), and the Peabody Picture Vocabulary Test (Dunn & Dunn, Reference Dunn and Dunn2006). The battery was administered at 48 and 60 months.
GUSTO
Pregnant women aged 18 years and above were recruited at the National University Hospital and KK Women's and Children's Hospital, being of Chinese, Malay, or Indian ethnicity with homogeneous parental ethnic background. Mothers receiving chemotherapy, psychotropic drugs, or who had type I diabetes mellitus were excluded. Informed written consent was obtained from each participant. There were 917 children with data that allowed the calculation of a prenatal adversity score. The description of the score is provided in Table 1. The tools applied were similar to MAVAN (see description above), except for maternal mental health. In GUSTO, this information was a composite measure of different questionnaires applied at gestational Week 26 as explained in Table 1: the Beck Depression Inventory, a 21-question multiple-choice self-report inventory, one of the most widely used psychometric tests for measuring the severity of depression (Beck, War, Mendelson, Mock, & Erbaugh, Reference Beck, Ward, Mendelson, Mock and Erbaugh1961); the Edinburgh Postnatal Depression Scale, a 10-item self-report scale designed to screen for pre- and postpartum depression (Cox, Holden, & Sagovsky, Reference Cox, Holden and Sagovsky1987); and the State-Trait Anxiety Inventory, a self-report scaling consisting of two forms of 20 items each to measure psychic components of state and trait anxiety (Spielberger, Gorsuch, Lushene, Vagg, & Jacobs, Reference Spielberger, Gorsuch, Lushene, Vagg and Jacobs1983).
The neurodevelopmental outcomes included the following:
-
1. the Bayley Scale of Infant and Toddler Development, Third Edition, which includes five subscale scores for cognition, expressive and receptive language and both fine and gross motor function, applied at 24 months (Bayley, Reference Bayley2006);
-
2. the CBCL (Achenbach & Rescorla, Reference Achenbach and Rescorla2000) administered at 24 and 48 months of age; and
-
3. a School Readiness Test Battery composed of the Lollipop Test (Chew & Morris, Reference Chew and Morris1984), Number Knowledge (Okamoto & Case, Reference Okamoto and Case1996), and the Peabody Picture Vocabulary Test (Dunn & Dunn, Reference Dunn and Dunn2006) applied at 48 months.
Genotyping (only in MAVAN)
We described allele frequencies at 242,211 autosomal single nucleotide polymorphisms (SNPs) using genome-wide platforms (PsychArray/PsychChip, Illumina) according to manufacturers' guidelines with 200 ng of genomic DNA derived from buccal epithelial cells. We removed SNPs with a low call rate (<95%) and minor allele frequency (<5%) and performed imputation using the Sanger Imputation Service (McCarthy et al., Reference McCarthy, Das, Kretzschmar, Delaneau, Wood, Teumer and Haplotype Reference2016) resulting in 20,790,893 SNPs with an info score >0.80 and posterior genotype probabilities >0.90.
ePRS
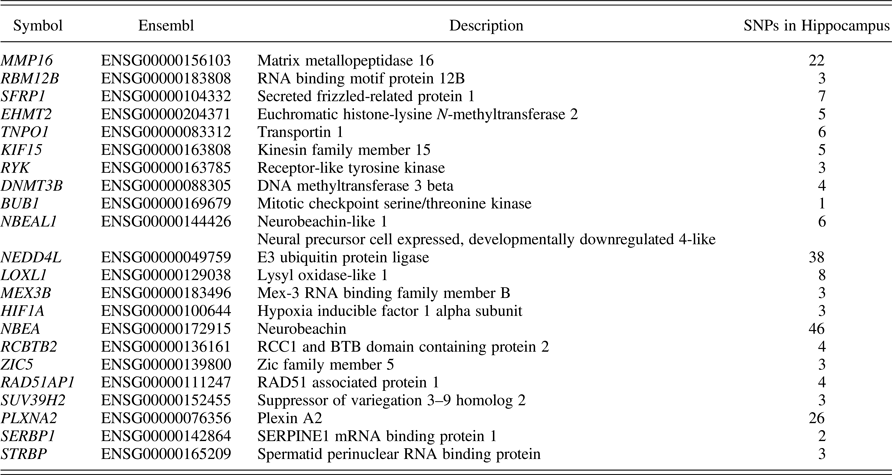
The genetic score was created using (a) Genenetwork (http://genenetwork.org), (b) Brainspan (http://www.brainspan.org/rnaseq/search/index.html), and (c) GTEx (https://www.gtexportal.org/home/). These resources allowed us to identify transcriptional coexpression profiles in specific regions of the mouse (GeneNetwork) and human (Brainspan) brain and to identify SNPs functionally associated with gene expression in human brain (GTEx). The ePRS was constructed as follows: we used GeneNetwork to generate coexpression matrix with SLC6A4 in the (a) amygdala, (b) hippocampus, and (c) prefrontal cortex in mice (absolute value of the coexpression correlation r ≥ .5); we then used Brainspan to identify transcripts from this list with a prenatal enrichment within the human brain, consensus transcripts (i.e., transcripts coexpressed with SLC6A4 in two out of three coexpression matrices). We selected transcripts differentially expressed in these brain regions at r ≥ 1.5 fold during prenatal development as compared to adult samples (Miller et al., Reference Miller, Ding, Sunkin, Smith, Ng, Szafer and Lein2014). The final list included 29 genes, but 4 were excluded for their location on chromosome X. One gene (NEUROG1) showed little evidence of common variation, for example, SNPs with a MAF >5% as such 3 SNPs were excluded in subsequent quality control procedures from GTEx (see below), and 2 others (SOX12 and SF3B4) had no data overlap between our sample and GTEx, resulting in 22 genes (Table 2).
Table 2. Genes selected for composing the genetic score

Note: For further details, see the text. SNPs, single nucleotide polymorphisms.
Based on their functional annotation in the National Center for Biotechnology Information, US National Library of Medicine (https://www.ncbi.nlm.nih.gov/variation/view/) using GRCh37.p13, we did the following:
-
1. we gathered all of the existing SNPs from these genes present on our data (total = 18,668);
-
2. we merged this list with SNPs that were available on GTEx (see Table 2);
-
3. we retained the resulting list of SNPs and subjected it to linkage disequilibrium clumping (r 2 < .25), resulting in 205 independent functional SNPs, for example, expression quantitative trait loci;
-
4. based on the children's genotype data from MAVAN, we used a count function of the number of alleles at a given SNP weighted by the slope coefficient from a regression model predicting gene expression by SNPs in cis; and
-
5. we accounted for the direction of the coexpression of SLC6A4 with our genes of interest (Table 2).
Table 2 also depicts how many SNPs refer to each gene in the hippocampus.
For the sake of comparison, we also analyzed the polymorphism of 43 base pair insertion/deletion in the serotonin transporter linked polymorphic region (5-HTTLPR) promoter, that produces long and short variants, which was amplified with polymerase chain reaction techniques with primers and conditions previously described (Bouvette-Turcot et al., Reference Bouvette-Turcot, Fleming, Wazana, Sokolowski, Gaudreau and Gonzalez2015). There is evidence for two functional variants of the long allele (LA and LG) resulting from a single nucleotide polymorphism (A → G, rs25531) in the 5-HTTLPR region (Hu et al., Reference Hu, Lipsky, Zhu, Akhtar, Taubman, Greenberg and Goldman2006; Uher & McGuffin, Reference Uher and McGuffin2008). The LA/LA genotype is associated with higher mRNA expression in vitro (Hu et al., Reference Hu, Lipsky, Zhu, Akhtar, Taubman, Greenberg and Goldman2006). We grouped the LG and short alleles because these variants are functionally similar with respect to serotonin transporter (5-HTT) expression, and compared LA/LA homozygote infants to short/LG allele carriers.
Statistics
Statistical analysis of the baseline characteristics was performed using Student t test for continuous data and a chi-square test for categorical variables. Pearson correlations were obtained to investigate associations between the prenatal adversity score and the different outcomes. Finally, linear regression analysis using the genetic score (driven by biological function; see above) and prenatal adversity score, as well as the interaction term, adjusted by gender, were performed. Significance levels for all measures were set at p < .05. In addition, to account for multiple testing, we applied the Bonferroni–Holm method. The population structure of the MAVAN cohort was evaluated using principal component analysis of all autosomal SNPs that passed the quality control (Price et al., Reference Price, Patterson, Plenge, Weinblatt, Shadick and Reich2006). Ethnic outliers (>6 SD) were excluded from the analysis. Based on the inspection of the scree plot, the first three principal components were the most informative of population structure in this cohort and included in all subsequent analysis. Data were analyzed using the Statistical Package for the Social Sciences (SPSS) 22.0 software (SPSS Inc., Chicago) and R (R Core Team, 2014).
Results
Prenatal adversity predicts neurodevelopment and behavior (MAVAN)
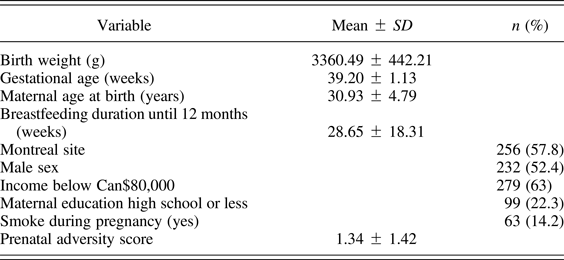
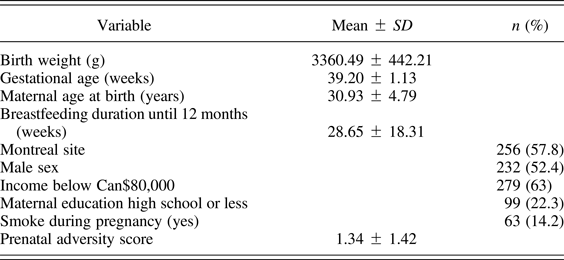
Table 3 describes the sample from the MAVAN project for which there was sufficient data to calculate a prenatal adversity score (N = 443). Figure 1 shows a heat map of significance levels of the correlations between prenatal adversity score and multiple neurodevelopmental outcomes, including the Bayley Scales of Infant and Toddler Development applied at 36 months, the CBCL applied at 48 and 60 months, as well as the School Readiness Battery applied at 48 and 60 months (see also online-only supplementary Table S.1 for correlation values). The findings reveal strong associations between the cumulative level of prenatal adversity and a wide range of neurodevelopmental outcomes. As expected, prenatal adversity scores were uniformly correlated with negative outcomes including higher problem scores on the CBCL and lower scales values on the Bayley and School Readiness tests. Most of these associations survived family-wise error rate correction for multiple comparisons, which reveals the strength of the findings.

Figure 1. (Color online) Heat map of the association between prenatal adversity score and the outcomes in MAVAN.
Table 3. Population description for MAVAN cohort
For the sake of comparison (Figure 1), we added the significance level of the correlations for each individual item used to calculate the prenatal adversity score and the same neurodevelopmental outcomes. The findings show that prenatal socioeconomic status (family income), prenatal symptoms of maternal depression, and anxiety were also strong predictors of the same neurodevelopmental outcomes. However, while the scores for individual measures of prenatal adversity are predictors of specific domains (e.g., income correlates well with cognition, but less with socioemotional development at 48 months), the prenatal adversity score is more broadly associated with outcomes than each one of the single scores, showing correlations in cognitive/neurodevelopmental as well as socioemotional and psychological outcomes. This pattern is notable when considering correlations that pass correction for multiple comparisons. Nevertheless, it appears that family socioeconomic status and maternal mood account for many of the findings revealed by the prenatal adversity score. We saw little evidence for the association between birth outcomes and neurodevelopmental outcomes.
The GUSTO cohort replication
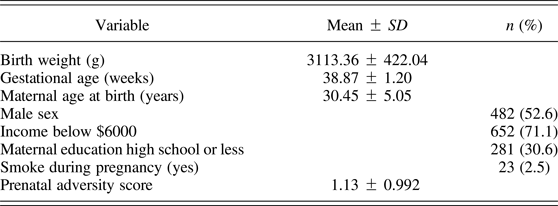
The GUSTO provided an opportunity to both replicate the findings with the MAVAN cohort and extend the analysis to include Southeast Asian ethnic groups. Table 4 describes the sample from GUSTO for which there was sufficient data to calculate the prenatal adversity score (N = 917), although the maternal mental health score was calculated somewhat differently (see Methods section).
Table 4. Population description for GUSTO
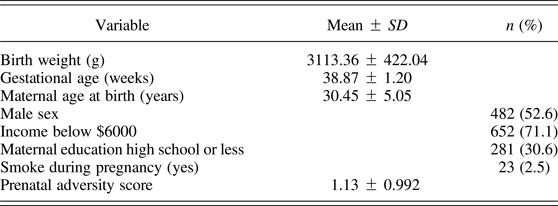
Figure 2 shows the heat map of significance levels of the correlations between prenatal adversity score and the outcomes, including the Bayley Scales of Infant and Toddler Development applied at 36 months, the CBCL applied at 48 months, as well as the School Readiness Battery applied at 48 months (see also online-only supplementary Table S.2 for correlation values). As in the MAVAN data, for all statistically significant cases the prenatal adversity scores were correlated with negative outcomes, higher behavioral problem scores on the CBCL and lower scale scores for the Bayley and school readiness tests. As in the MAVAN data, a number of the significant associations between the prenatal adversity scores and the developmental outcomes remain statistically significant after correction for multiple comparisons. The results thus confirm the predictive value of the prenatal adversity scale scores for a wide range of neurodevelopmental outcomes in Asian children.

Figure 2. (Color online) Heat map of the association between prenatal adversity score and the outcomes in GUSTO.
The findings from the two cohorts are, in general, very comparable, and both suggest strong associations between cumulative prenatal adversity and neurodevelopmental outcomes. However, we note some striking differences. While the prenatal adversity score in GUSTO, as in MAVAN, associates with both CBCL and School Readiness test outcomes, there is no evidence for associations with the Bayley Scale scores, despite the larger sample size.
Genetic moderation of prenatal adversity
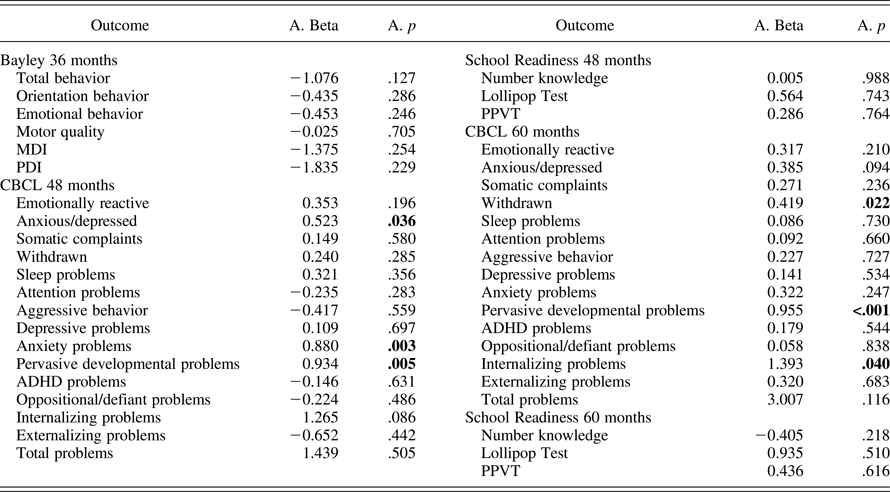
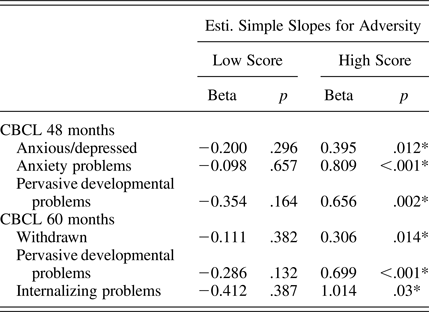
We found statistically significant interactions between the prenatal adversity score and the SLC6A4 ePRS on several domains of the CBCL at 48 months (anxious/depressed, anxiety problems, and pervasive developmental problems) as well as 60 months (withdrawal, pervasive developmental problems, and internalizing problems; Table 5). Children with a higher SLC6A4 ePRS score showed higher CBCL scores as prenatal adversity scores increases (single slopes on Table 6). However, after adjusting for multiple comparisons, only the interaction between the prenatal adversity score and the SLC6A4 ePRS score on pervasive developmental problems at 60 months remained statistically significant. The strongest effects of the SLC6A4 ePRS were in the domains related to emotional function.
Table 5. Estimated interactions coefficients between the prenatal adversity score and ePRS/SLC6A4
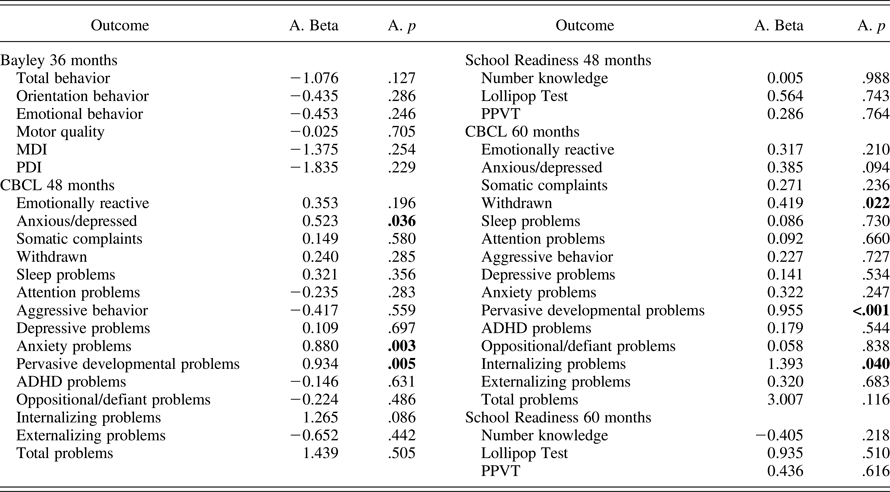
Table 6. Single slopes for the interactions between the prenatal adversity score and ePRS/SLC6A4
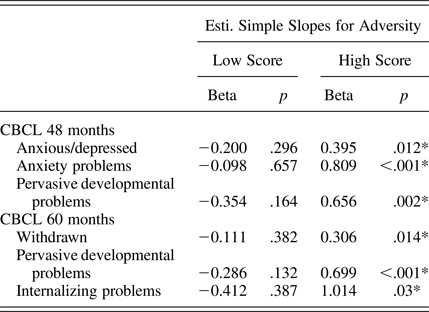
*p < .05.
When comparing the LA/LA homozygote infants to S/LG allele carriers, we found no significant interactions between the genotype and prenatal adversity score in Bayley Scale, CBCL, or School Readiness outcomes (data not shown). This comparison suggests that the ePRS for the SLC6A4 gene was a somewhat more powerful genetic moderator than the SLC6A4 genotype alone.
Enrichment analysis for the genes composing the SLC6A4 ePRS
Enrichment analysis of the list of genes that originated the SLC6A4 ePRS score (Table 3) using Metacore® (Thomson Reuters) shows two statistically significant pathway maps after false discovery rate (FDR) correction. The first is transcription/epigenetic regulation of gene expression (P FDR < .009), and the second is transport/RAN regulation pathway (P FDR < .03). Gene ontology processes were enriched for several epigenetic processes, neuron differentiation, and cellular transport (see Figure 3). The strongest biological processes included dopamine neuronal differentiation as well as a number of processes associated with the modeling of epigenetic marks, including DNA methylation, lysine demethylation, and H3-K9 methylation.

Figure 3. (Color online) Gene ontology processes related to the genes included in the expression polygenic risk score (ePRS/SLC6A4).
Discussion
The primary objective of this study was to examine the strength and breadth of the associations between a cumulative measure of prenatal adversity and neurodevelopmental outcomes in childhood. We devised a cumulative index of prenatal adversity that included many of the established, individual predictors of child health and development, including the risk for later psychopathology. We were able to replicate this finding in an Asian birth cohort study comparable to that of our Canadian cohort. We found that the cumulative prenatal adversity score was generally a more powerful statistical predictor of neurodevelopmental outcomes than was any single measure of prenatal adversity. An additional merit of this analysis was the ability to directly compare the relative effects of individual measures of prenatal adversity with respect to a wide range of neurodevelopmental outcomes. Maternal symptoms of depression and anxiety as well as family income were almost as strong in predicting neurodevelopmental outcomes as was the cumulative index of prenatal adversity. The socioeconomic status and maternal mood factors far outweighed the associations we observed between birth outcomes and measures of neurodevelopment. This conclusion is consistent with the results from both the Canadian and Singapore cohorts.
A weakness in making this comparison, and in interpreting the findings with the cumulative index of prenatal adversity, is that both maternal mood and income measures tend to remain stable over the perinatal period and thus are not unique to the prenatal period. However, there are several lines of evidence to suggest that these influences do operate over the prenatal period. First, a comprehensive study of the relation between maternal depression and the risk of later depression in the offspring strongly favors the influence of prenatal maternal mood (Pearson et al., Reference Pearson, Evans, Kounali, Lewis, Heron, Ramchandani and Stein2013). Second, neonatal imaging studies show strong associations between both prenatal family socioeconomic status and prenatal maternal symptoms of depression and anxiety on brain structure and organization (Piccolo et al., Reference Piccolo, Merz, He, Sowell and Noble2016; Qiu et al., Reference Qiu, Rifkin-Graboi, Chen, Chong, Kwek, Gluckman and Meaney2013; Rifkin-Graboi et al., Reference Rifkin-Graboi, Bai, Chen, Hameed, Sim, Tint and Qiu2013, Reference Rifkin-Graboi, Meaney, Chen, Bai, Hameed, Tint and Qiu2015; Yu et al., Reference Yu, Daugherty, Anderson, Nishimura, Brush, Hardwick and Ofen2017).
Previous efforts to analyze the long-term effects of prenatal adversity have focused exclusively on specific aspects of the prenatal environment, such as birth weight (Lahti et al., Reference Lahti, Eriksson, Heinonen, Kajantie, Lahti, Wahlbeck and Raikkonen2014) or maternal mental health (O'Donnell, Glover, Barker, & O'Connor, Reference O'Donnell, Glover, Barker and O'Connor2014). Latent class analysis has been used to characterize the environment in a comprehensive way, but these studies focus on the postnatal life (Copeland et al., Reference Copeland, Shanahan, Costello and Angold2009; Oliver, Kretschmer, & Maughan, Reference Oliver, Kretschmer and Maughan2014). Our prenatal adversity score is an ecologically valid predictor of altered child behavior and neurodevelopment. In addition, rather than focusing on end-state outcomes (“disease” vs. “no disease”), our study focuses on a broad range of neurodevelopmental outcomes, including those that reflect the risk for psychopathology. For example, we found a highly significant association between the cumulative prenatal adversity score and measures of school readiness in both cohorts (Figures 1 and 2). In terms of primary prevention, it may be more clinically relevant to understand the extent by which adversity alters normal neurodevelopment and behavior before the establishment of morbid conditions (Dougherty et al., Reference Dougherty, Smith, Bufferd, Stringaris, Leibenluft, Carlson and Klein2013; Enoch et al., Reference Enoch, Kitzman, Smith, Anson, Hodgkinson, Goldman and Olds2016).
The cumulative prenatal adversity score was a better predictor of cognitive and socioemotional outcomes than was any single measure. Income was a good predictor of neurodevelopment and cognitive abilities, in agreement with a large amount of evidence (reviewed in Bradley & Corwyn, Reference Bradley and Corwyn2002), but less so for socioemotional outcomes at 48 months. Other items such as marital strain and violence, health and smoking during pregnancy, birth weight, and gestational age showed surprisingly few associations with neurodevelopmental outcomes, and most did not survive the adjustment for multiple comparison. In sum, the cumulative prenatal adversity score appears to be a comprehensive picture of the prenatal environment, highly associated with child behavior, neurodevelopment, and risk for psychopathology. These findings, of course, also underscore the broad impact of prenatal adversity on neurodevelopmental outcomes.
The cumulative prenatal adversity score is an interesting metric for studies of genetic moderation of environmental conditions since it is not dependent upon any singular environmental conditions, but rather it captures a global level of prenatal adversity. We explored this possibility using a novel genomic approach. Genome-wide association studies (GWAS) have established statistically reliable associations between specific genetic variants and mental health outcomes (Hyde et al., Reference Hyde, Nagle, Tian, Chen, Paciga, Wendland and Winslow2016; Robinson et al., Reference Robinson, St. Pourcain, Anttila, Kosmicki, Bulik-Sullivan, Grove and Daly2016; Schizophrenia Working Group of the Psychiatric Genomics Consortium, 2014), particularly in schizophrenia and autism. However, such variants account for very small percentages of the variation in the specific outcome under study.
Moreover, the variants that emerge as “hits” in GWAS are limited for gene–environment interaction analyses, as the significant variants in a GWAS are identified only after washing out the several nuances of the environment (Dalle Molle et al., Reference Dalle Molle, Fatemi, Dagher, Levitan, Silveira and Dube2017). The alternative approach of individual, biologically informed single candidate genetic variants studies is likewise compromised by weaknesses (Duncan & Keller, Reference Duncan and Keller2011). Moreover, gene products operate in networks. Alterations in systems that regulate neurodevelopment derive from genomic variants at multiple sites that may converge to influence common biological pathways. This idea led to the use of methods of genomic risk profiling to examine the influence of genetic burden as reflected by a set of “risk” alleles for specific psychiatric disorders (Wray & Goddard, Reference Wray and Goddard2010).
The risk alleles and effect sizes of SNPs are established from existing GWASs using relevant “discovery” samples based on their p values below a specific threshold. A genomic profile risk score is calculated for each individual in the target sample as the sum of the count of risk alleles weighted by the effect size in the discovery sample. However, while this approach has shown some positive findings, it is limited by the fact that the genetic profile risk score is defined by the identity and weightings of variants identified in GWAS studies. Our aim was to build on the strength of a biologically informed candidate gene, SLC6A4, as well as that of the multiple loci, network-based approach. We assumed that genes that operate in networks are co- expressed and focused on brain regions that are known to associate with cognitive–emotional function. We used a series of filters to identify a hippocampal-specific SLC6A4 gene network, which we termed an ePRS. The SLC6A4 ePRS showed a significant interaction with cumulative prenatal adversity score on measures of childhood cognitive–emotional problems. We note that the SLC6A4 ePRS revealed significant interaction effects that were not apparent with the commonly used SLC6A4 polymorphism, the 5-HTTPLR variant, alone. In agreement to this literature, our genetic score could discern a subgroup of children who were more vulnerable to prenatal adversity, apparently in a more efficient way than the candidate-gene approach.
The strength of the ePRS approach is also apparent in the results of the informatics analyses that included a gene-ontology enrichment (Figure 3). This analysis identified multiple, highly significant (i.e., p < 10–4), biological processes on the basis of the genes included in the SLC6A4 ePRS. A number of these processes refer to epigenetic remodeling, including DNA methylation, lysine demethylation, and histone H3-K9 methylation. DNA methylation and histone modifications such as H3K9 methylation are epigenetic marks that are closely associated with gene expression (Meaney, Reference Meaney2010), and are candidate mechanisms for the effects of environmental regulation of gene expression (Dias, Maddox, Klengel, & Ressler, Reference Dias, Maddox, Klengel and Ressler2015; Meaney & Ferguson-Smith, Reference Meaney and Ferguson-Smith2010; Zhang, Labonte, Wen, Turecki, & Meaney, Reference Zhang, Labonte, Wen, Turecki and Meaney2013). Both in vivo and in vitro studies show that serotonin signaling directly alters DNA methylation and histone modifications in the rodent hippocampus (Hellstrom, Dhir, Diorio, & Meaney, Reference Hellstrom, Dhir, Diorio and Meaney2012; Weaver et al., Reference Weaver, Cervoni, Champagne, D'Alessio, Sharma, Seckl and Meaney2004).
The most statistically significant biological process identified by the informatics analysis was that dopaminergic neuron differentiation is also involved, which is not surprising considering the way that the score was built and the common source for monoaminergic progenitors (Abeliovich & Hammond, Reference Abeliovich and Hammond2007; Cheng et al., Reference Cheng, Scott, Ladenheim, Chen, Ouyang, Lathia and Shih2010). Genetic variation in genes that code for proteins implicated in dopamine pathways have been suggested to be highly responsive to environmental variation (Nikolova, Ferrell, Manuck, & Hariri, Reference Nikolova, Ferrell, Manuck and Hariri2011; Stice, Yokum, Burer, Epstein, & Smolen, Reference Stice, Yokum, Burger, Epstein and Smolen2012), and classically linked to “differential susceptibility” effects, rendering individuals more sensitive to adversity as well as positive environmental influences (Bakermans-Kranenburg & van IJzendoorn, Reference Bakermans-Kranenburg and van IJzendoorn2015; Belsky et al., Reference Belsky, Jonassaint, Pluess, Stanton, Brummett and Williams2009; Boyce & Ellis, Reference Boyce and Ellis2005; Brody et al., Reference Brody, Chen, Beach, Kogan, Yu, Diclemente and Philibert2014). An extensive meta-analysis identified dopamine-related genes as significant markers of differential susceptibility (Bakermans-Kranenburg & van IJzendoorn, Reference Bakermans-Kranenburg and van IJzendoorn2015). The evidence is particularly strong for the DRD4 seven-repeat allele (e.g., (Bakermans-Kranenburg & van IJzendoorn, Reference Bakermans-Kranenburg and van IJzendoorn2006). This variant as well as others in dopamine-related genes moderates the impact of prenatal adversity on mental health outcomes (Pluess, Belsky, & Neuman, Reference Pluess, Belsky and Neuman2009) as well as cortical thickness (Qiu et al., Reference Qiu, Tuan, Ong, Li, Chen, Rifkin-Graboi and Meaney2015).
The findings presented here also bear on the differential susceptibility hypothesis, which suggests that functional variants in specific genes render individuals more or less sensitive to environmental conditions (Bakermans-Kranenburg & van IJzendoorn, Reference Bakermans-Kranenburg and van IJzendoorn2007; Belsky et al., Reference Belsky, Jonassaint, Pluess, Stanton, Brummett and Williams2009, Reference Belsky, Newman, Widaman, Rodkin, Pluess, Fraley and Roisman2015). The implicit assumption is that such effects should occur across a wide range of neurodevelopmental outcomes. There is impressive evidence for effects on measures of cognitive, emotional, and social outcomes (Bakermans-Kranenburg & van IJzendoorn, Reference Bakermans-Kranenburg and van IJzendoorn2015).
However, to our knowledge, few if any studies were constructed to directly test this feature of the hypothesis by comparing the effects of a common measure of environmental conditions and a range of outcome measures. We acknowledge that the present study is likely underpowered to convincingly assess this issue. However, our measure of the SLC6A4 ePRS revealed moderating effects that were specific to certain outcomes, most notably in measures of socioemotional function (see Figure 3). This issue needs further analysis in studies with multiple outcome measures and larger sample sizes.
In summary, we propose approaches to characterize (a) the environment, considering different environmental characteristics at the same time in a simple and very predictive score; and (b) the genetic component, using a biologically informed score that can focus on specific pathways but is more comprehensive than the candidate-gene approach. This study opens a venue of possibilities to explore how different brain networks interact with the environment to influence health risks.
Supplementary Material
To view the supplementary material for this article, please visit https://doi.org/10.1017/S0954579417001262.


