Children display a wide range of individual differences in physiological responsivity to psychosocial challenges. Some individuals respond quickly and strongly to even minor stressors, while others show a flat pattern of response or minor deviations from resting states across different stressful situations (e.g., Berry et al., Reference Berry, Blair, Willoughby, Granger and Mills-Koonce2017; Del Giudice & Ellis, Reference Del Giudice, Ellis and Cicchetti2016; Del Giudice, Ellis, & Shirtcliff, Reference Del Giudice, Ellis and Shirtcliff2011; Del Giudice, Hinnant, Ellis, & El-Sheikh, Reference Del Giudice, Hinnant, Ellis and El-Sheikh2012; Ellis, Oldehinkel, & Nederhof, Reference Ellis, Oldehinkel and Nederhof2017; Quas et al., Reference Quas, Yim, Oberlander, Nordstokke, Essex, Armstrong and Boyce2014). The present study examines the developmental origins of such variation, focusing on the role of early life experiences in calibrating the functioning of stress response systems. Informed by biological sensitivity to context theory (BSC; Boyce & Ellis, Reference Boyce and Ellis2005; Ellis, Essex, & Boyce, Reference Ellis, Essex and Boyce2005), we tested for the nonlinear (U-shaped) relations between early life experiences and the magnitude of stress responses to laboratory challenges across the autonomic and adrenocortical systems. Specifically, we conducted signal detection analyses to identify levels and types of familial and ecological stress that, both singly and interactively, predicted the development of both low and high levels of physiological stress reactivity.
Effects of Early Rearing Conditions on the Development of Stress Responsivity
A substantial body of research has examined the links between exposure to different environmental conditions early in life and the magnitude and patterns of physiological stress reactivity. Different patterns of stress responsivity have been identified, depending on the type of environments that children are reared in; the timing, chronicity, and the severity of stressors that they encounter (reviewed in Bush & Boyce, Reference Bush and Boyce2014); and their demographic features (e.g., sex, age, and race; Fearon et al., Reference Fearon, Tomlinson, Kumsta, Skeen, Murray, Cooper and Morgan2017; Gifford & Reynolds, Reference Gifford and Reynolds2017). Intermittent exposure to moderately stressful conditions early in life (as experienced by the majority of children growing up in relatively stable middle-class home environments) regulates development toward dampened (moderate) physiological reactivity (e.g., Ellis et al., Reference Ellis, Oldehinkel and Nederhof2017; Levine & Mody, Reference Levine and Mody2003; Macrí, Zoratto, & Laviola, Reference Macrì, Zoratto and Laviola2011; Parker, Buckmaster, Schatzberg, & Lyons, Reference Parker, Buckmaster, Schatzberg and Lyons2004; Parker & Maestripieri, Reference Parker and Maestripieri2011). This “steeling” effect is consistent with the stress inoculation hypothesis (Eysenck, Reference Eysenck and Cooper1983; Lyons & Parker, Reference Lyons and Parker2007; Rutter, Reference Rutter1987), which postulates that exposures to mild stressors and challenges early in life potentially benefit children by enhancing their coping abilities, preparing them for greater challenges in the future, and thus promoting better psychological adjustment under conditions of mild adversity (Bush, Obradović, Adler, & Boyce, Reference Bush, Obradović, Adler and Boyce2011; Parker & Maestripieri, Reference Parker and Maestripieri2011; Seery, Holman, & Silver, Reference Seery, Holman and Silver2010).
In contrast, many studies have also found that more severe experiences of early adversity can upregulate stress reactivity (e.g., Bugental, Martorell, & Barraza, Reference Bugental, Martorell and Barraza2003; Conradt et al., Reference Conradt, Abar, Sheinkopf, Lester, Lagasse, Seifer and Hinckley2014; Fearon et al., Reference Fearon, Tomlinson, Kumsta, Skeen, Murray, Cooper and Morgan2017; Holochwost et al., Reference Holochwost, Gariépy, Mills-Koonce, Propper, Kolacz and Granger2017; Wilsmer Fries, Shirtcliff, & Pollak, Reference Wilsmer Fries, Shirtcliff and Pollak2008). Exposure to a variety of adverse situations early in life, such as maternal depression and psychological distress (Azar, Paquette, Zoccolillo, Baltzer, & Tremblay, Reference Azar, Paquette, Zoccolillo, Baltzer and Tremblay2007; Bush et al., Reference Bush, Jones-Mason, Coccia, Caron, Alkon, Thomas and Epel2017; Essex, Klein, Cho, & Kalin, Reference Essex, Klein, Cho and Kalin2002; Feldman et al., Reference Feldman, Granat, Pariente, Kanety, Kuint and Gilboa-Schechtman2009), parental conflict (Davies, Sturge-Apple, Cicchetti, & Cummings, Reference Davies, Sturge-Apple, Cicchetti and Cummings2008; El-Sheikh, Reference El-Sheikh2005), economic stress (Essex et al., Reference Essex, Klein, Cho and Kalin2002; Gump, Matthews, & Räikkönen, Reference Gump, Matthews and Räikkönen1999), socioeconomic adversity (Bush, Obradović, et al., Reference Obradović, Bush and Boyce2011; Chen, Langer, Raphaelson, & Matthews, Reference Chen, Langer, Raphaelson and Matthews2004), overcontrolling parenting (Taylor et al., Reference Taylor, Spinrad, VanSchyndel, Eisenberg, Huynh, Sulik and Granger2013), and maltreatment, neglect and insensitive parenting (Bugental et al., Reference Bugental, Martorell and Barraza2003; Enlow et al., Reference Enlow, King, Schreier, Howard, Rosenfield, Ritz and Wright2014; Oosterman, De Schipper, Fisher, Dozier, & Schuengel, Reference Oosterman, De Schipper, Fisher, Dozier and Schuengel2010) have been linked to greater autonomic and adrenocortical reactivity in children. Many other studies (e.g., Fearon et al., Reference Fearon, Tomlinson, Kumsta, Skeen, Murray, Cooper and Morgan2017; Fernald, Burke, & Gunnar, Reference Fernald, Burke and Gunnar2008; Fisher, Kim, Bruce, & Pears, Reference Fisher, Kim, Bruce and Pears2012; Koss, Mliner, Donzella, & Gunnar, Reference Koss, Mliner, Donzella and Gunnar2016; Lovallo, Reference Lovallo2013; Peckins, Dockray, Eckenrode, Heaton, & Susman, Reference Peckins, Dockray, Eckenrode, Heaton and Susman2012; Peckins, Susman, Negriff, Noll, & Trickett, Reference Peckins, Susman, Negriff, Noll and Trickett2015), however, have linked high levels of early adversity to downregulation of stress physiology (i.e., blunted physiological stress reactivity). In a meta-analysis of cortisol responsivity to social stress, Bunea, Szentágotai-Tătar, and Miu (Reference Bunea, Szentágotai-Tătar and Miu2017) found that early life adversity (chronic, severe stress) was robustly associated with blunted cortisol reactivity in adults (large effect) but not in children and adolescents (small effect). Together, these findings suggest that childhood exposure to chronic stressors are associated with alterations in magnitude and pattern of physiological responses, which are marked by either blunted (hypo) or enhanced (hyper) activation and reactivity of physiological stress systems.
Finally, emerging evidence suggests that exposure to highly nurturant and supportive family environments can also become biologically embedded in the functioning of stress response systems (Shirtcliff, Skinner, Obasi, & Haggerty, Reference Shirtcliff, Skinner, Obasi and Haggerty2017). A growing empirical literature suggests that a subset of children growing up in stable, supportive contexts develop heightened physiological reactivity to challenging conditions (e.g., Alkon et al., Reference Alkon, Boyce, Tran, Harley, Neuhaus and Eskenazi2014; Blair et al., Reference Blair, Granger, Kivlighan, Mills-Koonce, Willoughby, Greenberg and Fortunato2008; DePasquale, Raby, Hoye, & Dozier, Reference DePasquale, Raby, Hoye and Dozier2018; Ellis et al., Reference Ellis, Essex and Boyce2005, Reference Ellis, Oldehinkel and Nederhof2017; Evans et al., Reference Evans, Greaves-Lord, Euser, Tulen, Franken and Huizink2013; Hackman et al., Reference Hackman, Betancourt, Brodsky, Kobrin, Hurt and Farah2013; Luecken, Kraft, & Hagan, Reference Luecken, Kraft and Hagan2009). A common reactivity pattern among children in such supportive contexts is low basal activation of autonomic and adrenocortical systems, but strong responsivity to environmental challenges followed by fast recovery (Blair et al., Reference Blair, Granger, Kivlighan, Mills-Koonce, Willoughby, Greenberg and Fortunato2008; Ellis et al., Reference Ellis, Oldehinkel and Nederhof2017; Hackman et al., Reference Hackman, Betancourt, Brodsky, Kobrin, Hurt and Farah2013).
The BSC Developmental Programming Model
Although the literature examining links between early life experiences and stress response system (SRS) functioning has many complexities and opposing findings, some of these contradictions may be explained by Boyce and Ellis's (Reference Boyce and Ellis2005) BSC theory. The theory posits that (a) individual differences in stress reactivity constitute variation in susceptibility to environmental influence, both positive and negative, and that (b) natural selection favored developmental mechanisms that function to adjust levels of stress responsivity to match familial and ecological conditions encountered early in life. BSC theory proposes that humans have evolved developmental mechanisms that detect and internally encode information about the quality of childhood environments, which serves as an important basis for calibrating the development of stress response systems. Specifically, the theory (Boyce & Ellis, Reference Boyce and Ellis2005; see also Del Giudice et al., Reference Del Giudice, Ellis and Shirtcliff2011) posits a U-shaped, curvilinear relation between levels of stability/support versus stress/adversity in childhood environments and the magnitude of physiological stress reactivity.
The hypothesized U-shaped curve forms the basis of three adaptive patterns of stress reactivity: (a) exposure to very safe, supportive, nurturing, or low-stress family contexts upregulates stress reactivity and thus enhances the child's susceptibility to available benefits and opportunities in positive, development-enhancing environments (sensitive pattern); (b) exposure to childhood environments characterized by high levels of coercion, deprivation, or instability also upregulates stress reactivity, increasing children's vigilance to potential dangers and threats in high-risk developmental contexts (vigilant pattern); and (c) exposure to childhood environments that are neither highly nurturing and safe nor highly threatening and stressful (moderate adversity/support) results in moderate stress reactivity (buffered pattern), which strikes a balance between the costs and benefits of high reactivity. More recently, Del Giudice et al. (Reference Del Giudice, Ellis and Shirtcliff2011), as part of the adaptive calibration modle (ACM), extended the U-shaped model by proposing a fourth responsivity profile: the unemotional pattern, characterized by blunted stress responsivity that particularly emerges under exceptionally stressful conditions that inhibits social learning and sensitivity to the environment. These BSC/ACM predictions apply to both autonomic and adrenocortical stress reactivity.
Past Research Testing the BSC U-Shaped Curve Model
Most research examining links between childhood adversity/support and SRS functioning has tested for linear effects, with highly conflicting results (as reviewed above). Only a handful of studies have tested for nonlinear relations between the quality of early life experiences and the magnitude of physiological stress responses (i.e., reactivity to environmental challenges), as the BSC model proposes. Other studies (including prior analyses of the current sample; see Bush, Obradović, et al., Reference Bush, Obradović, Adler and Boyce2011) have tested for nonlinear relations between early experiences and basal SRS functioning, but baseline activity is not our focus here. Regarding SRS reactivity, the small extant literature on this topic has employed diverse analytic approaches (i.e., variable-centered vs. person-centered analyses) to test for these nonlinear associations.
To our knowledge, only two studies have attempted to test for the BSC U-shaped curve model by using traditional variable-centered analyses (e.g., multiple regression). Hagan, Roubinov, Purdom Marreiro, and Luecken (Reference Hagan, Roubinov, Purdom Marreiro and Luecken2014) examined the relation between college students’ perceptions of interparental conflict (prior to age 16) and cortisol reactivity in response to a challenging interpersonal role-play task. Ouellet-Morin et al. (Reference Ouellet-Morin, Robitaille, Langevin, Cantave, Brendgen and Lupien2018) examined the relation between recalled experiences of abuse and neglect (prior to age 18) in a community sample of adult males (ages 18–35) and cortisol reactivity to the Trier Social Stress Test. Consistent with the BSC model, in both studies, higher levels of cortisol reactivity were found among participants who reported either relatively high or low levels of childhood stress (relative to participants who reported moderate childhood adversity).Footnote 1
In contrast to these variable-centered studies, other research testing for nonlinear relations between childhood stressors and stress responsivity has employed person-centered approaches. These studies have used various forms of latent mixture modeling (including latent profile analysis) to identify different groups of people displaying different responsivity patterns based on multiple SRS parameters (Del Giudice et al., Reference Del Giudice, Hinnant, Ellis and El-Sheikh2012; Ellis et al., Reference Ellis, Oldehinkel and Nederhof2017; Gunnar, Frenn, Wewerka, & Van Ryzin, Reference Gunnar, Frenn, Wewerka and Van Ryzin2009; Quas et al., Reference Quas, Yim, Oberlander, Nordstokke, Essex, Armstrong and Boyce2014). In terms of testing for the U-shaped curve, the key question in these studies is whether there were two distinct groups of people displaying high stress responsivity, and whether these two groups were characterized by high and low levels of childhood adversity/support respectively. Each of these four studies prospectively measured childhood exposures to familial and ecological adversity/support (during early or middle childhood) and assessed their relations with autonomic and/or adrenocortical reactivity to laboratory challenges.
Consistent with the U-shaped curve hypothesis, Del Giudice et al. (Reference Del Giudice, Hinnant, Ellis and El-Sheikh2012), Ellis et al. (Reference Ellis, Oldehinkel and Nederhof2017), and Gunnar et al. (Reference Gunnar, Frenn, Wewerka and Van Ryzin2009) all found two profiles characterized by heightened reactivity in one or more of the stress response systems, and in each study one of the high responsivity profiles was characterized by low early life stress (e.g., relatively warm, supportive family relationships) as per the sensitive profile, and the other was characterized by high early life stress (e.g., harsh rearing conditions) as per the vigilant profile. By contrast, Quas et al. (Reference Quas, Yim, Oberlander, Nordstokke, Essex, Armstrong and Boyce2014) found three high responsivity profiles, but only one of them was associated with family stress/support. Specifically, they found evidence for a vigilant profile (but not a sensitive profile per se). Gunnar et al. (Reference Gunnar, Frenn, Wewerka and Van Ryzin2009) found evidence for the full U-shaped curve based on adrenocortical reactivity, but only found evidence for a vigilant profile based on autonomic reactivity. In total, these person-centered studies provided provisional support for the U-shaped curve, though with some exceptions from the expected patterns.
It should be noted that each of these four papers used latent mixture modeling, first and foremost, to identify patterns of stress responsivity. Whereas Del Giudice et al. (Reference Del Giudice, Hinnant, Ellis and El-Sheikh2012), Ellis et al. (Reference Ellis, Oldehinkel and Nederhof2017), and Quas et al. (Reference Quas, Yim, Oberlander, Nordstokke, Essex, Armstrong and Boyce2014) used latent profile analysis to identify integrated stress responsivity patterns across multiple SRS subsystems and activational parameters, Gunnar et al. (Reference Gunnar, Frenn, Wewerka and Van Ryzin2009) used group-based trajectory modeling to separately identify autonomic and adrenocortical response patterns. Across all of these studies, the use of latent mixture modeling gave primacy to SRS parameters in defining the latent profiles/latent groups; environmental factors (predictors of class) were loaded onto the latent profiles/latent groups afterward. Although this method is valuable, especially for testing the ACM (with its central focus on multisystem stress responsivity patterns), it does not allow one to examine how different environmental factors interact to predict stress responsivity. Thus, latent mixture modeling in this context is not very useful for examining how complex familial and ecological conditions regulate stress responsivity.
An alternative person-centered approach, employed by Ellis et al. (Reference Ellis, Essex and Boyce2005), is signal detection analysis, which was used to identify the contextual factors and personal characteristics that best distinguished high stress reactivity individuals (defined as the top 25% of stress reactivity scores) from their less reactive peers (defined as the bottom 75%). Across two studies of children ranging from 3 to 7 years of age, Ellis et al. (Reference Ellis, Essex and Boyce2005) found that a disproportionate number of children in supportive, low-stress environments displayed high autonomic reactivity (sensitive profile). In addition, in one of the studies, a relatively high proportion of children in very stressful environments showed evidence of heightened sympathetic and adrenocortical reactivity (vigilant profile). In total, the results provided some support for the hypothesized U-shaped curvilinear relation between childhood stress/support and autonomic reactivity. The use of signal detection analyses in this research was useful for identifying interactions between multiple dimensions of family environments in regulating stress responsivity. For example, the combination of low major stressful life events and high family routines predicted the highest proportion of children with high heart rate reactivity.
In sum, regardless of the method that these empirical studies used in their analyses, they all suggest that early life experiences affect the functioning of the SRS in a nonlinear fashion. However, not all of the studies found the predicted U-shaped curve, and there were inconsistencies across studies in which SRS subsystems displayed the curve. These inconsistencies call attention to the need for more empirical investigations of the nonlinear relations between different contextual factors and adrenocortical and autonomic reactivity.
The Current Study
The present study was designed as a conceptual replication of Ellis et al. (Reference Ellis, Essex and Boyce2005). Replication has emerged as a critically important scientific issue (e.g., Koole & Lakens, Reference Koole and Lakens2012; Munafò et al., Reference Munafò, Nosek, Bishop, Button, Chambers, du Sert and Ioannidis2017; Zwaan, Etz, Lucas, & Donnellan, Reference Zwaan, Etz, Lucas and Donnellan2017). Conceptual replications involve using the same conceptual variables employed in previous research to test the same hypothesis using the same data analytic methods, but the variables in the replication study are operationalized in a different way. If a conceptual replication is successful, it increases confidence that the original findings were not specific to the original measures and sample. The measures used in the current study and in Ellis et al. (Reference Ellis, Essex and Boyce2005, Studies 1 and 2) were closely conceptually matched (see Table 1). In addition to the conceptual replication (testing for contextual factors and personal characteristics that best distinguished high stress reactivity individuals; top 25%), we extended Ellis et al. (Reference Ellis, Essex and Boyce2005) by testing for which factors best distinguished low stress reactivity individuals (bottom 25%). Our primary goal was to test for the hypothesized U-shaped association between high versus low levels of adversity/support within the home environment and the magnitude of physiological stress responses, as proposed by the BSC model and first tested by Ellis et al. (Reference Ellis, Essex and Boyce2005). Our test of the U-shaped curve, however, should be considered provisional due to the nature of the available childhood environment measures. Although these measures were well designed to capture normative variation in family adversity, they did not adequately measure variation in warm/supportive family contexts; thus, we were only able to operationalize positive childhood environments in terms of the absence of adversity.
Table 1. Conceptual replication of Ellis et al. (Reference Ellis, Essex and Boyce2005): Study characteristics
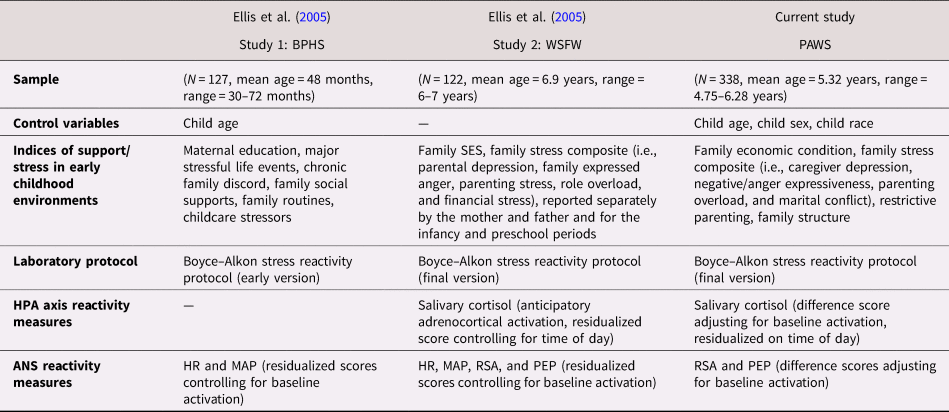
Note: BPHS, Berkeley Preschool Health Study. WSFW, Wisconsin Study of Families and Work. PAWS, Peers and Wellness Study. SES, socioeconomic status. HPA, hypothalamic–pituitary–adrenal axis. ANS, autonomic nervous system. HR, heart rate. MAP, mean arterial blood pressure. PEP, pre-ejection period. RSA, respiratory sinus arrhythmia.
Although the ACM provides a more complete and nuanced picture of the links between early rearing conditions and different stress responsivity patterns, the current study was not well positioned to test the ACM. The specific nature of our sample (i.e., the relatively small proportion of participants from very poor or adverse backgrounds) together with the young age of participants (mean age: 5.23 years) does not support an adequate test of the ACM unemotional responsivity pattern (which is hypothesized to emerge in middle childhood under more traumatic conditions). Nonetheless, for completeness, we included both high and low stress responsivity as dependent variables in the signal detection analyses, allowing us to test for all four ACM profiles, including stress hyporesponsitivity characteristic of the unemotional pattern.
Consistent with ecological systems theory (Bronfenbrenner, Reference Bronfenbrenner1979, Reference Bronfenbrenner1989), BSC theory conceptualizes family environments as dynamic systems with many interacting parts, though the theory does not specify the nature of those interactions in advance. Further, BSC theory conceives of early life experiences broadly and does not specifically distinguish between such dimensions of family environments as chronic versus acute stress or threat versus deprivation. Given this relative lack of specificity, our use of signal detection analysis enabled us to explore indices of contextual and familial stressors that were closely associated (either singly or in combination) with high reactivity patterns (i.e., the vigilant and the sensitive patterns) and the low reactivity patterns (i.e., the buffered and the unemotional patterns) across the two major stress response systems: the autonomic nervous system and the hypothalamic–pituitary–adrenal (HPA) axis.
Based on the BSC U-shaped curve model, we specifically hypothesized that children who were raised in families characterized by relatively high levels of stress (consistent with the vigilant physiological profile) or very low levels of stress (consistent with the sensitive physiological profile) would show heightened autonomic and adrenocortical reactivity in response to laboratory challenges. To replicate Ellis et al. (Reference Ellis, Essex and Boyce2005), we defined high reactivity using a top 25% cutoff. Heightened autonomic reactivity was indexed in terms of the sympathetic nervous system (SNS) and the parasympathetic nervous system (PNS). Heightened HPA axis reactivity was indexed in terms of salivary cortisol. In contrast, we expected to observe low to moderate reactivity (bottom 75%) in children who experienced moderate levels of stress within the family context (consistent with the buffered profile). Finally, in the signal detection analyses focusing on low reactivity (bottom 25%), we explored whether hyporeactivity would emerge in a subset of children experiencing very high stress (as per the unemotional profile).
Method
Participants
The data for the present study were drawn from the Peers and Wellness Study (PAWS), a longitudinal study of family social status, biological responses to adversity, and child mental and physical health (Bush, Alkon, Obradović, Stamperdahl, & Boyce, Reference Bush, Alkon, Obradović, Stamperdahl and Boyce2011; Obradović, Bush, Stamperdahl, Adler, & Boyce, Reference Obradović, Bush, Stamperdahl, Adler and Boyce2010). The sample consisted of 338 children (163 females, 175 males) with the mean age of 5.32 years (SD = 0.32, range = 4.75–6.28) at kindergarten entry. Participants were recruited in three waves from 29 kindergarten classrooms within six public schools in the San Francisco Bay Area. The sample was ethnically and racially diverse (19% African American, 11% Asian, 43% European or White, 4% Latino, and 22% multiethnic), approximating the demographic of the areas from which the sample was drawn. Primary caregiver participants identified themselves as 87% biological mothers, 9% biological fathers, 2.5% adoptive mothers, 0.6% biological grandmothers, and 0.9% “other” relations. Average annual household income ranged from less than $10,000 to more than $400,000. Mean income fell within $60,000 to $79,999 and median income fell within the $80,000 to $99,999 range. Highest level of educational attainment in the household ranged from less than a high school diploma to advanced degrees, with 75% of caregivers reporting that one household adult had at least a college degree. Although the population demonstrated a fairly high average income and level of education, relative to national averages, these should be considered within the extremely high cost of living within the San Francisco Bay Area, particularly for families with young children. Seventy-two percent of the parents were married or partnered to a biological or adoptive parent of a target child, 8% were separated or divorced, 10% were never married or partnered, 3% had no contact with the other biological parent, 2% were categorized as “other,” and 5% did not report on their marital status.
Procedures
Data for these analyses were collected in the fall of the kindergarten year, which is most likely to reflect historical and concurrent family context influences on physiology, prior to the sustained exposure of kindergarten classroom and school environments that can shape physiology. Prior to start of data collection, informed consent and assent were obtained from parents and children, respectively. Parent report of family adversity and children's functioning was collected through a series of home mailings, children participated in the physiologic data collection during the school day at their schools, and families were compensated with $50 for each completed time point.
Children completed the 20-min reactivity protocol, designed to measure children's autonomic and adrenocortical stress responses to a series of developmentally appropriate laboratory challenges (i.e., social, cognitive, sensory, and emotional challenges; Alkon et al., Reference Alkon, Goldstein, Smider, Essex, Boyce and Kupfer2003; Bush, Alkon, et al., Reference Bush, Alkon, Obradović, Stamperdahl and Boyce2011; Obradović et al., Reference Obradović, Bush, Stamperdahl, Adler and Boyce2010). The reactivity protocol was designed to allow researchers to better parse out “stress reactivity” by controlling for the activation of the PNS caused by psychomotor activities, such as gesturing, speaking, focused attending, and other nonchallenging activities. Specifically, each challenge task in the reactivity protocol was preceded by a nonchallenging “control task” that paralleled the motor and engagement demands of the challenge task. Levels of autonomic arousal during these control tasks were indexed as baseline reference values for the calculation of autonomic nervous system reactivity scores (which were calculated as differences scores between the control and challenge tasks). See Alkon et al. (Reference Alkon, Goldstein, Smider, Essex, Boyce and Kupfer2003) and Bush, Alkon, et al. (Reference Bush, Alkon, Obradović, Stamperdahl and Boyce2011) for detailed discussion of the protocol's design and development.
The autonomic reactivity protocol (Bush, Alkon, et al., Reference Bush, Alkon, Obradović, Stamperdahl and Boyce2011) began with an experimenter reading a child a calming short story for about 2 min. This was followed by four sets of paired tasks that each consisted of a control condition and a challenge condition. First, the social challenge task (2 min) was a structured interview about the things that a child likes and dislikes about his/her family and friends (adapted from Gesell School Readiness Screening Test; Carlson Reference Carlson, Keyser and Sweetland1985). The challenge task was preceded by the social control task (2 min) in which the children were asked to name common animals and colors from a picture book, capturing the arousal associated with speaking, gestures, and focused attending demands of the task. Second, the cognitive challenge task (2 min) was a digit span recitation task derived from the Kaufman Assessment Battery for children (Kaufman & Kaufman, Reference Kaufman and Kaufman1983), in which children were asked to recall sequences of numbers up to six digits in length and received negative verbal feedback after making a mistake. The task was preceded by the cognitive control task in which children were asked to repeat simple, one- or two-digit, number sequences to capture arousal associated with listening, speaking numbers, and social engagement (1 min). Third, the sensory challenge task (1 min) was a taste-identification task (Kagan & Snidman, Reference Kagan and Snidman1991) during which children were asked to identify two drops of concentrated lemon juice placed on their tongues. In the preceding sensory control task (1 min), the child was asked to identify two drops of water placed on his/her tongue, which captured arousal associated with mouth opening and swallowing, anticipation, and guessing the content of the liquid. Fourth, the emotional challenge task (2 min) consisted of watching a short emotion-evoking movie clip chosen to elicit fear (Eisenberg et al., Reference Eisenberg, Fabes, Bustamante, Mathy, Miller and Lindholm1988). This was preceded by the emotion control task in which children were asked to watch an emotionally neutral movie clip to capture physiological responding associated with attending to visual stimuli (2 min). The autonomic reactivity protocol terminated with the reading of another calming story for 2 min.
Assessment of stress reactivity
Children's autonomic and adrenocortical reactivity was assessed by computing variations in respiratory sinus arrhythmia (RSA), pre-ejection period (PEP), and salivary cortisol during the stress reactivity protocol. RSA is an index of PNS activity that measures the influence of the myelinated vagus on beat-to-beat variation in heart rate over the inhalation versus exhalation phases of a breathing cycle (Beauchaine, Reference Beauchaine2001; Berntson, Cacioppo, & Quigley, Reference Berntson, Cacioppo and Quigley1993; Porges, Reference Porges2007). Cardiac PEP is a measure of SNS activity that gauges of beta-adrenergic influences on the heart. It indexes the contraction time interval (electrical-mechanical delay) in the left ventricle that occurs between the onset of ventricular depolarization and the opening of the aortic valve (Cacioppo, Uchino, & Berntson, Reference Cacioppo, Uchino and Berntson1994). HPA axis activity was measured through salivary cortisol, the principal human glucocorticoid.
After the child was familiarized with the laboratory equipment, four spot electrodes (two current, two impedance) were placed in the standard tetrapolar configuration on the child's neck and chest, and ECG electrodes were placed on the right clavicle and lower left rib. A 4-μA AC current at 100 kHz was passed through the two current electrodes, and the basal thoracic impedance (Z0) and first derivative of change in impedance over change in time (dZ/dt) signals were acquired from the two impedance electrodes. RSA and PEP levels were monitored continuously during the protocol. Data were acquired using the Biopac MP150 (Biopac Systems, Santa Barbara, CA) interfaced to a PC-based computer. Analog data were continuously monitored on the computer for signal and noise, and digitized data were stored for offline analysis. Most of the missing autonomic nervous system data (2.7%–3.1% of RSA values and 4.6%–5.8% of PEP values during challenge and/or control tasks) were attributable to acquisition or scoring problems, such as equipment malfunction, research assistant error, extraneous movement, and electrode misplacement or displacement.
RSA was derived in accordance with recommendations of the Society for Psychophysiological Research committee on heart rate variability (Berntson et al., Reference Berntson, Bigger, Eckberg, Grossman, Kaufman, Malik and van der Molen1997). The sampling frequency was 1 kHz. Prior to analyses, each waveform was verified, interbeat inervals were visually checked, and artifacts were identified using Berntson, Quigley, Jang, and Boysen's (Reference Berntson, Quigley, Jang and Boysen1990) algorithm within the MindWare software program (http://www.mindwaretech.com). RSA was estimated as the natural logarithm of the variance of heart period in milliseconds squared (ln[ms2]) within the high-frequency bandpass associated with respiration at this age (i.e., 0.15–0.80 Hz; Bar-Haim, Marshall, & Fox, Reference Bar-Haim, Marshall and Fox2000; Rudolph, Rudolph, Hostetter, Lister, & Siegel, Reference Rudolph, Rudolph, Hostetter, Lister and Siegel2003). Outlier data were checked and verified minute by minute if they were >3 SD from the group mean. Mean RSA magnitude was calculated for each 1-min interval and averaged within task. RSA scores during each of the control tasks were used as baseline reference (i.e., vagal tone) to create four task RSA reactivity scores (i.e., challenge task minus baseline scores). These difference scores obtained for each task were then averaged to create a composite index. Negative scores indicate a decrease in RSA from baseline, indicating vagal withdrawal (higher PNS reactivity). In contrast, positive scores reflect an increase in RSA from baseline, indicating vagal augmentation (lower PNS reactivity).
PEP time intervals were calculated based on the time in milliseconds from the ECG Q-point (corresponding to the onset of ventricular depolarization) to the B-point of the dZ/dt waveform (corresponding to the onset of left ventricular ejection; Kelsey & Guethlein, Reference Kelsey and Guethlein1990). The same procedure described for PNS reactivity was used to calculate SNS reactivity across the four challenge and control tasks. Difference scores obtained for each task were averaged to create a composite index. Higher SNS reactivity is indexed by shorter PEP intervals (i.e., faster heart rate and increased cardiac output), whereas lower SNS reactivity is indexed by longer PEP intervals (i.e., slower heart rate and decreased cardiac output).
The correlations between the four PEP reactivity scores and between the four RSA reactivity scores were small (i.e., r < .15) and mostly nonsignificant across the tasks (see Bush, Alkon, et al., Reference Bush, Alkon, Obradović, Stamperdahl and Boyce2011, for details of the task-by-task intercorrelations among the RSA and SNS measures). Despite these low correlations, multidomain composites are fairly standard in child physiology literature, and our approach is consistent with that taken by a multitude of labs and studies (Alkon et al., Reference Alkon, Goldstein, Smider, Essex, Boyce and Kupfer2003; Boyce et al., Reference Boyce, Quas, Alkon, Smider, Essex and Kupfer2001; Bush, Alkon, et al., Reference Bush, Alkon, Obradović, Stamperdahl and Boyce2011; Bush, Caron, Blackburn, & Alkon, Reference Bush, Caron, Blackburn and Alkon2016; Gangel et al., Reference Gangel, Shanahan, Kolacz, Janssen, Brown, Calkins and Wideman2017; Suurland, van der Heijden, Huijbregts, Van Goozen, & Swaab, Reference Suurland, van der Heijden, Huijbregts, Van Goozen and Swaab2018). High correlations among specific task reactivities are not required for such an approach and are not expected at a sample level, as the protocol was designed to capture reactivity across a variety of unrelated contexts.
Salivary cortisol was collected at the beginning and end of the reactivity protocol by instructing a child to chew on a cotton roll for 20–30 s. The wet cotton rolls were then deposited in salivette tubes and stored at –7 °C until assayed. The detection limit of the assay was 0.41 nanomoles per liter (nmol⁄L). The mean interassay and intra-assay variations were 8.5% and 6.1%, respectively. Cortisol values above 55 nmol⁄L (<1% of samples) were considered unreliable data and were discarded. Twenty children in this sample were taking medications, such as human growth hormone and exogenous glucocorticoids, known to alter salivary cortisol levels (Masharani et al., Reference Masharani, Shiboski, Eisner, Katz, Janson, Granger and Blanc2005). These children were excluded from analyses of cortisol reactivity. Cortisol values collected at the beginning of the session were considered baseline reference values (in the familiar context of the kindergarten classroom), and the cortisol values collected at the end of the session (average session lasted 27 min, SD = 3 min, range = 19–38 min) were considered a measure of adrenocortical activation in response to a novel and mildly stressful situation (e.g., strange experimenter, electrodes, and challenge tasks). HPA axis reactivity was calculated as cortisol differences scores (postprotocol score minus preprotocol score).
Cortisol collection took place at different times of the day (i.e., in the morning and in the afternoon). The mean cortisol collection time was 11:43 a.m. for the first sample (preprotocol; SD = 1 hr, 49 min, range = 8:35 a.m.–4:16 p.m.) and 12:10 p.m. for the second sample (postprotocol; SD = 1 hr, 49 min, range = 9:05 a.m.–4:45 p.m.). The time of collection was not related to absolute preprotocol (r = –.08, p = .13) or postprotocol (r = –.03, p = .58) cortisol levels. Nonetheless, in order to control for variations in circadian activity of the HPA axis across the day, we regressed the raw cortisol reactivity scores on the time of collection and created standardized residual scores. Throughout our analyses, we used these time-of-day-adjusted scores to operationalize the HPA axis reactivity, with greater scores indicating higher HPA axis reactivity.
Measures of family environment
The measures of family environment were chosen to capture familial and ecological conditions that were both more proximal to the child (i.e., quality of parenting) and more distal (i.e., family structure, more general family stress, and family economic conditions). This strategy of reducing the data to four family environment variables was meant to strike a balance between capturing major dimensions of the family environment and having many smaller, fine-grained measures, which would have resulted in many more statistical tests and increased the chance of Type I error. Our choice of four family environment measures also parallels the approach taken in Ellis et al. (Reference Ellis, Essex and Boyce2005). Descriptive statistics for the family environment measures are shown in Table 2.
Table 2. Descriptive statistics for family environment variables

a 0 = non-intact; 1 = intact.
Family structure
Biological family disruption is a powerful predictor of many child developmental outcomes (e.g., Ellis et al., Reference Ellis, Bates, Dodge, Fergusson, John Horwood, Pettit and Woodward2003). We assessed intact versus non-intact families, based on whether the biological or adoptive parents were still married/partnered to each other at the time of the assessment; 1 = intact; 0 = non-intact).
Family stress
We used four parent-report indices of family adversity to broadly capture stressors experienced by the child within the family context. Parenting overload was assessed with five items derived from Essex et al. (Reference Essex, Klein, Cho and Kalin2002) that measured feelings of being overwhelmed with parenting duties, juggling conflicting obligations, and lacking time to rest or pursue desired activities (α = 0.79). Marital/partner conflict was assessed using the 10-item O'Leary–Porter Overt Hostility Scale (α = 0.72) that measured how often parents openly argue, display physical and verbal hostility, and criticize each other in the presence of their children (Johnson & O'Leary, Reference Johnson and O'Leary1987; Porter & O'Leary, Reference Porter and O'Leary1980); caregiver respondents who self-identified as being in a committed relationship completed this questionnaire (N = 260; 77% of sample). Exposure to Negative⁄anger expressiveness in the family was assessed using both the Family Expressiveness Questionnaire (FEQ; Halberstadt, Reference Halberstadt1986) and the Anger Expression Inventory (AEI; Spielberger, Reference Spielberger1988). The FEQ consists of a 10-item negative dominant subscale (α = 0.83), measuring the frequency of overt anger, contempt, and hostility among family members, and a 10-item negative subdominant subscale (α = 0.75), measuring the frequency of passive sulking, crying, and disappointment among family members. We averaged the two FEQ subscales (r = .55, p < .001) to yield one measure of negative family expressiveness. The total AEI score was calculated using three 8-item subscales that assess parents’ tendency to express overtly toward other people (α = 0.69), hold angry feelings inside (α = 0.68), and control the experience and expression of anger (α = 0.74). We standardized and averaged the overall scores based on FEQ and AEI (r = .47, p < .001) into one indicator of exposure to negative⁄anger expressiveness. Caregiver depression was assessed with the 20-item Center for Epidemiological Studies Depression Scale (α = 0.81; Radloff, Reference Radloff1977) filled out by the respondent (89% mothers). These four measures were somewhat intercorrelated (rs ranged from .15 to .35) and collectively captured our target construct. To capture children's overall exposure to these stressors within the family domain, we standardized and averaged the four indices of adversity (including all participants who had scores on at least 3 of the 4 measures) into one measure of family stress.
Restrictive parenting
Parents’ attitudes toward child-rearing and their use of harsh, restrictive, and controlling parenting practices were employed as a (negative) measure of the quality of parenting. Restrictive parenting was assessed with 18 items from the Child-Rearing Practice Report (Block, Reference Block1965). Selection of these items was based on prior factor analyses that identified and validated a 22-item restrictiveness scale on the Child-Rearing Practice Block (Deković, Janssens, & Gerris, Reference Deković, Janssens and Gerris1991; Rickel & Biasatti, Reference Rickel and Biasatti1982). Three items from the original factor were excluded due to their sexual nature, which was deemed less developmentally applicable within our sample (e.g., “I do not think children should be given sexual information”), and 2 items were omitted because they were less substantively related to restrictive parenting within our sample and geographic region (“I instruct my child not to get dirty when he is playing” and “I do not want my child to be looked upon as different from others.”). The remaining 17 items evaluated parental attitudes toward child-rearing (e.g., “I believe that scolding and criticism make a child improve”) and the degree to which they practiced harsh, restrictive, and controlling parenting (e.g., “I do not allow my child to question my decisions” and “I try to keep my child away from children or families whose ideas or values are different from our own”). One additional item from the original scale was added to assess discipline strategies (“I believe physical punishment to be the best way of disciplining”). All items were rated on a 7-point scale ranging from extremely true to extremely untrue. All items were reverse scored and averaged together such that higher values of the composite represented more restrictive parenting (α = 0.83).
Family economic condition
Parents were asked to report total household annual income on an 11-point scale that ranged from less than $10,000 to over $400,000. In addition, parents self-report of financial stress was assessed with four items derived from Essex et al. (Reference Essex, Klein, Cho and Kalin2002) that measured parents’ perceptions about money problems, difficulty paying bills, and limited opportunities due to lack of finances (α = 0.81). Descriptive statistics for the two measures are shown in Table 2. To create one index of family economic condition, we standardized the total household annual income and financial stress (reverse-scored) and averaged them together (r = .53). Higher scores indicated better family economic condition.
Data analytic plan
We conducted exploratory signal detection analysis or (receiver operating characteristic analysis; ROC) to delineate which predictor variables and which cut points within those variables’ ranges of values discriminate between high and low reactivity groups with the greatest efficiency. The signal detection analysis is a well-established exploratory recursive partitioning method for discovering the characteristics of individuals that best predict a binary outcome (Kraemer, Reference Kraemer1992). This analytic approach is commonly used in clinical medicine and epidemiological research as a diagnostic method to identify distinct subgroups of individuals (based on multiple characteristics, or, in the present case, based on multiple aspects of family and ecological stress) who are at high risk for developing a certain disorder. It also functions as a decision-making tool for evaluating the effectiveness of diagnostic tests (Kiernan, Kraemer, Winkleby, King, & Taylor, Reference Kiernan, Kraemer, Winkleby, King and Taylor2001; Swets, Reference Swets1972; Yesavage et al., Reference Yesavage, Hoblyn, Sheikh, Tinklenberg, Noda, O'Hara and Kraemer2003; Zweig & Campbell, Reference Zweig and Campbell1993). Signal in this context is a dichotomous outcome (e.g., whether or not a patient has diabetes), and the detection is a set of predictors or combinations of characteristics that distinguish, for example, diabetic patients from nondiabetic people. Signal detection analysis is a form of “person-centered analyses,” which is used when distinct groups of individuals are expected to exist within a sample distribution and individuals within a subgroup share similar patterns of characteristics. Consistent with past research (Ellis et al., Reference Ellis, Essex and Boyce2005), the current analyses designated the top 25% and bottom 25% of reactivity scores as cutoffs (in creating the dichotomous outcome variables) for operationalizing high and low physiological stress reactivity.
For our current purposes, signal detection analysis should be regarded as a useful approximation. Although BSC theory postulates a continuum of individual variation, nonlinear interactions between continuous measures of environmental stress and physiological function are much easier to capture in a typological model based on distinct groups than in standard regression models (which are generally underpowered to detect interactions; Durand, Reference Durand2013; McClelland & Judd, Reference McClelland and Judd1993). Moreover a key advantage of signal detection analyses is their ability to detect higher order interactions in the data (Kiernan et al., Reference Kiernan, Kraemer, Winkleby, King and Taylor2001). By testing for interactions between multiple dimensions of familial and ecological stress, as modeled by subgroups of individuals with shared characteristics, signal detection analysis enables one to begin to capture the nonlinear complexity of family environments. Following Ellis et al. (Reference Ellis, Essex and Boyce2005), in cases where the signal detection analysis suggests a curvilinear relation between familial/ecological stress and physiological stress reactivity, we then evaluate the statistical significance of that relation by examining groups’ mean differences on the stress reactivity variable (continuous measure) in a one-way analyses of variance (ANOVA) using both linear and quadratic terms.
Results
Defining the range of environmental variation
To fully test for the BSC U-shaped curve, the study sample needs to encompass a wide range of psychosocial stress and support over childhood, from conditions of high stability/support to high stress/adversity. Beyond this range of normative variation, the study sample needs to include severe, traumatic stress exposures to test for all four ACM profiles. As shown in Table 2, families in the PAWS sample reported experiencing a broad range of stressors, covering nearly the full possible distribution for most psychosocial adversity measures. In particular, restrictive parenting, financial stress, and parenting role overload were endorsed across the full possible continuum, with mean levels near the midpoints of the scales. Anger expression, family expressiveness, and marital conflict, however, were not endorsed at the highest possible levels in this sample, resulting in mean levels below the midpoint of the scale, though each variable still demonstrated good variability. Caregiver depression had the smallest range and lowest average level; roughly 7% of the sample had clinically significant depression symptoms. This low rate is fairly consistent with reports within community samples (Martin, Rief, Klaiberg, & Braehler, Reference Martin, Rief, Klaiberg and Braehler2006; Strine et al., Reference Strine, Mokdad, Balluz, Gonzalez, Crider, Berry and Kroenke2008; Vilagut, Forero, Barbaglia, & Alonso, Reference Vilagut, Forero, Barbaglia and Alonso2016). Table 3 shows the bivariate correlations between predictors. It is important to note that the psychosocial adversity measures were relatively uncorrelated with family economic condition, indicating that the family adversities captured by these measures do not reflect poverty per se.
Table 3. Bivariate correlations among key variables

Note: Ns = 259–338. SNS, sympathetic nervous system. PNS, parasympathetic nervous system. HPA, hypothalamic-pituitary-adrenal axis. *p < .05. **p < .001.
As shown in Table 2, family income also had a broad range, from families making less than $10,000 annually to those making more than $400,000. The income in this sample is fairly reflective of the region from which it was drawn, at the time it was sampled. The average family income bracket $60,000–$79,000 should be interpreted in light of the extremely high cost of living of the region from which the sample was drawn, relative to national levels. The sample demonstrated coverage in both the high poverty and high affluence ends of the spectrum (albeit skewed toward higher education and income), allowing for strong estimates of the effects of this variable on the outcomes of interest.
In total, the present sample appears well positioned to test for the BSC U-shaped curve model, providing very good coverage of both positive and negative ends of economic condition and good coverage across the distributions for the majority of the other adversity measures. At the same time, as noted above, we were unable to directly assess more positive developmental contexts, such as parental warmth and support, as such measures were not included in the PAWS. Finally, likely reflecting our community sample, the results suggest that the sample had limited coverage of extreme adversity exposures (e.g., related to high caregiver depression or frequent endorsement of high anger expression and family expressiveness). Thus, the current study was not optimally positioned to test for the full set of ACM profiles.
Validation of high and low stress reactivity groups
As a manipulation check, we initially examined whether the parameters of the autonomic nervous system and the HPA axis changed as expected (increasing or decreasing reactivity) in response to the laboratory protocol. High PNS reactivity was defined as the sample quartile displaying the strongest decrease in heart period variability from control to challenge conditions; low PNS reactivity was defined as the sample quartile displaying the strongest increase in heart period variability from control to challenge conditions. Likewise, high SNS reactivity was defined as the sample quartile displaying the greatest decrease in PEP intervals from control to challenge conditions; low SNS reactivity was defined as the sample quartile displaying the greatest increase in PEP intervals from control to challenge conditions. As shown in Table 4, each of the high reactivity groups (PNS and SNS) showed significant change from the control tasks to the challenge tasks (increasing physiological reactivity) and displayed significantly greater change than did the rest of the sample (other 75%). Likewise, each of the low reactivity groups (PNS and SNS) showed significant change from the control tasks to the challenge tasks (reducing physiological reactivity) and displayed significantly greater change than did the rest of the sample (other 75%). Finally, high HPA axis reactivity was defined as the sample quartile displaying the largest increase in cortisol concentrations from pre- to postprotocol; low HPA axis reactivity was defined as the sample quartile displaying the largest decrease in cortisol concentrations from pre- to postprotocol. As shown in Table 4, the high HPA axis reactivity group showed significant change from pre- to postprotocol (increasing physiological reactivity) and displayed significantly greater change than did the rest of the sample (other 75%). Likewise, the low HPA axis reactivity group showed significant change from pre- to postprotocol (reducing physiological reactivity) and displayed significantly greater change than did the rest of the sample (other 75%). In total, our use of 25% cutoffs captured significant within- and between-group variation in both high and low stress reactivity across the PNS, SNS, and HPA axis.
Table 4. Physiological reactivity to laboratory challenges

Note: SNS, sympathetic nervous system. PNS, parasympathetic nervous system. HPA, hypothalamic-pituitary-adrenal axis.
aSample quartile displaying longest pre-ejection period (PEP) intervals (based on reactivity scores). bSample quartile displaying shortest PEP intervals (based on reactivity scores). cSample quartile displaying highest heart period variability (based on resting sinus arrhythmia [RSA] reactivity scores). dSample quartile displaying lowest heart period variability (based on RSA reactivity scores). eSample quartile displaying lowest cortisol concentrations (based on reactivity scores). fSample quartile displaying highest cortisol concentrations (based on reactivity scores). ***p < .001.
Signal detection analyses
We conducted six sets of signal detection analyses or receiver operating characteristics (ROC) to identify a set of optimal predictor variables that best predicts high/low HPA axis, PNS, and SNS reactivity with the optimal balance between sensitivity and specificity. The first step in conducting the ROC is to define the success criterion or the “gold standard,” which is a binary outcome of interest. In the present analyses, the upper 25% of the reactivity scores distribution constituted the gold standard for high HPA axis, PNS, and SNS reactivity, whereas the bottom 25% constituted the gold standard for low HPA axis, PNS, and SNS reactivity.
The ROC software searches all the candidate predictor variables and their associated cut points with the optimal balance between sensitivity (false negatives) and specificity (false positives) by using the weighted kappa statistic (К) to identify subgroups of children with high/low reactivity (the outcomes of interest; Kraemer, Reference Kraemer1992). In the present analyses, we gave equal weight to false positives and negatives in determining optimal cut points. Once the optimal predictor variable and its associated cut points are identified, the ROC tests the association with the gold standard (binary outcome) against the stopping rules: the p value associated with the chi-square (χ2) is greater than .05; and/or when a subgroup is too small for further analysis (n < 20); and/or when no further discriminating variable is selected. If the association passes these stopping rules, the sample is then partitioned into two groups: those with the cut point value below and above of the selected predictor variable. The ROC analysis is restarted, separately for each of these two subgroups, and it examines every predictor variable and its cut point for each subject to see if either subgroup can be further separated. The procedure is reiterated until no further discriminating variable is identified at p < .05 or there are too few subjects in a subgroup to continue analysis. Due to our relatively small sample size, and the attendant risk of Type I error, we stopped the ROC analysis after two rounds of partitioning (as three rounds is equivalent to a three-way interaction, which cannot be reliably delineated in our sample size). The final result of the ROC analysis is a decision tree that depicts the combination of the predictor variables, and their associated cut points, that best predict high/low reactivity (Kraemer, Reference Kraemer1992; O'Hara et al., Reference O'Hara, Mumenthaler, Davies, Cassidy, Buffum, Namburi and Kraemer2002; Yesavage et al., Reference Yesavage, Hoblyn, Sheikh, Tinklenberg, Noda, O'Hara and Kraemer2003, Reference Yesavage, Jo, Adamson, Kennedy, Noda, Hernandez and Murphy2011). We used the publicly available software (ROC version 5.7) at https://web.stanford.edu/~yesavage/ROC.html to conduct the following analyses.
Seven candidate predictor variables were entered into the signal detection analyses. This included three demographic control variables (child's age, sex, and race [i.e., minority vs. majority racial/ethnic status]) and four theoretically specified indicators of familial/ecological conditions: family structure, family stress, restrictive parenting, and family economic condition. Family stress, restrictive parenting, and family economic condition were each standardized prior to analyses. As shown in Table 3, there was minimal collinearity between the seven predictor variables. As low/high reactivity was defined in the current analyses as the bottom/top 25% of the sample, the signal detection analyses results of interest were deviations from this 25% base rate.
HPA axis reactivity
Figure 1 demonstrates the results obtained from the signal detection analysis for prediction of high HPA axis reactivity (i.e., the quartile of sample displaying highest cortisol concentrations, based on cortisol difference scores pre- to postprotocol, residualized on time of data collection). This group of children showed an average increase from baseline of about 1 SD in salivary cortisol after completing the challenge tasks. Restrictive parenting with the cut point value of –1.156 SD was identified as the first optimal predictor variable that distinguished the heightened HPA axis reactive children from the rest of the sample (К = 0.123, χ2 = 4.87, p < .05). About 41.4% (12/29) of the children whose parents reported practicing very low levels of restrictive parenting (<–1.156 SD) demonstrated heightened HPA axis reactivity, while only 22.6% (52/230) of the children who experienced higher levels of restrictive parenting (≥–1.156 SD) than this first group displayed high HPA axis reactivity. No other discriminatory predictor was identified among the first group. However, within the second group (N = 230), restrictive parenting provided further discriminations at the cut point value of 0.071 SD (К = 0.137, χ2 = 6.70, p < .05), resulting in a U-shaped curvilinear relationship between restrictive parenting and high HPA axis reactivity. Just as children who experienced very low levels of restrictive parenting scores showed high rates of HPA axis reactivity (41.4%), children who experienced above average levels of restrictive parenting (>0.071 SD) also showed somewhat elevated rates of HPA reactivity (29.3%, 36/123). By contrast, children who experienced low to average levels of restrictive parenting (>–1.156 SD to <0.071 SD) displayed the lowest rates of high HPA reactivity (15%, 16/107).
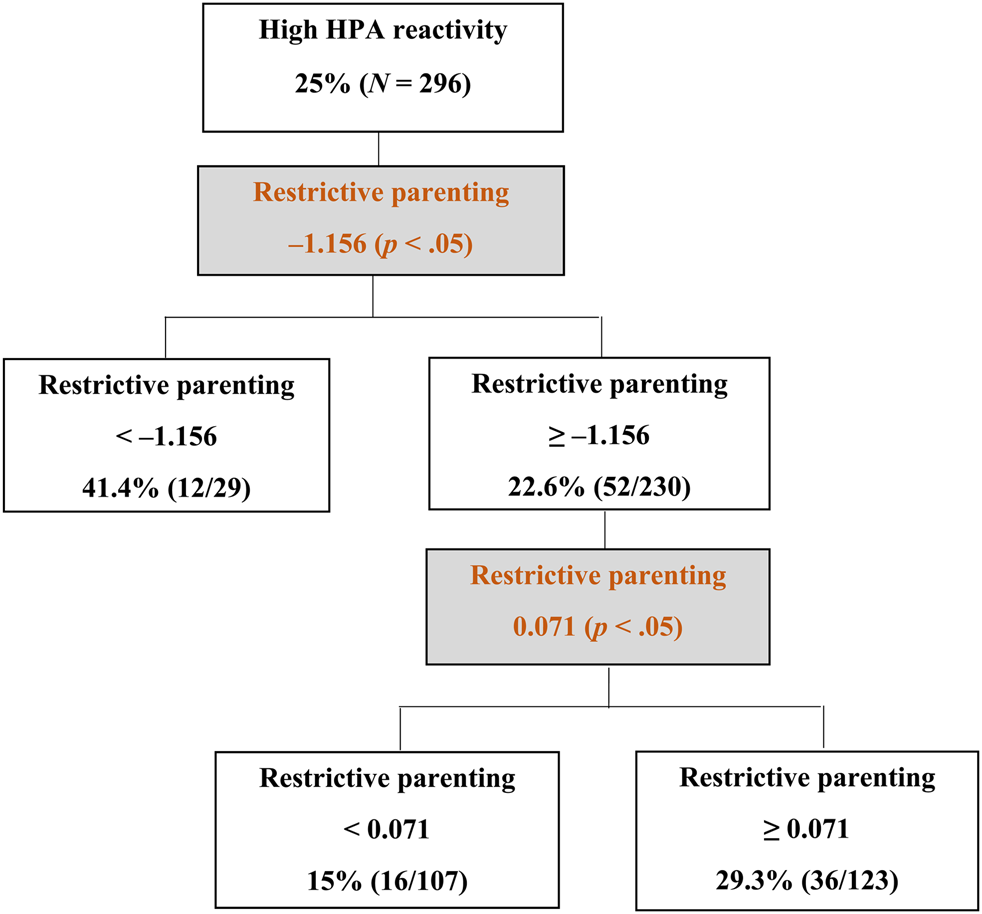
Figure 1. Decision tree obtained from the signal detection analysis of high hypothalamic–pituitary–adrenal (HPA) axis reactivity.
Figure 2 displays the results of the signal detection analysis for the predictors of low HPA axis reactivity, which we operationalized as the sample quartile displaying lowest cortisol concentrations, based on the residualized cortisol difference scores pre- to postprotocol. This group of children showed an average decrease from baseline of a little more than 1 SD in salivary cortisol after completing the challenge tasks. Age was identified as the top-order discriminating predictor variable, which divided the sample (N = 296) into two subgroups at the cut point value of 5.47 years (К = 0.148, χ2 = 6.66, p < .05), with greater age predicting higher rates of low HPA axis reactivity. Specifically, 34.4% (33/96) of children aged 5.47 or older displayed low HPA axis reactivity, in contrast to a rate of only 20.5% (41/200) among their younger counterparts. For this younger group of children (<5.47 years of age), family stress provided further discrimination at the cut point value of 1.197 SD (К = 0.194, χ2 = 7.35, p < .05). Specifically, 43% of younger children (9/21) who were exposed to very high levels of family stress (≥1.197 SD) displayed low HPA axis reactivity. By comparison, in the families of the younger children in which parents reported lower levels of family stress (<1.197 SD), only 17.4% of the children (27/155) displayed low HPA axis reactivity.

Figure 2. Decision tree obtained from the signal detection analysis of low hypothalamic–pituitary–adrenal (HPA) axis reactivity.
Taken together, the results from the signal detection analyses of high and low HPA axis reactivity are generally consistent with the BSC/ACM model. Consistent with the sensitive pattern in the BSC/ACM model, the greatest proportion of heightened HPA axis reactivity (41.4%) was observed among children who experienced very low levels of restrictive parenting (<–1.156 SD). As shown in Figure 3, the overall results for high HPA axis reactivity had the shape of a reversed J, with the children in this sensitive group representing the high left end of the reversed J. Whereas the lowest rates of high HPA axis reactivity (15%; bottom of the reversed J) were found in children who experienced low to moderate levels of restrictive parenting (>–1.156 SD to < 0.071 SD), as per the buffered pattern in the BSC/ACM model, relatively high rates of heightened HPA axis reactivity (29.3%; right side of reversed J) were found among children who experienced above average levels of restrictive parenting (≥0.071 SD), as per the vigilant pattern in the BSC/ACM model. Finally, a hyporesponsive pattern, indicated by a high proportion of children with low HPA axis reactivity (43%), was observed among younger children who experienced very high levels of family stress (≥1.197 SD), as per the unemotional pattern of the ACM. These children demonstrated a sharp decrease in cortisol following the challenge tasks.

Figure 3. Reverse J-shaped relation between restrictive parenting and heightened hypothalamic–pituitary–adrenal (HPA) reactivity. A disproportionate number of children who experienced both very low and high restrictive parenting displayed high HPA reactivity to the laboratory challenges.
To evaluate statistical significance of the curvilinear relation (reversed J) between restrictive parenting and HPA axis reactivity, we created three groups based on children's level of exposure to restrictive parenting, as defined by the cut point values that obtained through the signal detection analysis (see Figures 1 and 3). We conducted one-way ANOVAs to examine groups mean differences in HPA axis reactivity using both linear and quadratic terms. We specifically used the continuous measure of HPA axis reactivity for this analysis. The very low restrictive parenting and the high restrictive parenting groups demonstrated higher HPA axis reactivity (M reactivity = 0.25, SD = 0.79 and M reactivity = 0.11, SD = 1.13, respectively) than did the moderate restrictive parenting group (M reactivity = –0.22, SD = 0.87), linear term: unweighted F (1, 256) = 0.40, p = .52. As predicted, there was a statistically significant curvilinear relation in mean levels of HPA axis reactivity across the three groups of children, quadratic term: unweighted F (1, 256) = 8.58, p < .01.
PNS reactivity
High PNS reactivity was defined as the quartile of the sample displaying the lowest heart period variability, based on RSA difference scores from control to challenge conditions. This group of children showed an average decrease from baseline of about 2 SD in RSA after completing the challenge tasks. The signal detection analysis identified age as the sole predictor of high PNS reactivity. It particularly divided the sample (N = 326) into two subgroups at the cut point value of 5.71 years (К = 0.157, χ2 = 9.95, p < .05). Of the 37 children who aged 5.71 years or older, 17 of them (46%) showed high PNS reactivity to challenge tasks. Of the remaining 289 children who aged younger than 5.71 years old, only 64 (22.1%) were identified as high PNS reactive. The stopping rule (n < 20) went into effect, and no further discriminating predictor variable was identified for the first group (age ≥ 5.71 years). However, within the younger children, age offered further significant discrimination at the cut point of 5.15 years (К = 0.13, χ2 = 5.68, p < .05), such that 17.5% of the children (31/177) who aged between 5.15 and 5.71 years old showed high PNS reactivity phenotype. In contrast, 29.5% of the children (33/112) younger than 5.15 years old were identified as highly reactive.
These sets of result did not provide support for any patterns of reactivity in the BSC/ACM model; however, they demonstrated a curvilinear relation between age and heightened PNS reactivity. The highest proportion of high PNS reactivity (46%) was observed among older children (age ≥5.71 years). In addition, 29.5% of the children who were younger than 5.15 years of age demonstrated heightened PNS reactivity. The lowest rates of high PNS reactivity (17.5%) were also found in children who aged between 5.15 and 5.71 years old. The results of signal detection analysis for prediction of low PNS reactivity (i.e., the quartile of the sample displaying the highest heart period variability based on RSA difference scores from control to challenge conditions) did not identify any predictor variables and cut points at the significance level of p < .05.
SNS reactivity
Figure 4 displays a decision tree classifying the characteristics of children with high SNS reactivity (i.e., the quartile of the sample displaying the shortest PEP intervals based on difference scores from control to challenge conditions). This high reactivity group showed an average decrease of –1.71 SD in PEP intervals in response to the challenge tasks. Family economic condition (К = 0.125, χ2 = 4.99, p < .05) was identified as the first-order predictor variable that significantly distinguished highly reactive children from the rest of the sample. Among children from families characterized by relatively stable and better economic conditions (family economic condition ≥0.92 SD), about 38.5% (20/52) showed high SNS reactivity to laboratory challenges. By contrast, among children from families with moderate to low family economic condition scores (<0.92 SD), only 23.5% (58/247) displayed high SNS reactivity. No other significant predictor offered further discrimination within the first (high reactivity) group. However, for the latter group (family economic condition <0.92 SD), family stress (К = 0.134, χ2 = 5.48, p < .05) divided them into two subgroups at the cut point value of 1.30 SD. Of the 21 children raised in families under moderate to low family economic condition (<0.92 SD) who also experienced very high levels of family stress (≥1.30 SD), 9 of them (43%) were in the quartile that showed the shortest PEP intervals. However, rates of high SNS reactivity decreased significantly (20.5%; 43/210) in children who experienced comparable family economic condition levels (<0.92 SD) but who did not experience very high levels of family stress (<1.30 SD). Finally, no significant predictor variables and cut points were identified by the signal detection analysis in prediction of low SNS reactivity (i.e., the quartile of the sample displaying the longest PEP intervals based on difference scores from control to challenge conditions).

Figure 4. Decision tree obtained from the signal detection analysis of high sympathetic nervous system (SNS) reactivity.
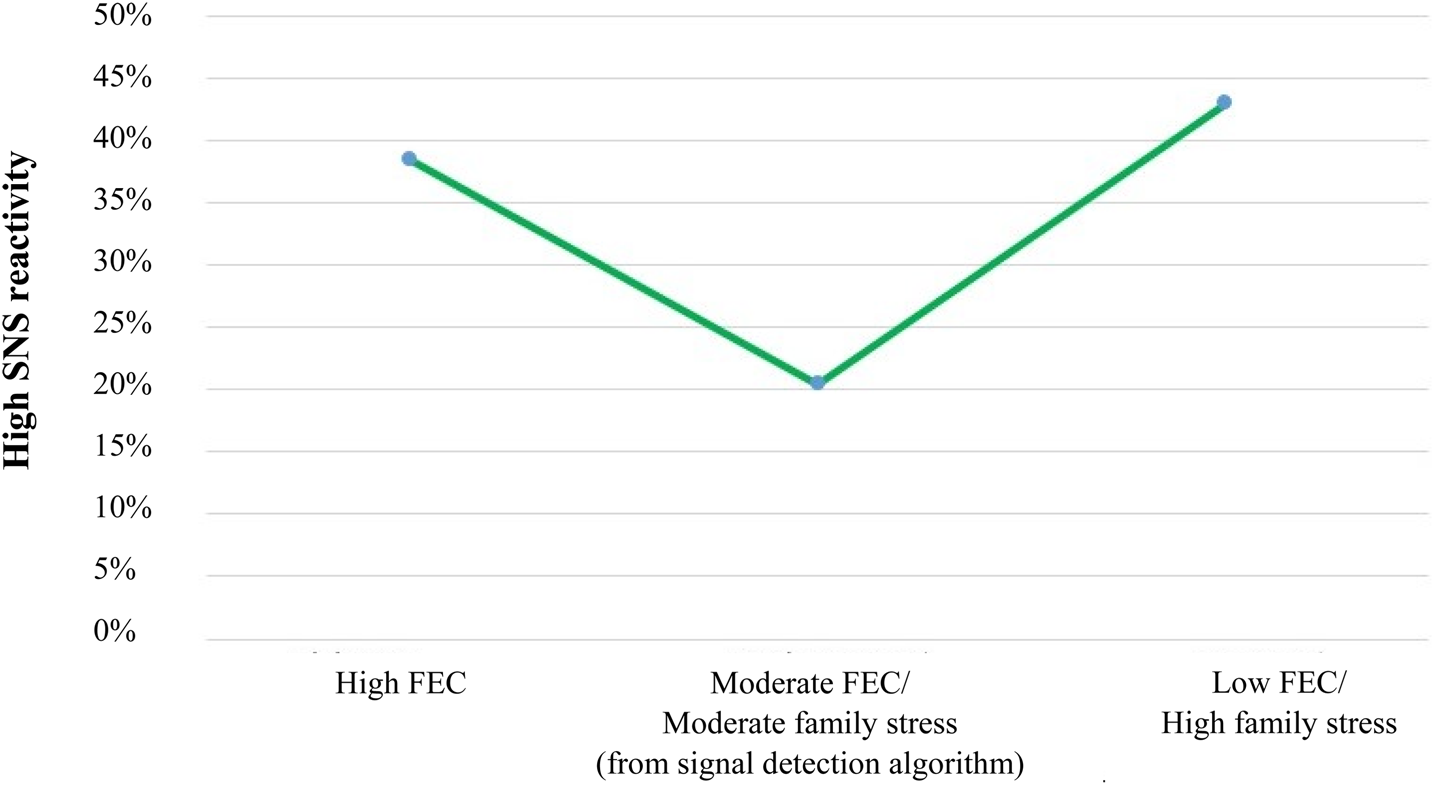
In summary, the results obtained from the signal detection analysis for the prediction of high SNS reactivity provided additional support for the two high reactivity patterns predicted by the BSC/ACM model, displaying the predicted U-shaped curvilinear relation between the family environment and heightened stress reactivity (Figure 5). Consistent with the sensitive BSC/ACM pattern, a high proportion of children with high SNS reactivity (38.5%; left side of the U-shaped curve) emerged in wealthier families with little perceived financial strain (family economic condition ≥0.92 SD). In addition, the combination of low to about average family economic condition and very high family stress levels (≥1.30 SD) also predicted high SNS reactivity (43%; right side of the U-shaped curve), as per the vigilant pattern in the BSC/ACM model. The majority of children in between these two extremes, who experienced neither especially high levels of family stress nor especially low family economic condition, experienced the lowest rates of high PEP reactivity (20.5%; bottom of the U-shaped curve), as per the buffered pattern in the BSC/ACM model. In contrast to the cortisol results, the signal detection analysis did not reveal a hyporesponsive, low SNS reactivity group.

Figure 5. U-shaped curvilinear relation between family stress/economic condition and sympathetic nervous system (SNS) reactivity. A disproportionate number of children growing up under both favorable family economic conditions (high FEC) and unfavorable family economic conditions (low FEC) together with high family stress displayed heightened sympathetic nervous system reactivity (shorter pre-ejection periods [PEP] in response to laboratory challenges).
To evaluate statistical significance of the curvilinear relation (U-shaped) between family stress/family economic condition and SNS reactivity, we created three groups based on children's level of exposure to these two variables, as defined by the cut point values obtained through the signal detection analysis (see Figures 4 and 5). We conducted one-way ANOVAs to examine groups mean differences in SNS reactivity using both linear and quadratic terms. We specifically used the continuous measure of SNS reactivity for this analysis. The groups of participants who had experienced either favorable family economic conditions or a combination of unfavorable family economic conditions and high family stress demonstrated higher SNS reactivity (M reactivity = –0.20, SD = 0.91 and M reactivity = –0.25, SD = 1.04, respectively) than did the group of participants who experienced moderate family economic conditions and family stress (M reactivity = 0.06, SD = 1.02), linear term: unweighted F (1, 280) = 0.04, p = .83. As predicted by the model, there was a statistically significant curvilinear relation in mean levels of SNS reactivity across the three groups of children, quadratic term: unweighted F (1, 280) = 3.83, p = .05.
Finally, we conducted sensitivity analyses to examine whether the hypothesized U-shaped curve would also emerge when using a 35% rather than a 25% cutoff for high reactivity. As shown in Appendix A, these analyses using a higher cutoff did not provide support for a U-shaped curve.
Discussion
Theory and past research suggest that early life experiences get under the skin and calibrate physiological parameters and developmental processes in an adaptive manner. Informed by the two evolutionary-developmental models of individual differences in stress responsivity—the BSC model (Boyce & Ellis, Reference Boyce and Ellis2005) and the ACM (Del Giudice et al., Reference Del Giudice, Ellis and Shirtcliff2011)—the primary aim of the present investigation was to identify the specific features of childhood environments that best predict high and low autonomic (i.e., SNS and PNS) and adrenocortical (HPA axis) reactivity in kindergarten children. Moreover, we attempted to conceptually replicate and extend the work of Ellis et al. (Reference Ellis, Essex and Boyce2005) in testing the BSC hypothesized U-shaped association between high versus low levels of familial and ecological adversity and the magnitude of physiological stress to laboratory challenges.
We found measured support for the BSC/ACM, though with some deviations from the expected patterns. First, as per the sensitive pattern in the BSC model, we predicted that a disproportionate number of children raised in family environments characterized by low levels of adversity would display heightened autonomic and adrenocortical reactivity to laboratory stressors. Consistent with the proposed sensitive profile, Ellis et al. (Reference Ellis, Essex and Boyce2005) observed heightened levels of SNS, blood pressure, and heart rate reactivity among children whose parents reported low major stressful life events and family stress, high family routines and social supports, and high family socioeconomic status. This kind of sensitive profile also emerged in the current signal detection analyses. Children who experienced very low levels of restrictive parenting had rates of high HPA axis reactivity (41%) that were nearly three times greater than children who experienced low to average levels of restrictive parenting (15%). Likewise, children who grew up in relatively wealthy families with little or no financial strain evinced rates of high SNS reactivity (38.5%) that were approximately two times greater than children with moderate family stress exposure and low to average family economic condition levels (20.5%).
Together, in both Ellis et al. (Reference Ellis, Essex and Boyce2005) and the current study, low childhood stress exposures predicted a disproportionate number of children with high autonomic stress reactivity, while in the current study very low levels of restrictive parenting also predicted high rates of HPA axis reactivity. Nonetheless, a limitation of the current study was that we were only able to operationalize protective family environments in terms of the relative absence of stress; we did not specifically measure positive family relationships (e.g., cohesion, predictability, or warmth). Further, in the current study, family economic condition was uncorrelated with family stress (Table 3). Thus, one must be cautious when interpreting high SNS reactivity in the context of high family economic standing as indicating a sensitive profile. Despite this caveat, BSC theory interprets heightened SNS reactivity in this context as affording increased susceptibility to the abundant resources available in wealthy families.
Second, consistent with the buffered pattern in the BSC model, we expected that childhood exposure to more normative and moderate levels of family adversity would predict relatively low physiological reactivity, and that the buffered group would comprise the largest stress responsivity profile (Del Giudice et al., Reference Del Giudice, Ellis and Shirtcliff2011). In the six signal detection analyses conducted by Ellis et al. (Reference Ellis, Essex and Boyce2005), a clear buffered profile emerged in five of them (where the group that experienced moderate levels of childhood stress displayed the lowest rates of high autonomic or adrenocortical reactivity). In four of these five signal detection analyses (heart rate, mean arterial pressure, SNS, and HPA axis reactivity), the buffered profile emerged as the single largest group. Similarly, in the present study, the lowest rates of high HPA axis reactivity (15%) were found among kindergartners who experienced low to average restrictive parenting practices (moderate-stress group). Likewise, kindergartners raised in families experiencing about average family economic condition and moderate levels of family stress (moderate-stress group) demonstrated the lowest rates of high SNS reactivity (20.5%). In the signal detection analysis of high SNS reactivity, but not high HPA axis reactivity, the buffered profile emerged as the single largest group. The emergence of this responsivity profile among children with moderate levels of adversity is in alignment with the stress inoculation hypothesis (Eysenck, Reference Eysenck and Cooper1983; Lyons & Parker, Reference Lyons and Parker2007; Rutter, Reference Rutter1987), as discussed above.
In addition, as per the vigilant pattern in the BSC model, we hypothesized that a disproportionate number of children raised under harsh/stressful family and ecological conditions would also exhibit heightened autonomic and adrenocortical reactivity to laboratory stressors. In support of this reactivity pattern, Ellis et al. (Reference Ellis, Essex and Boyce2005) documented higher rates of high SNS and cortisol reactivity among infants and preschoolers who experienced high family stress. Similarly, in the current study, higher than average levels of restrictive and controlling parenting practices predicted modestly elevated rates of HPA axis reactivity (29%). This rate was nearly two times higher than the rate demonstrated by children who experienced moderate levels of restrictive parenting (buffered; 15%). We also found that the combination of low to moderate family economic condition and very high levels of family stress uniquely predicted the highest proportions of high SNS reactivity in the sample (43%). This rate was more than twice as high as the rate shown by children with comparable family economic condition but low to moderate experiences of family stress (20.5%). Together, in both Ellis et al. (Reference Ellis, Essex and Boyce2005) and the current study, high childhood stress exposures predicted a disproportionate number of children with high autonomic stress reactivity, while in the current study, above average levels of restrictive parenting practices also predicted high rates of HPA axis reactivity.
The present study extended the work of Ellis et al. (Reference Ellis, Essex and Boyce2005) by exploring contextual and individual predictors of low physiological reactivity. Following the ACM, we expected that exposure to very high adversity early in life would be associated with blunted physiological responses to laboratory stressors, as per the unemotional pattern. Across the three subsystems of the SRS, only low HPA axis reactivity was predicted by our family environment measures. Young children (younger than 5.47 years old) who experienced very high levels of family stress (≥1.197 SD) exhibited significant decreases in salivary cortisol concentrations from before to after the laboratory stress protocol. This finding should be interpreted with caution, however, due to the young age and relatively low-risk characteristics of our community sample, as well as the small number of children (9 individuals, as shown in Figure 2) who appeared to fit the unemotional profile. Further, this subset of children may have had anticipatory anxiety to the examiner (high preprotocol cortisol concentrations, as shown in Table 4), but found the challenges not stressful relative to their fear of the laboratory procedure, so calmed down. Reductions in autonomic or adrenocortical activation in response to laboratory challenges have been observed in a subset of participants in past studies (e.g., Ellis et al., Reference Ellis, Oldehinkel and Nederhof2017; El-Sheikh & Erath, Reference El-Sheikh and Erath2011; Obradović et al. (Reference Obradović, Bush, Stamperdahl, Adler and Boyce2010) and interpreted as indicative of disengagement from the demands of the challenge tasks (as theorized by the ACM). Although this explanation converges with the notion of an unemotional pattern, our data may be more consistent with the anticipatory anxiety explanation.
According to the ACM, the four stress responsivity patterns are not fixed and may change (i.e., shift from one pattern to another) over the course of development and as a result of stress exposures (Del Giudice et al., Reference Del Giudice, Ellis and Shirtcliff2011). For instance, following high, chronic stress exposure, during juvenility or later with the onset of puberty, a proportion of highly responsive children displaying the vigilant pattern may become less responsive and shift toward the unemotional pattern (reviewed in Ellis & Del Giudice, Reference Ellis and Del Giudice2019). Considering these developmental transitions and the young age of our sample, it is likely that a proportion of children in the current study identified as vigilant will transition to an unemotional profile in middle childhood or adolescence.
Contrary to our expectations and past research showing links between early rearing conditions and PNS responsivity (e.g., Beauchaine, Reference Beauchaine2001; Conradt et al., Reference Conradt, Abar, Sheinkopf, Lester, Lagasse, Seifer and Hinckley2014, Reference Conradt, Beauchaine, Abar, Lester, Lagasse, Shankaran and Hammond2016; El-Sheikh & Hinnant, Reference El-Sheikh and Hinnant2011; Hinnant, Erath, & El-sheikh, Reference Hinnant, Erath and El-Sheikh2015), neither Ellis et al. (Reference Ellis, Essex and Boyce2005) nor the current signal detection analyses identified any discriminating family or contextual predictors of PNS reactivity. Instead, in the current analyses, we identified age as the sole significant predictor that distinguished highly PNS reactive children from their less reactive counterparts, with high rates of PNS reactivity emerging especially among older children (46%; ≥5.71 years of age). This finding concurs with past research showing that, among healthy and normally developing individuals, RSA increases linearly with age from preschool to adolescence (Beauchaine, Reference Beauchaine2001; Bornstein & Suess, Reference Bornstein and Suess2000; Calkins & Keane, Reference Calkins and Keane2004; Conradt et al., Reference Conradt, Abar, Sheinkopf, Lester, Lagasse, Seifer and Hinckley2014) and then decreases after young adulthood (Shader et al., Reference Shader, Gatzke-Kopp, Crowell, Reid, Thayer, Vasey and Beauchaine2018). Our youngest children (< 5.15 years of age) also showed somewhat elevated rates of PNS reactivity (29.5%). These younger children had likely been in kindergarten for only a short period of time (the data collection occurred in the Fall); thus, the high rates of PNS reactivity in this group may reflect the challenges of negotiating the transition to elementary school for these younger aged kindergarteners.
The null results for PNS reactivity regarding family environmental factors may be usefully considered in light of controversies regarding measurement of PNS reactivity. Some laboratories have operationalized PNS reactivity in terms of vagal withdrawal (e.g., Bush, Alkon, et al., Reference Bush, Alkon, Obradović, Stamperdahl and Boyce2011; Fox, Hammond, & Mezulis, Reference Fox, Hammond and Mezulis2018; Obradović et al., Reference Obradović, Bush, Stamperdahl, Adler and Boyce2010), while other laboratories have operationalized PNS reactivity in terms of any change from baseline (withdrawal or augmentation; Beauchaine, Gatz-Kopp, & Mead, Reference Beauchaine, Gatzke-Kopp and Mead2007; El-Sheikh et al., Reference El-Sheikh, Kouros, Erath, Cummings, Keller and Staton2009; Kuhn, Ahles, Aldrich, Wielgus, & Mezulis, Reference Kuhn, Ahles, Aldrich, Wielgus and Mezulis2018; Zhang, Fagan, & Gao, Reference Zhang, Fagan and Gao2017). The current signal detection analyses employed both vagal withdrawal (conceptualized here as high PNS reactivity) and vagal augmentation (conceptualized here as low PNS reactivity) as dependent variables. Regardless of how these physiological constructs are conceptualized, neither vagal augmentation nor vagal withdrawal were predicted by family environmental factors (beyond the effects of age) in the current research. Thus, these different approaches to operationalizing/defining PNS reactivity did not affect findings in the current study. Nonetheless, our data analytic approach could be considered highly conservative because we included demographic control variables in the main analyses, thus giving equal weight to such broad scale maturational and biological processes as age and sex as to more subtle variations in stress exposures. This may have limited our ability to detect the effects of our family environment measures on PNS reactivity.
Evidence for curvilinear associations between early adversity and stress responsivity
When the findings for the three BSC patterns of physiological responsivity (sensitive, buffered, and vigilant) were considered together, the general picture that emerged was nonlinear, curvilinear relations between key indices of family adversity (restrictive parenting, family stress, and family economic condition) and children's heightened HPA axis and SNS reactivity (Figures 3 and 5). The statistical significance of these curvilinear relations was supported through follow-up ANOVAs with quadratic terms. The signal detection analyses of high SNS reactivity closely paralleled Ellis et al. (Reference Ellis, Essex and Boyce2005). Within both studies, the low and high adversity groups demonstrated the highest SNS reactivity rates, as per the U-shaped curve hypothesized in the BSC model. Further, the lowest proportion of high SNS reactivity emerged among the group of children who were exposed to average levels of adversity. These findings further converge with those from other research testing the BSC/ACM model showing two heightened autonomic reactivity profiles, with one profile emerging under relatively stable/supportive conditions and the other under more harsh/coercive conditions (Del Giudice et al., Reference Del Giudice, Hinnant, Ellis and El-Sheikh2012; Ellis et al., Reference Ellis, Oldehinkel and Nederhof2017).
However, in the Wisconsin Study of Families and Work (WSFW) reported in Ellis et al. (Reference Ellis, Essex and Boyce2005), no evidence of a curvilinear relation emerged between children's varying levels of family stress/support and high HPA axis reactivity. Their cortisol findings only supported the BSC vigilant pattern and not the sensitive pattern. Comparing the demographics of the two samples, the PAWS sample was more racially and socioeconomically diverse than the WSFW sample. In addition, PAWS had more than double the sample size of WSFW (N = 338 vs. N =122). These factors together may explain why the PAWS sample was able to capture a sensitive profile based on HPA axis reactivity. The curvilinear association documented in PAWS between exposures to family adversity and HPA axis reactivity converges with past research (Gunnar et al., Reference Gunnar, Frenn, Wewerka and Van Ryzin2009; Hagan et al., Reference Hagan, Roubinov, Purdom Marreiro and Luecken2014; Ouellet-Morin et al., Reference Ouellet-Morin, Robitaille, Langevin, Cantave, Brendgen and Lupien2018), which also has documented heightened HPA axis responsivity under both relatively supportive and stressful rearing conditions.
At the same, in the sensitivity analyses reported in Appendix A, the hypothesized U-shaped curve was not supported when using a 35% cutoff for high reactivity. The original BSC theory delineated high reactivity as the top 20% of the population (Boyce & Ellis, Reference Boyce and Ellis2005). The sensitivity analyses suggest that the model may not work when expanded beyond the smaller group of individuals who display high stress reactivity (e.g., top 20%–25% of the population) to include the larger group of individuals who are essentially above average in stress reactivity (e.g., top 35% of the population).
Elaborating the U-shaped curve
Central to the evolutionary-developmental BSC model is the assumption that the magnitude of physiological responses to psychosocial challenges mediates the organism's developmental sensitivity or openness to environmental influences. Boyce and Ellis (Reference Boyce and Ellis2005) metaphorically referred to children displaying high stress responsivity (i.e., high BSC) as “orchids” to signify their greater susceptibility to both positive and negative aspects of the environment. Conversely, children scoring lower on stress reactivity were designated as “dandelion children,” reflecting their relative ability to function adequately across a wide range of species-typical conditions. BSC theory suggests that the very characteristics that are often thought of as children's frailties (e.g., high stress reactivity typical of orchid children) can also be their strengths, given the right context (Boyce & Ellis, Reference Boyce and Ellis2005; see also Belsky & Pluess, Reference Belsky and Pluess2009).
According to BSC theory, the U-shaped curve reflects developmental programming in orchids to adaptively match both safe/supportive and harsh/unpredictable contexts. However, how are these different profiles actually expressed? As per the vigilant profile, a substantial body of research suggests that heightened activation of the HPA axis and/or autonomic nervous system is associated with attentional bias toward negative stimuli, heightened physiological responsivity to negative or threatening stimuli, and increased activation of the amygdala in response to aversive stimuli such as angry faces (e.g., Henckens, van Winen, Joëls, & Fernández, Reference Henckens, van Wingen, Joëls and Fernández2012; Kukolja et al., Reference Kukolja, Schläpfer, Keysers, Klingmüller, Maier, Fink and Hurlemann2008; Ursache & Blair, Reference Ursache and Blair2015; van Honk et al., Reference van Honk, Tuiten, van den Hout, Koppeschaar, Thijssen, de Haan and Verbaten2000). Although excessive stress responsivity increases the risk for mental and physical health problems (e.g., Juster, McEwen, & Lupien, Reference Juster, McEwen and Lupien2010; Juster et al., Reference Juster, Sindi, Marin, Perna, Hashemi, Pruessner and Lupien2011), these costs may be counterbalanced under harsh/unpredictable conditions by enhanced detection and monitoring of environmental challenges and threats (Del Giudice et al., Reference Del Giudice, Ellis and Shirtcliff2011; Ellis & Del Giudice, Reference Ellis and Del Giudice2014).
Complementing this research on enhanced negative attentional bias and reactivity to threat, an emerging literature suggests that heightened stress responsivity may also amplify sensitivity to and engagement with positive and supportive features of the environment. The HPA axis responds to novelties and positive social opportunities (e.g., unexpected or exciting rewards, such as potential mating opportunities; López, Hay, & Conklin, Reference López, Hay and Conklin2009; Roney, Lukaszewski, & Simmons, Reference Roney, Lukaszewski and Simmons2007), activities that induce excitement and involve some degree of uncontrollability (e.g., sports team competitions or video contests; Bateup, Booth, Shirtcliff, & Granger, Reference Bateup, Booth, Shirtcliff and Granger2002; Chatterton, Vogelsong, Lu, & Hudgens, Reference Chatterton, Vogelsong, Lu and Hudgens1997; Mazur, Susman, & Edelbrock, Reference Mazur, Susman and Edelbrock1997), and social media involvement (e.g., number of Facebook friends; Morin-Major et al., Reference Morin-Major, Marin, Durand, Wan, Juster and Lupien2016). In a naturalistic study on a Caribbean island, Flinn, Nepomnaschy, Muehlenbein, and Ponzi (Reference Flinn, Nepomnaschy, Muehlenbein and Ponzi2011) documented significantly elevated cortisol levels among children during the 2 days prior to Christmas, compared with a control period, but only among children who had high expectations for presents or other exciting activities. This enhanced sensitivity to positive features of the environment has also been demonstrated in intervention research: analysis of a longitudinal evaluation of a clinical intervention (involving parent management training and cognitive behavior therapy) for school-aged boys with disruptive behavior disorder found that only those with high cortisol reactivity prior to treatment showed decreases in parent-rated aggression and oppositional behavior after treatment (van de Wiel, van Goozen, Matthys, Snoek, & Van Engeland, Reference van de Wiel, Van Goozen, Matthys, Snoek and Van Engeland2004).
Taken together, this literature nicely extends the central BSC hypothesis tested in this research. On the left side of the U-shaped curve, children growing up in highly stable and supportive environments develop or maintain heightened stress responsivity, which may amplify sensitivity to the social opportunities and resources available in that more favorable context, including interventions that enhance positive contexts and supports. On the right side of the U-shaped curve, children growing in dangerous or unpredictable contexts also develop or maintain heightened stress responsivity, which may enhance their ability to anticipate and cope with threats in their physical and social environment. In total, the hypothesized U-shaped curve posits that there are two kinds of orchid children—sensitive and vigilant—with each kind developmentally programmed to succeed (i.e., achieve relatively high fitness) in their respective environments.
Strengths, limitations, and future directions
An important strength and limitation of the current research was the use of signal detection analysis. Signal detection analyses are well positioned to examine how multiple dimensions of early rearing environments interact to predict patterns of stress reactivity. For example, the signal detection algorithm identified a combination of low to moderate family economic condition and high family stress as the best contextual predictors of children's high SNS reactivity. Nevertheless, signal detection analysis is a form of data mining that could generate false positives results. The current signal detection analyses employed multiple independent and dependent variables, which were tested in relation to both high and low stress responsivity. With so many analyses conducted, there was a high probability that at least some of the predictor variables would discriminate between higher and lower reactivity groups on some of the dependent variables at least some of the time. Given this risk of false positives, replication becomes critical. The convergence between Ellis et al. (Reference Ellis, Essex and Boyce2005) and the current set of results runs counter to the notion that the signal detection analyses generated chance findings. Furthermore, any chance findings are just as likely to operate against the theory as for it, for example, producing an inverted U-shaped curve. That did not happen in any case.
One strength of the current research was the sample and research design: we conducted a broad assessment of the family environment (capturing familial and ecological stressors that were both more distal and proximal to the child) and a multimodal assessment of child stress physiology (SNS, PNS, and HPA axis) that composited scores across multiple challenge domains (social, cognitive, sensory, and emotional) in a large and ethnically diverse sample of kindergarteners. Nevertheless, it could be valuable in future research to extend the current work by also testing for the effects of specific dimensions of environmental risk (e.g., threat vs. deprivation) in relation to domain-specific stress reactivity hypotheses (e.g., are there different psychosocial pathways to high emotional versus sensory stress reactivity; see Obradović, Bush, & Boyce, Reference Obradović, Bush and Boyce2011, for an example of such an approach).
A limitation of the current research is that many children in the study were raised in families with relatively high socioeconomic status and most did not report high levels of familial and ecological stress, at least of the kind assessed. The sample's low representation at the stressful end of early life experiences and our lack of data on traumatic exposures for children reduced our power to adequately test for the ACM four patterns of responsivity, specifically the unemotional responsivity pattern, which is theorized to emerge under conditions of very high adversity. That said, it is difficult for any one sample to contain the full range of variation in predictors and outcomes required to test comprehensive theories of development (see Bush & Boyce, Reference Bush, Boyce and Cicchetti2016, for discussion). Our sample did demonstrate a broad range of scores across a variety of adversities and stress physiology systems, allowing for a good test of the BSC U-shaped curve model.
Another limitation of the current research was that it was not genetically informative. Gene–environment correlations could potentially account for the covariation between stress reactivity and early rearing environments. Finally, the current research was cross-sectional and could not test for developmental change in trajectories of stress reactivity. Both BSC theory and the ACM are developmental programming models focusing on how different patterns of stress reactivity emerge over time in different contexts. The field could benefit greatly from future longitudinal research designs with repeated measures of stress physiology in infancy, childhood, and adolescence. This would enable researchers to test whether neurobiological susceptibility to environmental influences changes over time, and particularly whether there are sensitive periods or switch points in development of BSC. Such knowledge would be especially valuable for intervention purposes.
Conclusion
The present investigation replicated and extended past research findings and offered support for the BSC/ACM proposed nonlinear, curvilinear association between childhood adversity and stress responsivity. Moreover, our findings underscore the significance of early life experiences in programming the parameters of the SRS and the development of adaptive stress responsivity patterns across SRS subsystems. Through conducting signal detection analyses, we were able to identify levels and types of early adversity, both singly and interactively, that predicted the development of low and high levels of physiological stress reactivity.
Our review of the literature on links between childhood experiences and SRS functioning revealed disparate and conflicted findings across studies that mostly reflected an empirical strategy of testing for linear associations. Consistent with this literature, the results of the signal detection analyses in the current study demonstrated that early life experiences can either upregulate or downregulate stress responses, depending on the levels and types of adversity that children encounter within the family. Our results further suggest that the complex and opposing findings of the past research are plausible and could be explained in relation to capturing different portions of the BSC U-shaped curve.
Boyce and Ellis (Reference Boyce and Ellis2005) proposed that heightened stress reactivity—a neuroendocrine predisposition toward exaggerated responsiveness to environmental stressors—is more usefully conceptualized as BSC, a susceptibility to environmental influence with bidirectional effects on adaptation and health. Such susceptibility, they claim, is produced by underlying psychobiological mechanisms that arose through natural selection, because they reliably increased the individual's capacity and tendency to survive—and ultimately reproduce—in developmental environments characterized by high levels of either adversity or support. The research presented here is generally consistent with this claim. At the same time, the exploratory nature of the current study, methodological limitations, and some deviations from expected patterns of findings call for further research.
Supplementary material
The supplementary material for this article can be found at https://doi.org/10.1017/S0954579419000518.
Financial support
This research was supported by the National Institute of Mental Health Grant R01 MH62320. We are thankful to Elisabeth Conradt and K. Lee Raby for comments on an earlier draft of this paper.