


Zeolites are Al-silicate minerals with a three-dimensional framework structure of tetrahedral units that have abundant micropores of molecular dimensions. The zeolites are widely used as catalysts, ion exchangers and molecular sieves in the petrochemical industry and as adsorbents in separation and pollutant purification owing to their channel structure and remarkable adsorption performance (Chen et al., Reference Chen and Garwood1986; Sang et al., Reference Sang and Li2019; Chen et al., Reference Chen, Han, Zhang and Cui2020; Qiu et al., Reference Qiu, Jiang, Lu, Yan, Li, Zhao and Lu2020).
NaY zeolite is the most significant, mass-produced zeolite that can be prepared using a conventional gel synthesis method or in situ crystallization. In the latter technique, the NaY zeolite is crystallized into/onto clay matrices, which enhances their thermostability (Harding et al., Reference Harding, Peters and Nee2001; Wang et al., Reference Wang, Shen and Gao2007; Xiong et al., Reference Xiong, Lu, Wang and Gao2015; Zhang et al., Reference Zhang, Kang, Han, Wang, Chen and Gong2019).
Kaolin is a clay composed mainly of the mineral kaolinite with a chemical composition of Al2Si2O5(OH)4. Kaolinite has a layered structure consisting of layers bound by hydrogen bonds (Cheng et al., Reference Cheng, Liu, Cui, Zhang, Zhang and Frost2012; Castrillo et al., Reference Castrillo, Olmos and González-Benito2015). Kaolinite can directly intercalate various organic molecules such as dimethyl sulfoxide (DMSO), urea, potassium acetate, formamide, N-methylformamide, ammonium acetate, etc. (Ledoux & White., Reference Ledoux and White1966; Olejnik et al., Reference Olejnik, Aylmore, Posner and Quirk1968; Adams, Reference Adams1978; Tsunematsu & Tateyama, Reference Tsunematsu and Tateyama1999; Cheng et al., Reference Cheng, Liu, Yang, Du and Frost2010; Makó et al., Reference Makó, Kovács, Ható, Zsirka and Kristóf2014; Kovács & Makó, Reference Kovács and Makó2016). Kaolinite intercalation composites not only have unique adsorption, dispersion, rheology, porosity and surface acidity, but also possess the functional groups and reaction activities of organic compounds. These composites have attracted the attention of researchers, such that the formation, structure and properties of kaolinite/organic intercalation composites have been widely investigated and discussed (Frost et al., Reference Frost, Kristof and Paroz1998; Kuroda et al., Reference Kuroda, Hiraguri, Komori, Sugahara, Kuroda and Komori1999; Itagaki et al., Reference Itagaki, Komori, Sugahara and Kuroda2001; Matsumura et al., Reference Matsumura, Komori, Itagaki, Sugahara and Kuroda2001; Valaskova et al., Reference Valaskova, Rieder, Matejka, Capkova and Sliva2006; Matusik & Kłapyta, Reference Matusik and Kłapyta2013; Cheng et al., Reference Cheng, Hou, Liu, Li and Frost2015, Reference Cheng, Liu, Xu and Hao2018; Makó et al., Reference Makó, Kovács, Katona and Kristóf2016; Li et al., Reference Li, Cui, Wang, Wang, Li, Liu and Komareni2017; Kristóf et al., Reference Kristóf, Sarkadi, Ható and Rutkai2018).
In this work, we combine the in situ crystallization approach with kaolin intercalation. In this manner, NaY zeolite/kaolin composites with a zeolite content >40% could be obtained that utilize the functional groups and reaction activities of organic compounds.
Therefore, this work has focused on NaY molecular sieve synthesis using an in situ crystallization technique with kaolin/DMSO intercalation composites. The kaolin/DMSO intercalation composites was prepared using the direct intercalation method. The effects of the intercalation ratios and the amounts of added kaolin/DMSO intercalation composite on the synthesis of NaY zeolite molecular sieves were investigated.
Experimental
Raw materials
The materials used for the synthesis of the NaY zeolite were kaolin (China Kaolin Company), DMSO (Tianjin Komeo Chemical Reagent Co. Ltd, AR), water glass (Changsha Wanfang Chemical Co. Ltd, W SiO2 = 20.9%, W NaO2 = 6.8%), sodium hydroxide (Tianjin Chemical Reagent Factory, reagent purity ≥98%, AR) and sulfuric acid (Tianjin Chemical Reagent Factory, reagent purity ≥98%, AR).
Preparation of the kaolin/DMSO intercalation composite
The DMSO was mixed evenly with kaolin at a W DMSO:W kaolin ratio of 1:8 under stirring. The kaolin/DMSO intercalation composite was obtained by filtration, washing and drying after heating at 70°C for 24 h (sample denoted as KDM). The intercalation ratios of the samples were calculated using X-ray diffraction (XRD) according to the formula:
 $$Q = I_{{\rm i}( 001) }/( I_{{\rm k}( 001) } + I_{{\rm i}( 001) }) $$
in which Q is the intercalation ratio and I i(001) and I k(001) are the intensities of the (001) peak of kaolinite after intercalation and of the non-intercalated kaolin, respectively.
De-intercalation of the kaolin/DMSO intercalation composite
The de-intercalation reaction of the above intercalation composites was carried out after calcination at 40, 50, 60, 70, 80, 90, 100, 110, 120, 130, 140, 150, 160, 170, 180, 190 and 200°C for 2 h.
Synthesis of NaY zeolite molecular sieves using in situ technology
Kaolin, sodium silicate and distilled water were mixed thoroughly and sprayed, acquiring microspheres with average particle sizes of ~75 μm in diameter. The microspheres were calcined at 950–980°C for 2–3 h and at 700–800°C for 2–3 h. The calcined microspheres were mixed with sodium silicate, sodium hydroxide, zeolite initiator and distilled water and the mixture was heated at 95–98°C for 24–30 h to synthesize the composite. After the synthesis, the composite was washed, filtered and dried (sample denoted as R-NaY).
Synthesis of NaY zeolite molecular sieves by introducing KDM
The synthesis of NaY zeolite in this set of experiments followed the experimental procedure given in the previous section except for the use of KDM formed by intercalation of DMSO with kaolin. The amounts of added KDM were 1.0%, 2.5%, 5.0%, 10.0%, 15.0%, 20.0% and 25.0%, with the percentage referring to the KDM:calcined microspheres ratio. The NaY molecular sieves synthesized by introducing KDM was denoted as D-NaY.
Characterization of the synthesis products
XRD analysis
The crystallinity and crystal shape of the NaY zeolites were recorded on a Rigaku Ultimi IV diffractometer using Cu-Kα radiation (λ = 1.54056 Ǻ, 40 kV, 30 mA) with a scanned speed of 0.2° min–1. The crystallinity of reference NaY zeolite was equal to 93.1% and was denoted as S-NaY. The crystallinity of NaY zeolite was estimated according to the following equation:
 $$\eqalign{{\rm crystallinity}\,\,( \% ) &= ( {{\rm peak}\,{\rm height}\,{\rm at}\,22.0{\hbox-} 24.5^\circ 2\theta \,( {{\rm product}} ) }/\cr &\quad \ { {\rm peak}\,{\rm height}\, {\rm at} \,22.0{\hbox-} 24.5^\circ 2\theta \, ( {{\rm reference}} ) } ) \times 100}$$
N2 adsorption–desorption analysis
The specific surface areas, pore volumes and pore-size distributions were measured on an ASAP 2020 sorptometer (Micromeritics, USA) using adsorption and desorption isotherms collected at 77 K. Prior to the measurement, the samples were degassed at 373 K for 12 h. The specific surface areas were calculated using the Brunauer–Emmett–Teller (BET) method. The micropore volumes and external surface areas of the zeolite samples were calculated using the t-plot method. The pore parameters, mesopore surfaces and mesopore volumes were calculated from the desorption branches of these isotherms using the Barrett–Joyner–Halenda (BJH) method.
Fourier-transform infrared analysis
The Fourier-transform infrared (FTIR) spectra of the zeolite samples were recorded on a Thermo-Nicolet AVATAR 370 FTIR spectrometer.
Scanning electron microscopy analysis
The morphologies and sizes of the NaY zeolite crystals were determined using scanning electron microscopy (SEM; JEOL JSM-6360 microscope) after coating the samples with an Au evaporated film.
Results and discussion
Characterization of the intercalation composites
XRD analysis
The XRD traces of raw kaolin and kaolin/DMSO composites with various intercalation ratios are shown in Fig. 1. The 001 diffraction maximum of kaolinite at 2θ = 12.4° (0.72 nm) is displaced to 2θ = 8.16° (1.13 nm) in kaolin/DMSO intercalation composites (Fig. 1). In addition, progressive intercalation by DMSO decreased the intensity of the (001) peak at 2θ = 12.4° significantly, and the intensity of peak at 2θ = 8.16° increased gradually, suggesting that the intercalation of DMSO molecules in the kaolinite increased the distance between the kaolinite layers. This indicates that the periodic array of Al–O octahedra and Si–O tetrahedra along the c-axis was disrupted (Li et al., Reference Li, Zhang and Xu2007). The existence of the (001) peak at 0.72 nm indicates that intercalation of DMSO was not complete.
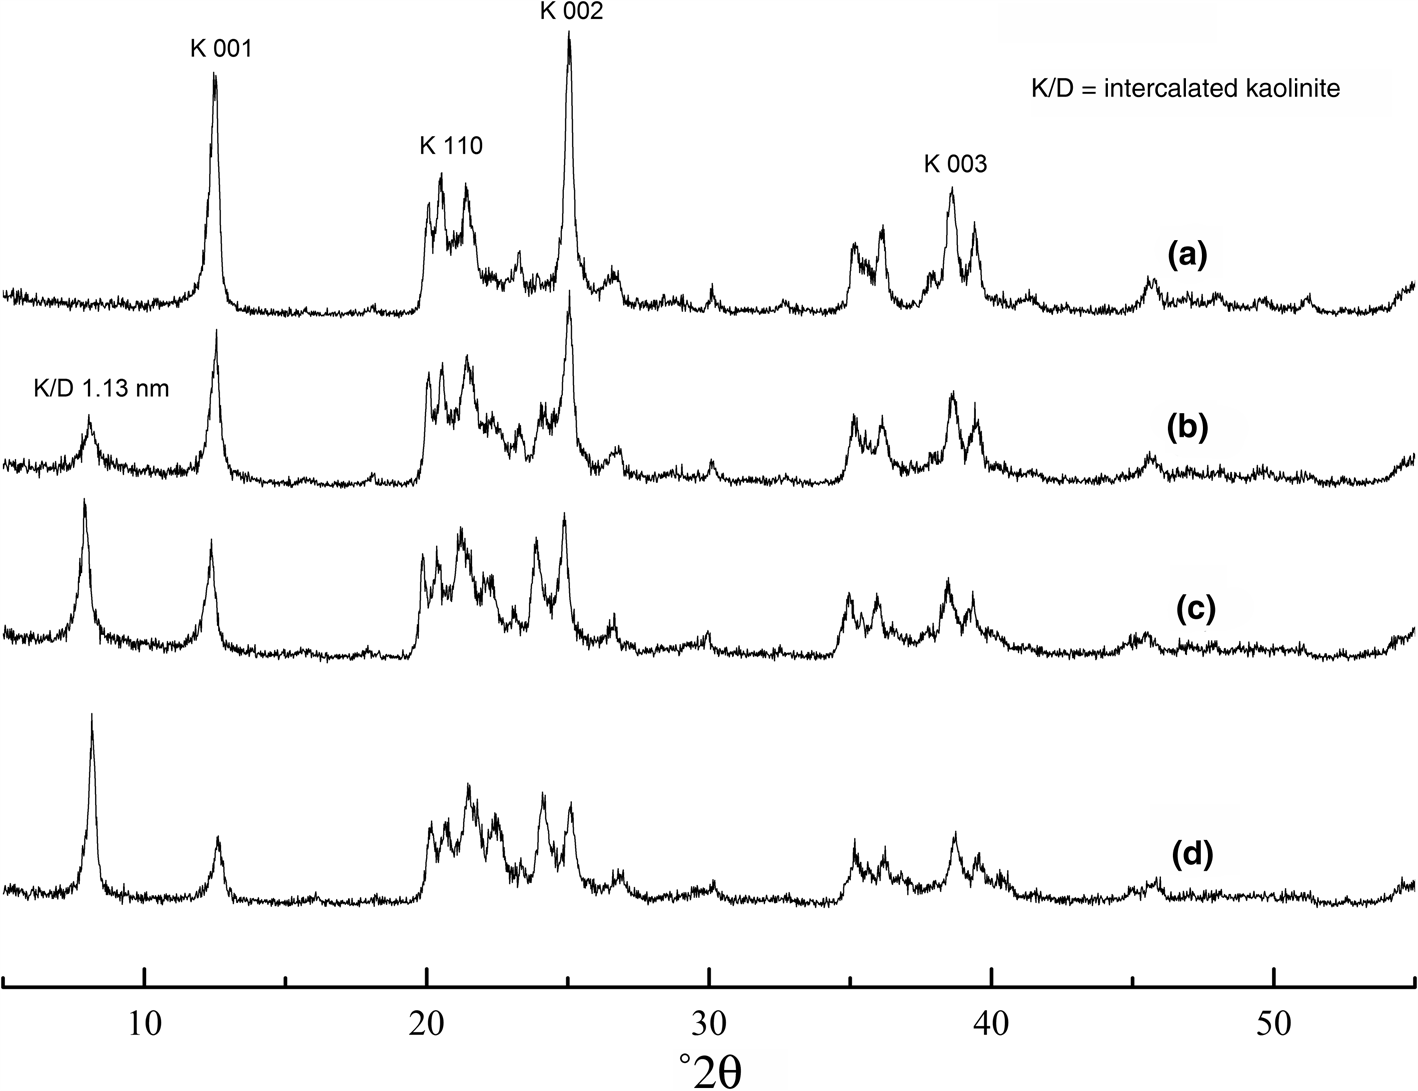
Fig. 1. XRD traces of samples with various intercalation ratios of (a) kaolin; (b) kaolin/DMSO, ratio 22%; (c) kaolin/DMSO, ratio 55%; and (d) kaolinite/DMSO, ratio 84%.
FTIR spectroscopy
Figure 2 shows the FTIR spectra of kaolin and KDM. The DMSO molecules have been intercalated into the kaolinite layers. Due to the chemical bond between kaolinite and DMSO, the position and intensity of the infrared absorption bands of the intercalation composites were affected. The 1043.21 cm–1 band due to Si–O stretching shifted to 1027.97 cm–1. In addition, after intercalation, DMSO molecules entered the kaolinite layers, the bands at 758 and 694 cm–1 shifted to 749 and 689 cm–1 and their intensities slightly decreased. In contrast, the position and intensity of the OH stretching band of internal hydroxyls at 3620 cm–1 remained essentially unaffected.

Fig. 2. FTIR spectra of (a) KDM and (b) kaolin.
SEM spectroscopy
Figure 3 shows the SEM micrographs of kaolin and KDM. Compared with kaolin, the particle size of KDM showed distinct changes. After intercalation, the particles became smaller and the amount of fine particles increased, which was advantageous to the dispersion. In addition, the pH value of kaolin slurry changed from slightly acidic (6.12) in the original kaolin to slightly alkaline (7.68) in the kaolin/DMSO composite, leading to the increase of the solid content of kaolin particles with increasing pH value. Therefore, after intercalation, the dispersion of kaolin particles was improved, the viscosity of slurry decreased and the negative charges increased.

Fig. 3. SEM images of (a) KDM and (b) kaolin.
Pore structure
Figure 4 shows the N2 adsorption–desorption isotherms and the pore-size distributions of kaolin and KDM. KDM showed a typical type IV adsorption–desorption isotherm. The hysteresis loop that occurred in the partial pressure range 0.80 < P/P 0 < 1.0 was ascribed to the presence of mesopores and macropores. The hysteresis loop was of H3 hysteresis type, indicating that the material formed slit-shaped pores with the loose accumulation of platy particles. The pore-size distribution of KDM showed maxima at ~2.4, 3.2, 4.0 and 30.0 nm, while the pore-size distribution of kaolin showed maxima at ~4.0, 15.0 and 30.0 nm. These pore sizes indicate the existence of mesopores.

Fig. 4. N2 adsorption–desorption isotherms and pore-size distributions of (a) kaolin and (b) KDM.
De-intercalation behaviour of the intercalation composite
During the synthesis of the NaY zeolite molecular sieve, the reaction temperature of the system was ~100°C, and the intercalation composite was modified at this temperature. Figure 5 shows the de-intercalation behaviour of the intercalation composites with various intercalation ratios obtained at various temperatures. The de-intercalation behaviour of the KDM intercalation composite at various intercalation ratios essentially did not change. At temperatures <80°C, there was no obvious change in the intercalation ratio of the composites, indicating a lack of de-intercalation. In the composite with an 84% intercalation ratio, the onset of de-intercalation occurred at temperatures >80°C. In addition, the lower the intercalation ratio, the higher the de-intercalation temperature. Hence, in composites with 22% and 55% intercalation ratios, de-intercalation began at ~100°C. When the temperature was increased to 160°C, samples with an intercalation ratio of 25% were completely de-intercalated. The remaining KDM composites were completely de-intercalated at 170°C.

Fig. 5. The de-intercalation behaviour of KDM with various intercalation ratios of (a) 22%, (b) 55% and (c) 84%.
Properties of the synthesized NaY zeolite
XRD analysis
Figures 6–8 show the effects of various amounts of the added KDM intercalation composite with various intercalation ratios on the synthesis of NaY zeolite. The use of intercalation composites with various intercalation ratios clearly affected the NaY zeolite synthesis. The crystallinity of the NaY zeolite increased first and decreased thereafter with an increased amounts of added KDM. At an 84% intercalation ratio and 2.5 wt.% amount of added KDM, the crystallinity of the NaY zeolite was ay a maximum, reaching ~45%. The onset of the de-intercalation of KDM at an intercalation ratio of 84% occurred at ~80°C. As the synthesis temperature was ~100°C, the intercalation composite continued to be de-intercalated, consuming the heat energy of the system. Therefore, at this reaction temperature and reaction time, the KDM with higher intercalation ratios inhibited the synthesis of NaY zeolite. For intercalation ratios of 55% and 22% and amounts of added KDM at 15%, the crystallinities of NaY zeolite were 44% and 47%, respectively. Compared to the crystallization product without the addition of KDM, the crystallinity of the NaY zeolite increased by >70%.

Fig. 6. XRD traces of NaY zeolites synthesized from KDM with an 84% intercalation ratio at various addition amounts.

Fig. 7. XRD traces of NaY zeolites synthesized from KDM with a 55% intercalation ratio at various addition amounts.

Fig. 8. XRD traces of NaY zeolites synthesized from KDM with a 22% intercalation ratio at various addition amounts.
Differential thermal analysis
Figure 9 shows the differential thermal analysis (DTA) curves of NaY zeolite molecular sieves synthesized from KDM and from pure kaolin. The DTA curves of the NaY zeolite are essentially identical, with a large endothermic peak at ~300 °C due to the desorption of adsorbed water from the zeolite surface. The R-NaY molecular sieve displays an exothermic peak at ~910 °C due to the recrystallization of kaolinite. The exothermic peak of D-NaY zeolite occurs at ~930 °C, which indicates that the intercalated NaY zeolite has higher thermal stability.

Fig. 9. DTA curves of synthesized NaY zeolites (a) R-NaY and (b) D-NaY.
SEM analysis
Figure 10 shows SEM images of D-NaY and R-NaY zeolites. The NaY zeolite crystals mainly have a rhombohedral shape. The D-NaY zeolite crystals are ~0.5 μm in size, uniform and lack agglomeration (Fig. 10a,b). In contrast, the R-NaY zeolite crystals are heterogeneous in size and slightly larger than their D-NaY zeolite counterparts (Fig. 10c,d). The smaller particle size of the D-NaY zeolite indicates that the activity and the catalytic performance of this zeolite are better than those of the R-NaY zeolite. Hence, the intercalation composite is not only beneficial in terms of reducing the grain size and making the grains on the surface smoother, but it may also prevent the aggregation of NaY zeolite crystals during synthesis.

Fig. 10. SEM images of synthesized NaY zeolites (a, b) D-NaY and (c, d) R-NaY.
Pore structure
Figure 11 shows the N2 adsorption–desorption isotherms and the pore-size distributions of the synthesized NaY zeolites. The zeolites exhibited typical adsorption behaviour of microporous materials with a type I isotherm. A sharp increase in nitrogen uptake at a relative low pressure was observed in the D-NaY and R-NaY zeolites, which may be ascribed to their microporosity. In addition, the adsorption isotherms of both zeolites showed that H1-type hysteresis exists in the range 0.50 < P/P 0 < 1.0 due to the presence of mesopores. The synthesized NaY zeolites with a mesoporous pore structure showed greater performance and demonstrated wider applications. The mesoporosity in these samples is represented by the pore-size distribution from 3 to 70 nm with a peak at ~6 nm. Table 1 shows the BET specific surface areas and pore structures of the NaY zeolites. Compared with R-NaY molecular sieve, the BET specific surface area and the micropore specific surface area of D-NaY were increased by 47 and 55 m2 g–1, respectively. The larger the specific surface area, the stronger the adsorption capacity of the zeolites. Total pore volume decreased by 0.037 mL g–1, but micropore pore volume increased by 0.027 mL g–1. Finally, the average pore diameter was reduced by 0.6 nm. On the basis of the nitrogen adsorption characterization, it can be inferred that the D-NaY molecular sieve synthesized from kaolin/DMSO intercalation composite has greater mesoporosity.

Fig. 11. N2 adsorption–desorption isotherms and pore-size distributions of synthesized NaY zeolites (a) R-NaY and (b) D-NaY.
Table 1. BET specific surface areas and pore structures of the NaY zeolites.

Conclusions
NaY zeolite molecular sieves were synthesized using an in situ crystallization technique with a kaolin/DMSO intercalation composite. The kaolin/DMSO intercalation composites were prepared using the direct intercalation method. After intercalation, the kaolinite particles became smaller and the amount of fine particles increased. The intercalation composite with an 84% intercalation ratio began to de-intercalate at temperatures >80 °C and the intercalation composites with 22% and 55% intercalation ratios began to de-intercalate at ~100 °C. The optimum additional amount of kaolin/DMSO intercalation composite with an 84% intercalation ratio was 2.5%, yielding NaY zeolite with a crystallinity of 46%. The synthesized NaY zeolite had a particle diameter of 0.5 μm and a wide-pore structure, and it showed good thermal stability and a BET specific surface area and pore volume of 519 m2 g–1 and 0.355 mL g–1, respectively.
Financial support
This work was financially supported by the National Natural Science Foundation of China (No.21371055), Key Project of Scientific Research Project of Hunan education department (No.18A313).


