


Uranyl silicates form as alteration products during hydration–oxidation weathering of uraninite (Frondel, Reference Frondel1956; Finch & Ewing, Reference Finch and Ewing1992) and from spent nuclear fuel (SNF) (Wronkiewicz et al., Reference Wronkiewicz, Bates, Gerding, Veleckis and Tani1992, Reference Wronkiewicz, Bates, Gerding, Veleckis and Tani1996; Pearcy et al., Reference Pearcy, Prikryl, Murphy and Leslie1994; Plasil, Reference Plasil2014), which is mainly composed of uranium dioxide (UO2). The contact between groundwaters containing dissolved silicate and dissolved uranyl is expected to produce uranyl silicate minerals (Wronkiewicz et al., Reference Wronkiewicz, Bates, Gerding, Veleckis and Tani1992, Reference Wronkiewicz, Bates, Gerding, Veleckis and Tani1996; Pearcy et al., Reference Pearcy, Prikryl, Murphy and Leslie1994; Plasil, Reference Plasil2014). These minerals play a major role in the long-term dosage of nuclear waste repositories. The ubiquity of uranophane-α suggests that the uranyl silicates are among the most important phases controlling uranium concentrations in groundwater (Finch & Ewing, Reference Finch and Ewing1992; Plasil, Reference Plasil2014).
Mineral uranophane-α, a hydrated uranyl nesosilicate, Ca(UO2)2(SiO3OH)2·5H2O, was one of the earliest known uranyl minerals, which was first described by Websky (Reference Websky1853, Reference Websky1859). Since then, it has been identified in nearly all major and most of the minor uranium deposits in the world. Its β-polymorph, also monoclinic (Viswanathan & Harneit, Reference Viswanathan and Harneit1986; Burns, Reference Burns, Burns and Finch1999a), is much rarer and was observed for the first time by Novacek (Reference Novacek1935).
Uranophane-α is characterized by a 1:1 uranium to silicon ratio (Stohl & Smith, Reference Stohl and Smith1981). Its structure is very complex and includes 68 atoms in the unit cell, as well as 320 valence electrons. Uranyl silicate minerals having this ratio contain sheets (Stohl & Smith, Reference Stohl and Smith1981; Burns, Reference Burns2005; Grenthe et al., Reference Grenthe, Drozdzynski, Fujino, Buck, Albrecht-Schmitt, Wolf, Morss, Edelstein and Fuger2006). Nine uranyl silicate minerals (uranophane-α and -β, sklodowskite, cuprosklodowskite, boltwoodite, sodium boltwoodite, kasolite, oursinite and swamboite) have been classified as members of the uranophane group on the basis of the uranium to silicon ratio and their similar uranophane anion sheet topology (Burns et al., Reference Burns, Miller and Ewing1996, Reference Burns, Ewing and Hawthorne1997a; Burns, Reference Burns1998, Reference Burns, Burns and Finch1999a, Reference Burns2005; Grenthe et al., Reference Grenthe, Drozdzynski, Fujino, Buck, Albrecht-Schmitt, Wolf, Morss, Edelstein and Fuger2006).
Uranyl silicate minerals behave much like clay minerals. They form layers composed of sheets having a net negative charge that stack up with cations in the interlayer space to provide charge balance within the structure (Burns, Reference Burns1999b, Reference Burns2005; Burns & Li, Reference Burns and Li2002; Douglas et al., Reference Douglas, Clark, Utsunomiya and Ewing2002; Grenthe et al., Reference Grenthe, Drozdzynski, Fujino, Buck, Albrecht-Schmitt, Wolf, Morss, Edelstein and Fuger2006). Uranyl cations in the sheet might be replaced by other non-uranyl cations, similar to cation substitution in the sheets of clay minerals, providing a mechanism for incorporation of transuranic elements into these phases (Burns et al., Reference Burns, Miller and Ewing1996, Reference Burns, Ewing and Hawthorne1997a,Reference Burns, Ewing and Millerb, Reference Burns, Deely and Skanthakumar2004; Burns, Reference Burns1998; Douglas et al., Reference Douglas, Clark, Friese, Arey, Buck, Hanson, Utsunomiya and Ewing2005; Murphy & Grambow, Reference Murphy and Grambow2008; Burns & Klingensmith, Reference Burns and Klingensmith2006; Klingensmith & Burns, Reference Klingensmith and Burns2007; Shuller et al., Reference Shuller, Ewing and Becker2010, Reference Shuller, Ewing and Becker2013, Reference Shuller, Bender, Walker and Becker2014; Kuta et al., Reference Kuta, Wang, Wisuri, Wander, Wall and Clark2013). Other cations may be substituted into the interlayer space via ion exchange, providing a mechanism of incorporation of fission products such as caesium or strontium (Burns et al., Reference Burns, Miller and Ewing1996, Reference Burns, Ewing and Hawthorne1997a; Burns, Reference Burns1998, Reference Burns1999b, Reference Burns2005; Burns & Li, Reference Burns and Li2002; Douglas et al., Reference Douglas, Clark, Utsunomiya and Ewing2002). Thus, these mineral phases formed at the SNF surface may potentially act as an additional barrier to radionuclide migration via mineral sorption reactions. The incorporation mechanisms seem to be more favourable in structures with charged sheets and cations in the interlayer than in structures with electroneutral sheets, since coupled substitutions involving the interlayer may represent a charge-balancing mechanism that permits the substitution (Burns & Klingensmith, Reference Burns and Klingensmith2006; Klingensmith & Burns, Reference Klingensmith and Burns2007).
While the structure of uranophane has been determined by experimental X-ray diffraction (XRD) techniques (Ginderow, Reference Ginderow1988), it has never been confirmed by means of theoretical solid-state calculations. Although classical molecular dynamics methods based in empirical force fields have been employed to study the uranophane–water interface, as well as the interfacial reactivity of this uranyl silicate (Kuta et al., Reference Kuta, Wang, Wisuri, Wander, Wall and Clark2013), rigorous first-principles methods have only been used by Kuta et al. (Reference Kuta, Wang, Wisuri, Wander, Wall and Clark2013) and Wheaton et al. (Reference Wheaton, Majumdar, Balasubramanian, Chauffe and Allen2003) to study uranyl silicate clusters.
To the authors’ knowledge, no experimental or computational studies have been reported regarding the mechanical properties of uranophane, and the conditions of mechanical stability of its structure have not been investigated. The confirmation of the structure and stability of the uranophane structure by means of first-principles methods is also relevant because this structure represents one of the most fundamental anion topologies in the U(VI) minerals, referred to as the ‘uranophane sheet anion topology’ in the literature (Burns et al., Reference Burns, Miller and Ewing1996, Reference Burns, Ewing and Hawthorne1997a; Burns, Reference Burns1998, Reference Burns, Burns and Finch1999a, Reference Burns2005; Grenthe et al., Reference Grenthe, Drozdzynski, Fujino, Buck, Albrecht-Schmitt, Wolf, Morss, Edelstein and Fuger2006). This topology is also the basis of the structure of a large series of phosphates, arsenates, vanadates and molybdates (Forbes & Burns, Reference Forbes and Burns2006; Grenthe et al., Reference Grenthe, Drozdzynski, Fujino, Buck, Albrecht-Schmitt, Wolf, Morss, Edelstein and Fuger2006; Jouffret et al., Reference Jouffret, Rivenet and Abraham2010a,Reference Jouffret, Rivenet and Abrahamb,Reference Jouffret, Shao, Rivenet and Abrahamc; Jin et al., Reference Jin, Skanthakumar and Soderholm2011; Mer et al., Reference Mer, Obbade, Rivenet, Renard and Abraham2012).
The radiotoxicity of these substances complicates their handling under security conditions and, therefore, their characterization. The most appropriate characterization techniques for analysing these materials should be non-destructive, should not require any special sample preparation and should allow the analysis of very small amounts of sample. A technique satisfying these requirements is Raman spectroscopy. Raman spectra of uranyl silicate minerals have been given by Frost et al. (Reference Frost, Cejka, Weier and Martens2006a,Reference Frost, Cejka, Weier and Martensb), Amme et al. (Reference Amme, Renker, Schmid, Feth, Bertagnolli and Döbelin2002), Bonales et al. (Reference Bonales, Menor-Salván and Cobos2015) and Driscoll et al. (Reference Driscoll, Wolverson, Mitchels, Skelton, Parker, Molinari, Khan, Geeson and Allen2014). A very complete characterization study of uranophane including scanning electron microscopy (SEM), XRD, thermogravimetric analysis, surface area and charge determination and Raman spectroscopy was carried out by Wall et al. (Reference Wall, Clark and McHale2010). Although the Raman spectrum of uranophane has been determined experimentally, a precise assignment of the main bands in the spectrum is lacking. Theoretical methods allow for a complete characterization of these materials free of all the problems associated with its radiotoxicity. The assignment of the experimental vibrational bands is possible as these methods provide detailed views at a microscopic scale of the atomic vibrational motions in the corresponding normal modes.
METHODS: THEORETICAL DENSITY FUNCTIONAL THEORY (DFT) CALCULATIONS
The CASTEP code (Clark et al., Reference Clark, Segall, Pickard, Hasnip, Probert, Refson and Payne2005), a module of the Materials Studio package (Materials Studio, 2018), was employed to model the uranophane-α structure as in our recent work (Bonales et al., Reference Bonales, Colmenero, Cobos and Timón2016; Colmenero et al., Reference Colmenero, Bonales, Cobos and Timón2017a,Reference Colmenero, Bonales, Cobos and Timónb,Reference Colmenero, Bonales, Cobos and Timónc,Reference Colmenero, Bonales, Cobos and Timónd, Reference Colmenero, Fernández, Cobos and Timón2018a,Reference Colmenero, Fernández, Cobos and Timónb). Also, the generalized gradient approximation (GGA) together with the Perdew?Burke?Ernzerhof (PBE) functional (Perdew et al., Reference Perdew, Burke and Ernzerhof1996) and Grimme empirical dispersion correction – the DFT-D2 approach (Grimme et al., Reference Grimme2006) – were employed. The introduction of dispersion corrections produces a remarkable improvement in the results for systems in which the accurate description of non-bonded interactions is important (Tunega et al., Reference Tunega, Bucko and Zaoui2012). A norm conserving relativistic pseudopotential (Troullier & Martins, Reference Troullier and Martins1991) for the uranium atom, generated in a previous work (Bonales et al., Reference Bonales, Colmenero, Cobos and Timón2016), was used here. This pseudopotential was employed for other theoretical studies of uranyl-containing materials, such as rutherfordine (Bonales et al., Reference Bonales, Colmenero, Cobos and Timón2016; Colmenero et al., Reference Colmenero, Bonales, Cobos and Timón2017a), studtite (Colmenero et al., Reference Colmenero, Bonales, Cobos and Timón2017b), soddyite (Colmenero et al., Reference Colmenero, Bonales, Cobos and Timón2017c) and γ-UO3 polymorph (Colmenero et al., Reference Colmenero, Bonales, Cobos and Timón2017d).
The methods employed for geometry optimization and calculation of vibrational Raman spectra, mechanical properties and equations of state (EOSs) were the same as in previous studies (Bonales et al., Reference Bonales, Colmenero, Cobos and Timón2016; Colmenero et al., Reference Colmenero, Bonales, Cobos and Timón2017a,Reference Colmenero, Bonales, Cobos and Timónb,Reference Colmenero, Bonales, Cobos and Timónc,Reference Colmenero, Bonales, Cobos and Timónd), and their description will be not repeated here. However, present uranophane computations required larger kinetic energy cut-offs and K-point meshes to ensure good convergence for computed structures and energies. A kinetic energy cut-off of 1000 eV and a K mesh of 3 × 3 × 1 (four K points) were selected to determine the final results.
RESULTS AND DISCUSSION
Uranophane structure
The unit cell of uranophane-α, Ca(UO2)2(SiO3OH)2·5H2O, has monoclinic symmetry, space group P21 (Z = 4). It contains 68 atoms: 4 U, 4 Si, 2 Ca, 34 O and 24 H. In our computations, 320 valence electrons were described explicitly.
Stohl and Smith (Reference Stohl and Smith1981) categorized naturally occurring uranyl silicates according to the uranium to silicon ratio, which in part determines the structures of these minerals. Most uranyl silicate minerals have 1:1 uranium to silicon ratios and are sheet silicates (Stohl & Smith, Reference Stohl and Smith1981; Burns, Reference Burns2005; Grenthe et al., Reference Grenthe, Drozdzynski, Fujino, Buck, Albrecht-Schmitt, Wolf, Morss, Edelstein and Fuger2006). Soddyite has a 2:1 uranium to silicon ratio and a framework crystal structure (Stohl & Smith, Reference Stohl and Smith1981; Demartin et al., Reference Demartin, Gramaccioli and Pilati1992; Burns, Reference Burns2005). The ratio of 2:5 was found in the crystal structures of weeksite (Jackson & Burns, Reference Jackson and Burns2001), haiweeite (Burns, Reference Burns.2001) and coutinhoite (Atencio et al., Reference Atencio, Carvalho and Matioli2004), and probably also in some uranyl silicate minerals from Russia that have not been approved by the International Mineralogical Association. Some synthetic framework uranyl silicates have also been described (Burns & Hill, Reference Burns and Hill2000; Huang et al., Reference Huang, Wang and Jacobson2003).
Uranyl silicate sheets are composed of [(UO2)2(SiO4)2]–4 units bound at the equatorial edges (see Fig. 1a,b). A sheet, [(UO2)(SiO4)]n–2n, contains UO7 pentagonal bipyramids and SiO3OH tetrahedra. Charge-compensating cations – calcium in uranophane – lie in the interlayer space between the sheets (see Fig. 1c). Two uranyl silicate sheets are connected by CaO2(OH)(H2O)4 polyhedra (distorted pentagonal bipyramid). The Ca atom ligands are four water molecules, two uranyl oxygen atoms belonging to the upper and the lower sheets and one OH group of a SiO3OH tetrahedron. One water molecule is out of the Ca polyhedron. While this water molecule is described as free or as crystallization water, the four water molecules belonging to the Ca atom coordination sphere are referred to as structural water. Hydrogen bonds reinforce the bonding between the uranyl silicate sheets, the Ca atom and the free water. The upper sheet SiO3OH tetrahedra have free OH groups pointing downwards and the lower sheet tetrahedra have OH groups pointing upwards, which belong to the Ca atom coordination sphere (Fig. 1c).
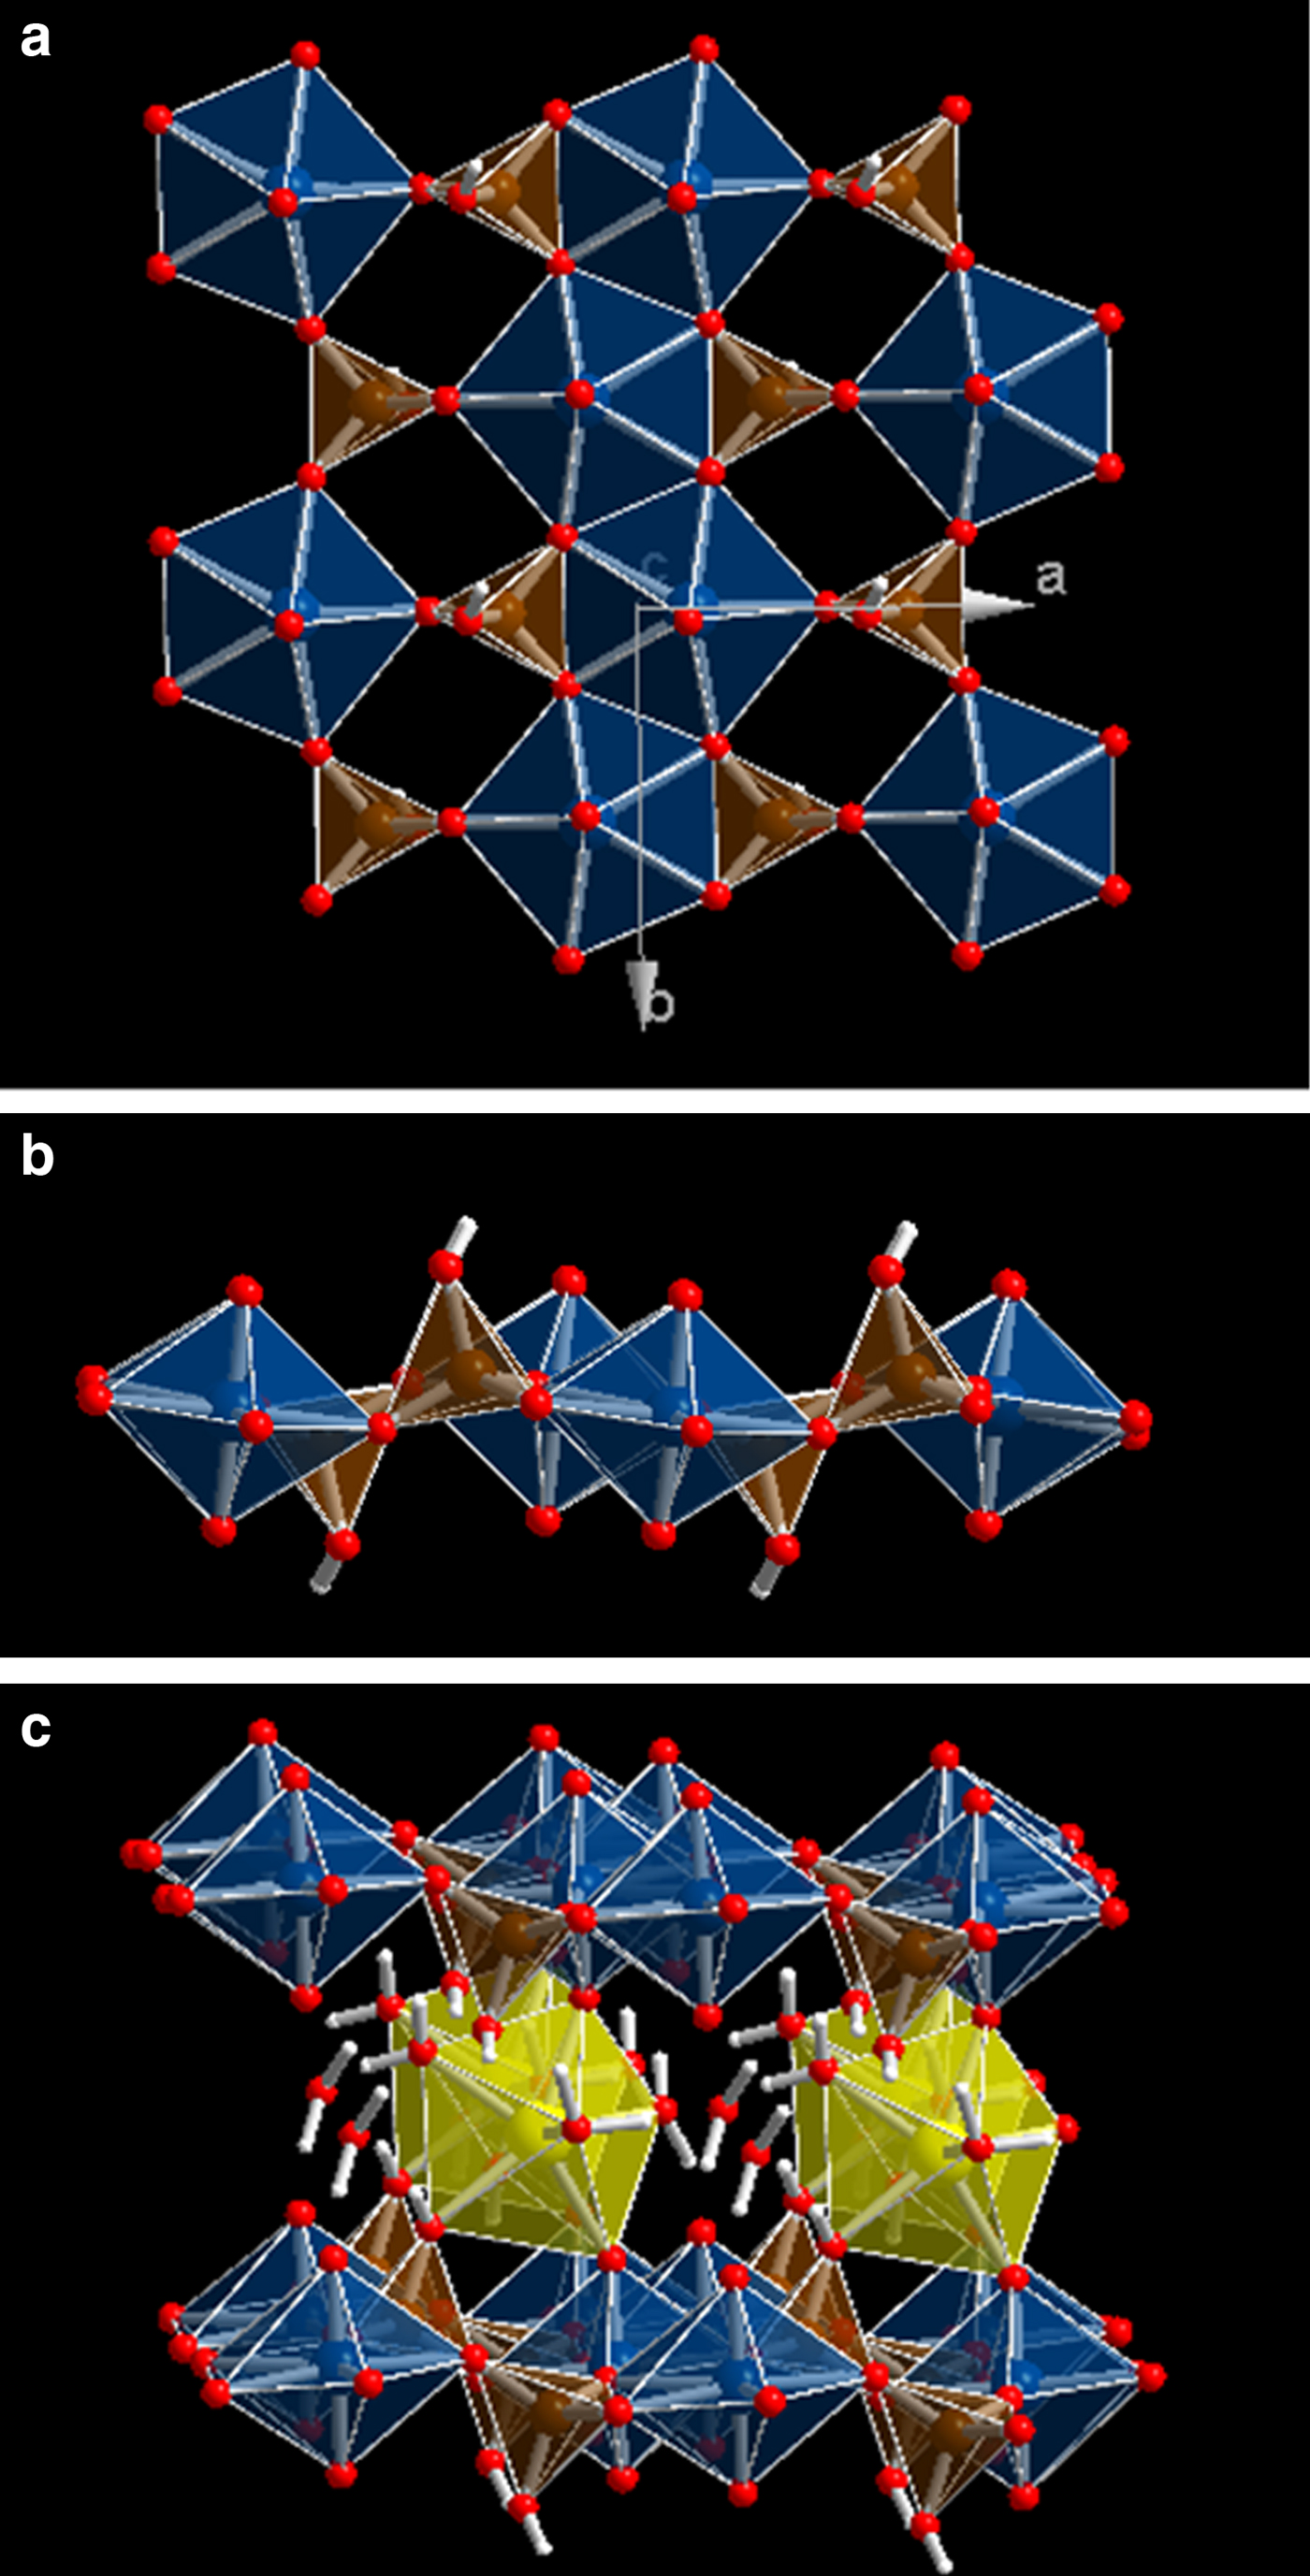
Fig. 1. Structure of uranophane-α. (a) View of a 2 × 2 × 2 supercell from [001] showing a uranyl silicate sheet [(UO2)(SiO4)]n–2n composed of UO7 pentagonal bipyramids and SiO3OH tetrahedral. (b) The same view as in (a) from [010]. (c) View of a 2 × 2 × 2 supercell from [010] showing two uranyl silicate sheets connected by CaO2(OH)(H2O)4 polyhedra (distorted pentagonal bipyramid). One water molecule is out of the Ca polyhedron (free water). Colour code: U = blue; Si = brown; O = red; H = white; Ca = yellow.
The structure of uranophane-α was determined in calculations with increasing complexity in order to obtain a set of calculation parameters yielding good convergence for computed structures and energies. Table 1 gives the final lattice parameters, volumes and densities obtained compared with the corresponding experimental values of Ginderow (Reference Ginderow1988). The agreement is excellent, with the error in the computed volume and density being only ~0.4%.
Table 1. Lattice parameters. Experimental values are from Ginderow (Reference Ginderow1988).

Table 2 shows a comparison of the more important geometric parameters (bond distances) obtained with the corresponding experimental data of Ginderow (Reference Ginderow1988). Uranophane-α has two structurally (symmetrically) identical U6+ ions and two structurally (symmetrically) identical Si4+ ions in its crystal structure. However, the two non-symmetrically related uranyl and silicate polyhedra are nearly identical. The two O atoms in the uranyl group, UO22+, are in apical positions of the pentagonal bipyramids at distances of 1.801 and 1808 Å for both U1 and U2. The calculated values are 1.828 and 1.843 Å for U1 and 1.825 and 1.829 Å for U2, respectively. The remaining five O atoms lie in the equatorial plane, with the U–O distances ranging from 2.241 to 2.463 Å (calculated 2.214–2.457 Å for U1 and 2.236–2.462 Å for U2, respectively). The Si–O distances, ranging from 1.601 to 1.638 Å, are within the normal range (calculated 1.621–1.663 Å for Si1 and 1.620–1.666 Å for Si2, respectively). Ca–O distances in the distorted pentagonal bipyramid are satisfactorily reproduced and range from 2.371 to 2.445 Å (calculated 2.372–2.509 Å). Thus, the solvation structure around the interlayer Ca atom is described satisfactorily.
Table 2. Bond distances (in Å). Experimental values are from Ginderow (Reference Ginderow1988).

It is concluded that the experimental geometrical parameters and our theoretical values agree quite well in spite of the complexity of the uranophane-α structure.
The X-ray powder pattern of uranophane-α was computed from the experimental (Ginderow, Reference Ginderow1988) and computed structures (Downs, Reference Downs, Bartelmehs, Gibbs and Boisen1993). The most intense lines (I >10%) are compared in Supplementary Figs S1b and S1c, respectively, and the agreement in line positions and intensities is very good. The precise values of the main reflections are given in Supplementary Table S1.
Mechanical properties and stability
The elastic tensor, needed for the calculation of mechanical properties and to study the mechanical stability of the uranophane crystal structure, was calculated for the optimized equilibrium structure from stress–strain relations by using the finite deformation technique implemented in CASTEP. Crystals with monoclinic symmetry have 13 non-degenerate elastic constants in the symmetric stiffness matrix (Nye, Reference Nye1985; Weck et al., Reference Weck, Kim and Buck2015), which may be written as:
 $$C = \left( {\matrix{ {C11} & {C12} & {C13} & 0 & {C15} & 0 \cr {C12} & {C22} & {C23} & 0 & {C25} & 0 \cr {C13} & {C23} & {C33} & 0 & {C35} & 0 \cr 0 & 0 & 0 & {C44} & 0 & {C46} \cr {C15} & {C25} & {C35} & 0 & {C55} & 0 \cr 0 & 0 & 0 & {C46} & 0 & {C66} \cr}} \right)$$
Here, we use the standard Voigt notation for the indices, contracting a pair of Cartesian indices into a single integer 1 ≤ i ≤ 6: xx → 1, yy → 2, zz → 3, yz → 4, xz → 5, xy → 6. The precise values of these constants obtained in our computations are (all values given in GPa):
 $$ C = \left( {\matrix{ {156.59} & {44.77} & {17.85} & 0 & { - 6.84} & 0 \cr {44.77} & {152.19} & {14.46} & 0 & {0.60} & 0 \cr {17.85} & {14.46} & {94.34} & 0 & {2.46} & 0 \cr 0 & 0 & 0 & {23.93} & 0 & {2.27} \cr { - 6.84} & {0.60} & {2.46} & 0 & {27.71} & 0 \cr 0 & 0 & 0 & {2.27} & 0 & {34.54} \cr}} \right)$$
For monoclinic crystals, a set of necessary (but not sufficient) Born criteria for mechanical stability were given in terms of the stiffness matrix elements, such as by Weck et al. (Reference Weck, Kim and Buck2015). These conditions are fully satisfied. The generic necessary and sufficient Born criterion is that all eigenvalues of the C matrix be positive (Mouhat & Coudert, Reference Mouhat and Coudert2014). The C matrix was diagonalized numerically and all eigenvalues were found to be positive. As the above condition is satisfied, the mechanical stability of uranophane-α may be inferred.
The fact that C33, the diagonal component of the C matrix along c direction, is much smaller than either C11 or C22 suggests that thermal expansion of the material will occur predominantly perpendicular to the uranyl silicate sheets. This is consistent with the fact that the intersheet space, containing the hydrated Ca ions and free water molecules, will increase as temperature increases. The diagonal component C11(a direction contained in the plane of the uranyl silicate sheets; see Fig. 1a) is the largest.
If single-crystal samples are not available, measurement of the individual elastic constants is not feasible. Instead, the polycrystalline bulk modulus (B) and shear modulus (G) may be determined experimentally. The Voigt (Reference Voigt1928) and Reuss (Reference Reuss1929) schemes were used to compute the isotropic elastic properties of uranophane polycrystalline aggregates, as was done in our previous studies of rutherfordine and soddyite minerals (Colmenero et al., Reference Colmenero, Bonales, Cobos and Timón2017a,Reference Colmenero, Bonales, Cobos and Timónc). The Reuss and Voigt approximations result in lower and upper limits of polycrystalline constants, respectively, and practical estimates of the polycrystalline bulk and shear moduli in the Hill approximation may be computed by using average formulae (Hill, Reference Hill1952). Relevant formulae for these approximations may be found in previous work (e.g. Bouhadda et al., Reference Bouhadda, Djella, Bououdina, Fenineche and Boudouma2012; Weck et al., Reference Weck, Kim and Buck2015). The bulk and shear moduli and other mechanical properties computed in the Voigt, Reuss and Hill approximations are listed in Table 3.
Table 3. Bulk, modulus, shear modulus, Young modulus, Poisson ratio, Pugh's ratio and Vickers hardness (B, G, E, ν, D and H) calculated in the Voigt, Reuss and Hill approximations. Values of B, G and E are given in GPa.

The numerical estimate of the error in the computed bulk modulus given by the CASTEP code is 2.455 GPa, which is reasonable and very similar to the difference of the values in the Hill and Voigt/Reuss schemes of 2.721 GPa. Thus, the error was estimated to be ~5%. The Voigt and Reuss methods yield quite small differences for uranophane-α. Larger differences are expected for crystalline systems with strong anisotropy, featuring large differences between elastic constants along different directions (Weck et al., Reference Weck, Kim and Buck2015; Colmenero et al., Reference Colmenero, Bonales, Cobos and Timón2017a).
In general, a large value of the shear modulus is an indication of the more pronounced directional bonding between atoms (Ravindran et al., Reference Ravindran, Fast, Korzhavyi, Johansson, Wills and Eriksson1998). The shear modulus, G, represents the resistance to plastic deformation, while the bulk modulus represents the resistance to fracture (Ravindran et al., Reference Ravindran, Fast, Korzhavyi, Johansson, Wills and Eriksson1998; Bouhadda et al., Reference Bouhadda, Djella, Bououdina, Fenineche and Boudouma2012). Young's modulus, B, defines the relationship between stress (force per unit area) and strain (proportional deformation) in a material; that is, E = σ/ε. It is possible to get the individual components of the bulk and Young's moduli from the elastic compliance matrix components (Ravindran et al., Reference Ravindran, Fast, Korzhavyi, Johansson, Wills and Eriksson1998; Bouhadda et al. Reference Bouhadda, Djella, Bououdina, Fenineche and Boudouma2012; Weck et al., Reference Weck, Kim and Buck2015). The compliance matrix is the inverse of the stiffness C matrix. The corresponding values for the structure of uranophane are given in Table 4. B c is much smaller than either B a or B b (Table 4). Thus, c direction is the most compressible one. Also, the component E c is much smaller (less stiff) than E a and E b. Thus, the direction perpendicular to the plane containing the uranyl silicate sheets is the most compressible and the least stiff, which is in agreement with results for the elasticity C matrix.
Table 4. Bulk and Young moduli components (GPa) along the crystallographic axes.

Pugh (Reference Pugh1954) introduced the proportion of bulk to shear moduli of polycrystalline phases (D = B/G) as a measure of ductility by considering the interpretation of the shear and bulk moduli given above. A larger D value is usually associated with greater ductility. The critical value that separates ductile and brittle materials is 1.75 (i.e. if D >1.75, the material behaves in a ductile manner, otherwise the material behaves in a brittle manner; Bouhadda et al., Reference Bouhadda, Djella, Bououdina, Fenineche and Boudouma2012). The Poisson ratio, ν, can be also utilized to measure the malleability of crystalline compounds and is related to the Pugh's ratio given above by the relationship D = (3 − 6ν) / (8 + 2ν). The Poisson ratio is ~0.33 (1/3) for ductile materials and much lower than 0.33 for brittle materials. The D and ν values for uranophane are 1.62 and 0.24, respectively (Table 3). These values are only slightly smaller than 1.75 and 0.33, respectively, corresponding to a brittle material. For comparison, both studtite and metastudtite minerals are ductile (Weck et al., Reference Weck, Kim and Buck2015).
The hardness of these systems is computed according to a recently introduced empirical scheme (Chen et al., Reference Chen, Niu, Li and Li2011; Niu et al., Reference Niu, Wei, Sun, Chen, Franchini, Li and Li2011) that correlates the Vickers hardness and Pugh's ratio (D = B/G). The Vickers hardness value, H, of polycrystalline uranophane (~6.3) corresponds to material of intermediate hardness (Table 3). For comparison, we obtained the hardness of studtite and metastudtite using the elasticity data of Weck et al. (Reference Weck, Kim and Buck2015). These systems, characterized by much larger D ratios, have much smaller hardnesses (<1). The hardness of uranophane is comparable to soddyite, a uranyl silicate mineral (6.3 according to Colmenero et al., Reference Colmenero, Bonales, Cobos and Timón2017c).
In order to assess the elastic anisotropy of uranophane, shear anisotropic factors were obtained. These factors provide a measure of the degree of anisotropy in the bonding between atoms in different planes and are very important to studying material durability (Ravindran et al., Reference Ravindran, Fast, Korzhavyi, Johansson, Wills and Eriksson1998; Bouhadda et al., Reference Bouhadda, Djella, Bououdina, Fenineche and Boudouma2012). Shear anisotropic factors for the {100} (A 1), {010} (A 2) and {001} (A 3) crystallographic planes and percentages of anisotropy in compression and shear (A comp and A shear) were computed using the formulae given by Ravindran et al. (Reference Ravindran, Fast, Korzhavyi, Johansson, Wills and Eriksson1998). For an isotropic crystal, the factors A 1, A 2 and A 3 must be 1, while any value smaller or greater than unity is a measure of the degree of elastic anisotropy of the crystal. Also, a value of 0% for A comp and A shear represents a perfectly isotropic crystal. For uranophane (see Table 5), the anisotropies grow in the planes {100}, {010} and {001} in the order A 1 < A 2 < A 3. The {100} plane is shown to be the most anisotropic one. Percentage anisotropies in compression and shear are ~5% and 7%, respectively.
Table 5. Shear anisotropy factors (A 1, A 2 and A 3), percentages of anisotropy in compression and shear (A comp and A shear) and universal anisotropy index (A U).

In the recently introduced universal anisotropy index (Ranganathan & Ostoja-Starzewski, Reference Ranganathan and Ostoja-Starzewski2008), the departure of A U from zero defines the extent of single-crystal anisotropy and accounts for both the shear and the bulk contributions, unlike all other existing anisotropy measures. Thus, A U represents a universal measure to quantify the single-crystal elastic anisotropy. Uranophane is characterized by an anisotropy index of 0.81, which is a rather small value (A U = 0 corresponds to a perfectly isotropic crystal). For comparison, studtite and metastudtite exhibit much larger anisotropies. The values computed by Weck et al. (Reference Weck, Kim and Buck2015) are 2.17 and 1.44, respectively. Uranophane and soddyite, uranyl silicate minerals, are characterized by small anisotropies, A U, of 0.81 and 0.50 (Colmenero et al., Reference Colmenero, Bonales, Cobos and Timón2017c), respectively.
A set of fundamental physical properties may be estimated with the calculated elastic constants. For example, V L and V T, the longitudinal and transverse elastic wave velocities of the polycrystalline materials, may be determined in terms of the bulk and shear moduli (Weck et al., Reference Weck, Kim and Buck2015). The values obtained are 3.069 and 5.276 km/s, respectively, using the calculated crystal density of 3.877 g/cm3 (see Table 1).
Lattice volumes around the equilibrium were calculated by optimizing the structure at 17 different applied pressures between –1.0 and 12.0 GPa. The calculated volume and pressure data were then fitted to a fourth-order Birch–Murnaghan (Birch, Reference Birch1947) equation of state (EOS):
 $$\eqalign {& P = 3\; B\; f_E\; \left( {1 + 2f_E} \right)^{\textstyle{5 \over 2}} \left[ 1 + \displaystyle{3 \over 2} \left( {{B}^{\prime} - 4} \right) f_E \right. \cr & \qquad \left. + \displaystyle{3 \over 2}\left\{ {B\; {B}^{\prime \prime} + \left( {{B}^{\prime} - 4} \right)\left( {{B}^{\prime} - 3} \right) + \displaystyle{{35} \over 9}} \right\}f_E^2 \right]}$$
by using the EOSFIT 5.2 code (Angel, Reference Angel, Hazen and Downs2001). The computed volume of the unit cell at 0 GPa (733.6 Å3) was fixed as V 0. In this EOS,
 $$f_E = \displaystyle{1 \over 2}\left[ {{\left( {\displaystyle{{V_0} \over V}} \right)}^{\textstyle{2 \over 3}} - 1} \right]$$
and B, B′ and  $B{^{\prime \prime}}$ are the bulk modulus and its first and second derivatives, respectively, at the temperature of 0 K. The values found for B, B′ and
  $B{^{\prime \prime}}$were B = 59.96 ( ± 2.1), B′ = 2.29 ( ± 1.11), and
  $B{^{\prime \prime}}$ = −0.25 ( ± 0.19) GPa (χ2 = 0.014). The value obtained for the bulk modulus is in good agreement with that determined from elastic constants. For comparison, the bulk modulus obtained in the Hill approximation is B = 59.20 ± 2.45 GPa.
Raman spectra and band assignment
In this section, we analyse the theoretically determined Raman spectrum and compare the main band wavenumbers obtained with the corresponding values found experimentally in the literature for this mineral phase (Frost et al., Reference Frost, Cejka, Weier and Martens2006a,Reference Frost, Cejka, Weier and Martensb). Additional information about the Raman spectrum of uranophane can be found in Amme et al. (Reference Amme, Renker, Schmid, Feth, Bertagnolli and Döbelin2002), Wall et al. (Reference Wall, Clark and McHale2010), Driscoll et al. (Reference Driscoll, Wolverson, Mitchels, Skelton, Parker, Molinari, Khan, Geeson and Allen2014) and Bonales et al. (Reference Bonales, Menor-Salván and Cobos2015). The experimental band wavenumbers of Frost et al. (Reference Frost, Cejka, Weier and Martens2006a,Reference Frost, Cejka, Weier and Martensb) and their assignments are given in Supplementary Table S2. Experimental and calculated Raman shifts, calculated intensities and assignments are listed in Table 6. For visual comparison, the spectrum computed at T = 298 K, λ = 532 nm, full width at half maximum (FWHM) = 20 cm–1 is shown in Fig. 2, where it is compared with an experimental spectrum from the RRUFF database (Downs, Reference Downs2006; record RRUFF-050380). The two spectra are very similar to each other (Fig. 2). Pictures of the atomic motions in some of the Raman-active vibrational modes are given in Supplementary Fig. S3.
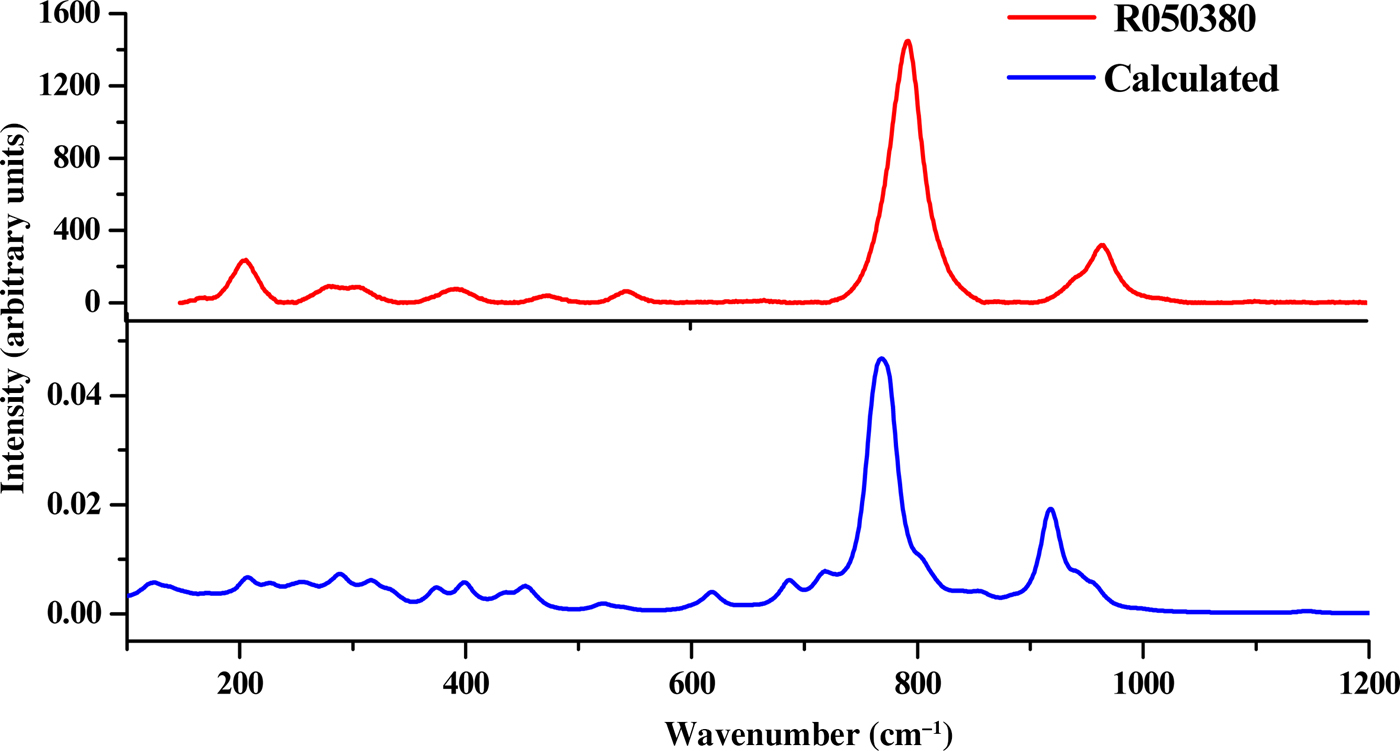
Fig. 2. Raman spectra of uranophane-α mineral. Red = RRUFF-050380 [82]; blue = calculated.
Table 6. Experimental and calculated Raman band frequencies, calculated intensities and assignments. The irreducible representations (Irr. Rep.) corresponding to the v vibrational motions associated with each band A or B are also given below.

a Frost et al. (Reference Frost, Cejka, Weier and Martens2006a). b Frost et al. (Reference Frost, Cejka, Weier and Martens2006b).
Although the bands in the OH stretching region seem to vary among samples, most bands are well reproduced theoretically. The wavenumbers of these bands observed in the experimental samples are generally comparable but not identical (Frost et al., Reference Frost, Cejka, Weier and Martens2006a,Reference Frost, Cejka, Weier and Martensb). This supports the presence of mobile protons that may be exchanged between the uranyl silicate sheets and the interlayer and that influence the hydrogen-bonding networks in their crystal structures (Cejka et al., Reference Cejka, Burns and Finch1999; Frost et al., Reference Frost, Cejka, Weier and Martens2006b). The experimental bands centred at ~3492, 3463, 3358, 3326, 3310, 3216 and 3142 cm–1 are comparable with the calculated wavenumbers of 3485, 3478, 3357, 3295, 3272, 3238 and 3149 cm–1. The theoretical methods allow us to distinguish the origins of these bands, which may be assigned to specific stretching vibrations. The first two modes (3492 and 3463 cm–1) are attributed to stretching vibrations of structural OH (labelled as cr in Table 6). The next three bands (3358, 3326 and 3310 cm–1) are due to vibrations localized on structural (coordinated) water molecules (labelled as st in Table 6). The band at 3216 cm–1 is ascribed to vibrations in crystallization and structural water molecules and OH stretching vibrations in SiO3OH fragments, including OH groups that do not form part of the Ca atom coordination sphere (referred to as fr in Table 6). Finally, the band at 3142 cm–1 is assigned to vibrations in structural water molecules and SiO3OH fragments including OH groups, which are not coordinated with interlayer Ca atoms. In previous experimental works, all of these bands were attributed without specification to OH stretching vibrations in the water molecules. The bands at lower wavenumbers also contain contributions from OH stretching vibrations from the free SiO3OH fragments. Frost et al. (Reference Frost, Cejka, Weier and Martens2006a) placed these vibrations at wavenumbers higher than 3600 cm–1. However, in another study (see Frost et al., Reference Frost, Cejka, Weier and Martens2006b), these vibrations were placed at about 3200 cm–1.
The water bending vibration is not observed in the experimental Raman spectra and, accordingly, the corresponding computed band at 1639 cm–1 has a very small intensity (see vibrational mode picture in Fig. S3).
The experimental bands located at 1272 and 1156 cm–1 are placed at 1222 and 1146 cm–1 in the computed spectrum. These are assigned, respectively, to SiOH bending vibrations localized in the SiO3OH fragments, whose OH groups are coordinated with interlayer Ca atoms (referred to as co in Table 6), and to free SiO3OH fragments (referred to as fr in Table 6, as has already been mentioned).
The experimental bands at 960 and 950 cm–1 are close to the theoretical ones located at wavenumbers 958 and 942 cm–1, respectively. Both bands are ascribed to SiOH bending vibrations localized in the co-SiO3OH fragments, δ(co-SiOH), combined with water librations. These bands were, however, assigned to silicate stretching vibrations, νs(SiO44–) (ν1), in most experimental works (Amme et al., Reference Amme, Renker, Schmid, Feth, Bertagnolli and Döbelin2002; Frost et al., Reference Frost, Cejka, Weier and Martens2006a,Reference Frost, Cejka, Weier and Martensb; Wall et al., Reference Wall, Clark and McHale2010; Driscoll et al., Reference Driscoll, Wolverson, Mitchels, Skelton, Parker, Molinari, Khan, Geeson and Allen2014; Bonales et al., Reference Bonales, Menor-Salván and Cobos2015). This assignment seems, therefore, not to be correct. It should also be noted that the correspondence with symmetric vibrations of the free silicate group are lost for uranophane (monoclinic symmetry), as can be seen in the vibrational mode pictures (Fig. S3). The contribution of SiO3OH group vibrations to these modes is very small. A band appears in the calculated spectrum at 915 cm–1, which is assigned to SiO stretching vibrations of the SiO3OH fragments with coordinated OH groups (see vibrational mode picture in Fig. S3). Thus, silicate stretching vibrations appear at smaller wavenumbers than those reported in the experimental works (Frost et al., Reference Frost, Cejka, Weier and Martens2006a; Wall et al., Reference Wall, Clark and McHale2010; Driscoll et al., Reference Driscoll, Wolverson, Mitchels, Skelton, Parker, Molinari, Khan, Geeson and Allen2014).
The band placed at 886 cm–1 is obtained theoretically at 884 cm–1, and that at 839 cm–1 is calculated to be at 837 cm–1. Both bands are assigned to SiOH bending vibrations (localized in fr- and co-SiO3OH fragments) and water librations.
The band placed at 797 cm–1 is the most intense of the Raman spectrum and it is calculated to be at 776 cm–1. This band has been assigned in the experimental studies (Amme et al., Reference Amme, Renker, Schmid, Feth, Bertagnolli and Döbelin2002; Frost et al., Reference Frost, Cejka, Weier and Martens2006a,Reference Frost, Cejka, Weier and Martensb; Wall et al., Reference Wall, Clark and McHale2010; Driscoll et al., Reference Driscoll, Wolverson, Mitchels, Skelton, Parker, Molinari, Khan, Geeson and Allen2014; Bonales et al., Reference Bonales, Menor-Salván and Cobos2015) to symmetric uranyl stretching vibrations, νs(UO22+). However, our calculations show that it is the result of a combination of vibrations including SiOH vibrations localized in fr-SiO3OH fragments, uranyl stretching vibrations and water librations. The uranyl vibrations make only a small contribution to this mode. As has already been mentioned, the symmetry of this vibration is lost and, therefore, the term ‘symmetric’ should not be used. A weak band at 786 cm–1 is also observed and it is comparable to calculated bands at 760 and 766 cm–1 having the same assignment with the intense band at 798 cm–1.
For the bands at 711, 627, 544, 525, 469, 444 and 399 cm–1, we obtain the theoretical counterparts 717, 618, 539, 519, 452, 434 and 399 cm–1, which correspond to different fr- and co-SiOH bending vibrations. The band placed at 544 cm–1, and found at 539 cm–1, is attributed only to water librational vibrations.
Uranyl bending vibrations begin to appear at about 376 cm–1. Bands at 376, 347, 325, 306, 289, 280, 250, 214, 205, 167, 139, 137, 122 and 112 cm–1 are close to their calculated counterparts at 374, 333, 317, 316, 289, 276, 256, 226, 206, 186, 137, 135, 126 and 119 cm–1. Most of them are assigned to a combination of silicate, SiO3OH, deformations (localized in fr or co groups), uranyl bending vibrations and water librations. The bands in this region have been assigned to uranyl bending vibrations (Frost et al., Reference Frost, Cejka, Weier and Martens2006a). However, uranyl bending vibration has only a generally small contribution to these modes and is accompanied by silicate deformation vibrations and water librations. The precise assignments are given in Table 6.
Band assignment is a very difficult task in the case of complex systems with low symmetry. While the assignments made by correlating the bands with those of free fragments (Nakamoto, Reference Nakamoto1986; Cejka, Reference Cejka, Burns and Finch1999) are generally very useful for understanding the origins of the experimental bands, correspondence cannot always be made, especially for many systems with low symmetry (monoclinic for uranophane). For example, as is shown here, vibrations with specific motions similar to those of free silicate fragments (as ν3[SiO44–], ν1[SiO44–], ν4[SiO44–] and ν2[SiO44–]) and free uranyl fragments (ν3[UO22+], ν1[UO22+] and ν2[UO22+]) were not observed for uranophane-α.
Sr-exchanged uranophane-α
The possible incorporation of strontium within the structure of uranophane-α was investigated by Douglas et al. (Reference Douglas, Clark, Utsunomiya and Ewing2002). This research was conducted in order to analyse whether this 1:1 uranyl silicate might serve as a host for the incorporation of fission products by substitution of Ca2+ in the interlayer space. Uranophane-α was synthesized by those authors and Ca2+ was exchanged completely or partially. The resulting solid was then characterized by XRD, SEM and elemental analysis. The Sr2+ analogue of uranophane yielded a diffractogram that resembles the XRD pattern obtained for synthetic uranophane, although the morphology of the solid was different.
Theoretical methods allow us to study this incorporation in a simple way that is free of the difficulties related to the radiotoxicity of these materials. We have studied the Sr-exchanged uranophane material by replacing the Ca2+ ion with Sr2+ in the structure of uranophane and performing a structural re-optimization under the same theoretical conditions as for ordinary Ca-uranophane (Table 7). The crystal structure demonstrated very small variations upon exchange. The interlayer cation solvation sphere was very similar to that of Ca-uranophane. The same structure was obtained when the calculations were made from different initial forms of the hydrogen bond structure in the interlayer space. The corresponding lattice parameters are given in Table 7. The main difference is the increase in the interlayer space, corresponding to an increase of 0.35 Å in the c lattice parameter. The change of a and b lattice parameters was only of about 0.02 Å. The volume is increased by ~3%. These results may be compared with those of Berghout et al. (Reference Berghout, Tunega and Zaoui2010) for the Ca- and Sr-exchanged two-layer hydrate smectites. In this case, the computed increase in the c lattice parameter was ~0.21 Å and the unit-cell volume increased by 2.4%.
Table 7. Calculated lattice parameters of normal and Sr-exchanged uranophane-α.

The XRD traces of Ca- and Sr-exchanged uranophanes were obtained from the optimized atomistic positions using the program REFLEX included in the Materials Studio package (Materials Studio, 2018). As expected from the study of Douglas et al. (Reference Douglas, Clark, Utsunomiya and Ewing2002), the XRD traces of both forms are very similar (see Fig. S2).
In order to detect whether these materials might be distinguished by Raman spectroscopy, we computed the corresponding spectra of Sr-exchanged uranophane using density functional perturbation theory. The corresponding spectra were again very similar (Fig. 3).

Fig. 3. Computed Raman spectra of Ca- and Sr-exchanged uranophanes.
As the motion of the interlayer cation does not appear in any of the main bands in the Raman spectrum (see vibrational mode pictures in Fig. S3) and the solvation structure of the interlayer cation remains almost unchanged, the Raman spectra of Ca- and Sr-exchanged uranophanes are very similar. In summary, the incorporation of Sr2+ in the structure of uranophane by cation exchange is possible, in accordance with the experimental results of Douglas et al. (Reference Douglas, Clark, Utsunomiya and Ewing2002), and the identification of the exchanged solid is not feasible either by XRD or by Raman spectroscopy.
SUMMARY AND CONCLUSIONS
The DFT results show the important role of water in the structural and vibrational properties of the uranyl silicate mineral, uranophane-α. Water molecules enter into the structure of uranophane-α as structural and interlayer water not bound to interlayer cations. Structural water molecules form part of the coordination structure of calcium ions present in the interlayer space between the uranyl silicate sheets, i.e. within the distorted pentagonal bipyramids, CaO2(OH)(H2O)4. Such interlayer water molecules are also localized in the interlayer space, but are free (i.e. they do not coordinate the calcium ions). Structural optimization performed by the GGA-PBE exchange-correlation functional, taking into account a dispersion correction scheme, has produced unit-cell lattice parameters and atomic-bond distances in excellent agreement with experimental data. The computed XRD pattern is also in very good agreement with the experimental one.
An analysis of the calculated elasticity stiffness tensor has revealed that the uranophane-α structure satisfies properly the mechanical stability conditions. Furthermore, the mechanical properties of this mineral, for which there are no experimental data to compare with, were predicted. Uranophane-α is a brittle material characterized by small anisotropy and large hardness in comparison with those of other uranyl-containing materials. The EOS of uranophane-α was obtained by fitting lattice volumes and pressures to a fourth-order Birch–Murnaghan EOS.
The Raman spectrum was also computed by means of density functional perturbation theory and compared with its experimental counterpart. The results were in good agreement with the experimental data. A normal mode analysis of the theoretical spectrum was carried out and used to assign the main bands of the Raman spectra. Theoretical methods allowed the assignment of the bands to vibrations localized in different fragments within the crystal unit cell.
The main bands used as fingerprints to identify uranophane-α are those placed at wavenumbers 797 and 960 cm–1. The corresponding values resulting from our computations are comparable to the experimental values of 776 and 958 cm–1. The first band is assigned to a combination of SiOH bending vibrations localized in the fr-SiO3OH fragments, uranyl UO stretching vibrations and water librations. The second one is assigned to a combination of SiOH bending vibrations localized in the co-SiO3OH fragments and water librations. In the experimental works, these bands were attributed to uranyl symmetric stretching, νs(UO22+), and silicate symmetric stretching, νs(SiO44–), vibrations. As indicated by our theoretical calculations, these assignments are incorrect or incomplete since they do not include several contributions, such as those coming from vibrations arising from the ubiquitous water molecules and SiOH fragments. These contributions underline the role of the hydrogen bond structure in uranophane-α and its impact on the vibrational spectra. Furthermore, the correlation of these bands with those of free fragments is lost due to the low crystal symmetry.
The bands at 545, 469 and 399 cm–1 were also satisfactorily reproduced theoretically, with the corresponding values being 539, 459 and 399 cm–1. The first band is only ascribed to water librational vibrations, and the remaining ones represent SiOH bending vibrations localized in the co-SiO3OH fragments and water librational vibrations. Previous assignments of these bands are not correct since they involve silicate group deformations, ν4(SiO44−) and ν2(SiO44–). In addition, testing for the correspondence with free silicate group vibrations cannot be performed for uranophane.
In the low-wavenumber region, there are four main bands located at 289, 250, 205 and 167 cm–1, which were determined theoretically to be placed at 289, 256, 206 and 186 cm–1, respectively. These were mainly attributed to uranyl bending vibrations. Theoretical calculations indicate that these bands correspond to a combination of silicate (SiO3OH) deformations, uranyl bending vibrations and water librations. The uranyl bending vibration appears to make only a small contribution.
In the OH stretching region, most bands were well reproduced theoretically, in spite of the fact that the bands in this region vary among samples. The theoretical analysis allowed for the assignment of these bands to vibrations localized in different fragments of the unit cell. The bands at higher wavenumbers are attributed to OH stretching vibrations in crystallization water molecules. The bands at medium wavenumbers are due to OH stretching vibrations localized in structural water molecules. Finally, the bands with the lowest wavenumbers contain contributions from OH stretching vibrations localized in the SiOH fragments containing OH groups out of the coordination sphere of interlayer calcium ions.
The bands placed at 1272 and 1156 cm–1 (comparable to the theoretical bands located at 1222 and 1146 cm–1, respectively) are attributable to SiOH bending vibrations, localized in different SiO3OH fragments (the higher wavenumber bands in co-SiO3OH fragments and the lower wavenumber bands in fr-SiO3OH fragments).
Finally, the structure of Sr-exchanged uranophane and the structure of the solvation sphere of the interlayer cation are very similar to that of normal uranophane, the main difference being, as in the case of a smectite clay mineral (Berghout et al., Reference Berghout, Tunega and Zaoui2010), the increase of the interlayer space (the c parameter increased by about 0.35 Å). The XRD pattern and Raman spectrum of the Sr-exchanged uranophane were also almost identical to those of the normal Ca-uranophane, which is in agreement with the experimental results of Douglas et al. (Reference Douglas, Clark, Utsunomiya and Ewing2002).
ACKNOWLEDGMENTS
This work was supported by ENRESA in Project No. 079000189: “Aplicación de técnicas de caracterización en el estudio de la estabilidad del combustible nuclear irradiado en condiciones de almacenamiento” (ACESCO) and Project CGL2013-48415-C2-1-R. Supercomputer time at the CETA-CIEMAT, CTI-CSIC and CESGA centres is also acknowledged. The authors also thank Dr Ana María Fernández for reading the manuscript and for providing many helpful comments.
SUPPLEMENTARY INFORMATION
Supplementary data associated with this article are given in a separate file (Supplementary Information). The first section of the Supplementary Information contains the details about the XRD powder patterns of uranophane-α. In this section, Fig. S1 shows the corresponding computed and experimental X-ray powder patterns and Table S1 gives the values of the positions and intensities of the main reflections. The second section shows a comparison of the computed X-ray powder patterns of Ca- and Sr-exchanged uranophanes (Fig. S2). Finally, the last section contains some details of the Raman spectra of this material. Namely, Table S2 gives a comparison of experimental Raman shifts of uranophane-α taken from several sources, and Fig. S3 provides graphical pictures of the Raman normal modes of uranophane-α.
The supplementary material for this article can be found at https://doi.org/10.1180/clm.2018.27.


