Heavy metals pose a serious environmental concern owing to their toxicity and abundance. They enter into aquatic environments, causing various health problems to human beings and animals because of their non-degradable, persistent and accumulative nature (Fu & Wang, Reference Fu and Wang2011; Uddin, Reference Uddin2017). However, some heavy metals are essential, being vital to the health of a vast variety of entities (humans, plants, animals and microorganisms), although they can cause harm in excessive concentrations (Hu, Reference Hu and McCally2002). For instance, in humans, Cu is involved in a series of metabolic processes as an important enzymatic co-factor, while Ni is essential for microorganisms that colonize the human gut (Brewer, Reference Brewer2003). However, evidence of any distinct benefit from nickel supplementation in human tissues is lacking (Brewer, Reference Brewer2003, Reference Brewer2014). On the other hand, evidence of a relationship between high levels of copper and Alzheimer's disease and potential carcinogenesis has been found (Harris, Reference Harris2003; Magave et al., Reference Magave, Zhao, Bowman and Ding2012), while nickel is associated with a vast array of diseases and is considered to be one of the most common contact sensitizers causing allergic dermatitis (Kurniawan et al., Reference Kurniawan, Chan, Lo and Babel2006; Sharma, Reference Sharma2006, Reference Sharma2013).
Several techniques such as chemical precipitation, evaporation, solvent extraction, ion exchange, electrochemical treatment and membrane filtration technologies, etc., have been utilized for heavy-metal removal. Adsorption is a suitable technique with competitive advantages compared to other techniques, including low cost, ease of operation, efficiency and effectiveness (Cheremisinoff, Reference Cheremisinoff1995; Bhattacharya et al., Reference Bhattacharya, Mandal and Das2006), which can be amplified when low-cost adsorbents are utilized. Various clays and clay minerals have attracted attention as effective adsorbents for the efficient removal of heavy-metal ions from aqueous solutions (Srinivasan, Reference Srinivasan2011; Uddin, Reference Uddin2017 and references therein). Clays have advantages compared to other adsorbents because they are low cost, widespread, have large specific surface areas and significant potential for ion exchange (Malamis & Katsou, Reference Malamis and Katsou2013; Hojati & Landi, Reference Hojati and Landi2015; Uddin, Reference Uddin2017).
Palygorskite is a Mg-Al silicate mineral with a three-dimensional, chain-like inverted crystal structure that gives rise to a fibrous morphology. Its open-channel structure that is simultaneously negatively charged due to isomorphic substitutions, along with the large specific surface area, ensure its large adsorption capacity (Murray, Reference Murray1999). On the other hand, vermiculite is a 2:1 Al-Fe-Mg silicate mineral with hydrated exchangeable cations compensating the negative layer charge, which contribute to high cation-exchange capacity (CEC) (Xueyi & Inoue, Reference Xueyi and Inoue2003; Stylianou et al., Reference Stylianou, Inglezakis, Moustakas, Malamis and Loizidou2007).
In this study, the ability of palygorskite and vermiculite to adsorb Cu2+ and Ni2+ ions from aqueous solutions was investigated. More specifically, the effects of several operating parameters such as contact time, clay amount, solution pH and initial metal concentration were investigated. Furthermore, kinetics studies were employed to propose plausible adsorption mechanisms.
MATERIALS AND METHODS
Clay minerals
The natural clays used in the present study were palygorskite (ATP) mined from the Ventzia basin, Grevena (western Macedonia, Greece), and vermiculite (VRM) from the Askos area (northern Greece). The palygorskite sample was considered to be the alteration product of primary ultramafic rocks of the Vourinos complex (Kastritis et al., Reference Kastritis, Kacandes, Mposkos and Eliopoulos2003), while vermiculite was considered to be a product of mica alteration in serpentinized ultramafic rocks along their contacts with two-mica gneisses (Tsirambides & Michailidis, Reference Tsirambides and Michailidis1999). The samples were ground, sieved to obtain the <63 μm particle-size fraction, and used in adsorption experiments without chemical treatment.
Characterization of natural clays
Mineralogical characterization of the clay samples was performed by X-ray powder diffraction (XRPD) using a Philips PW1710 diffractometer. Ni-filtered CuKα radiation was used energized to 35 kV and 25 mA, in the range 3–63°2θ at a scan speed of 1.2°/min. The Fourier Transform Infrared Spectra (FTIR) of the studied clays were recorded (4000–400 cm−1) with a Perkin-Elmer FTIR Spectrum 1000 spectrometer at a resolution of 4 cm−1 using the KBr pellet technique. A scanning electron microscope (JEOL JSM-840A) was used to analyse the morphological characteristics of the studied clays before and after adsorption. Spot elemental analyses and X-ray mapping were obtained using an X-ray energy dispersive spectrometer-EDX (INCA 300). The chemical composition of the clays was determined following a three acid (HF, H2SO4 and HClO3) digestion in autoclaves according to Bourliva et al. (Reference Bourliva, Michailidis, Sikalidis and Filippidis2013a). The CEC was determined after saturation with sodium (sodium acetate solution buffered at pH 8.2), removal of the excess sodium with ethanol, and replacement of exchangeable sodium with ammonium acetate solution buffered at pH = 7 (Alexiades & Jackson, Reference Alexiades and Jackson1966). The specific surface area, pore volume and pore size of the clays were determined from N2 adsorption-desorption isotherms using a surface area and porosimetry analyzer (Micromeritics, TriStar 3000). The N2 adsorption-desorption isotherms were measured at 77 K after outgassing the samples at 250°C for 18 h.
Adsorption experiments
The experimental adsorption equilibrium data were obtained in batch-adsorption mode. The experimental procedure was described previously by Bourliva et al. (Reference Bourliva, Michailidis, Sikalidis, Filippidis and Betsiou2013b, Reference Bourliva, Michailidis, Sikalidis, Filippidis and Betsiou2015). In brief, 100 mL of a single metal solution and a pre-weighed clay amount were poured into centrifugal vials and placed on a vertical rotary shaker (10 turns/min) for a desired time interval for equilibrium to be attained, centrifuged at 3000 rpm for 15 min, and the final concentration of each metal was determined by Atomic Absorption Spectroscopy (AAS). Metal solutions with known initial metal concentrations were prepared at a specific pH by mixing proper volumes of 0.01 M HNO3 and NaOH solutions. The pH was monitored before and after adsorption. All measurements were made in duplicate and the average values were reported. Blank experiments both without clay and without metal were also performed. The experimental conditions maintained for the different operating parameters such as pH of suspension, adsorbent amount, contact time and metal concentration were as follows:
(1) Effect of pH: Clay dosage 1 g L−1, initial metal concentration 50 mg L−1, temperature 303 K, contact time 120 min, pH range 2.0–6.0 for Cu2+ and 2.0–8.0 for Ni2+ ions
(2) Effect of clay dosage: Initial metal concentration 50 mg L−1, temperature 303 K, pHNi 4.85 and pHCu 5.10, contact time 120 min, adsorbent dosage 1, 3, 5, 7, 9, 10 g L−1
(3) Kinetic study: Clay dosage 1 g L−1, initial metal concentration 50 mg L−1, temperature 303 K, pHNi 4.85 and pHCu 5.10, contact time 20, 40, 60, 90, 120, 180, 240, 360 min
(4) Adsorption isotherms-counterbalanced ions: Clay amount 1 g L−1, temperature 303 K, pHNi 4.85 and pHCu 5.10, contact time 120 min, initial metal concentration 5, 10, 25, 50, 75, 100, 250 mg L−1. The concentrations of Ca2+, Mg2+, K+ and Na+ were measured in the supernatant solutions after the experiments.
The amount, q e, of the Cu2+ and Ni2+ ions adsorbed per unit mass of the adsorbent and the extent of removal (%) were calculated using the following equations:
 $$q_{\rm e} = \displaystyle{{\left( {C_{\rm o} - C_{\rm e}} \right)V} \over m}$$
 $$\% {\mathop{\rm Re}\nolimits} {\rm moval} = \displaystyle{{\left( {C_{\rm o} - C_{\rm e}} \right)} \over {C_{\rm o}}}100$$
where C o (mg L−1) is the initial Cu2+ or Ni2+ concentration in the solution, C e (mg L−1) is the concentration of Cu2+ or Ni2+ in the solution at equilibrium, m is the clay mass (g) and V is the solution volume (L).
RESULTS AND DISCUSSION
Clay characterization
Examination of the XRD patterns (Fig. 1) showed that ATP consists mainly of palygorskite (92%), minor nontronite (5%) and quartz (3%), while in the VRM sample, vermiculite (72%) along with mixed-layer biotite-vermiculite (hydrobiotite, 17%) and chlorite-vermiculite (corrensite, 11%) were detected. The XRD results were confirmed by the FTIR analysis (Fig. 2). The FTIR spectrum (Fig. 2) of ATP is typical of Fe-rich palygorskite exhibiting two bands at 3612 and 3552 cm−1 attributed to the structural OH-stretching vibrations of Al and Fe, while the stretching vibration at 3418 cm−1 was due to water in the palygorskite channels (Chahi et al., Reference Chahi, Petit and Decarreau2002; Suárez & García-Romero, Reference Suárez and García-Romero2006). Also, a very characteristic Si–O stretching pattern for palygorskite was presented with a high-frequency component at 1198 cm−1 and a doublet of low-frequency vibrations at 1030 and 988 cm−1 (Mendelovici, Reference Mendelovici1973; Frost et al., Reference Frost, Locos, Ruan and Kloprogge2001; Madejová et al., Reference Madejová, Balan, Petit and Christidis2011). The structural OH-stretching band at 3612 cm−1 along with the well-defined Al2OH deformation band at 915 cm−1 and a slight inflection near 862 cm−1 (AlMgOH) reflect the dominantly dioctahedral character of the ATP sample (Madejová & Komadel, Reference Madejová and Komadel2001). Additionally, the bands at 3552 cm−1 and 820 cm−1 assigned to Fe2OH stretching and bending, respectively, validated the presence of dioctahedral smectite (nontronite) in the ATP sample (Christidis et al., Reference Christidis, Katsiki, Pratikakis and Kacandes2010) and not trioctahedral smectite (saponite) as was assumed in earlier studies (Kastritis et al., Reference Kastritis, Kacandes, Mposkos and Eliopoulos2003). Quartz admixture (790 cm−1) was also revealed in ATP spectra. On the other hand, the spectrum of vermiculite (VRM) showed a strong, broad OH-stretching band at 3422 cm−1 characteristic of mixed-layer vermiculite samples (Muiambo et al., Reference Muiambo, Focke, Atanasova, Van Der Westhuizen and Tiedt2010). The band at 1006 cm−1 was ascribed to a Si-O-Si stretching.

Fig. 1. XRD patterns of the natural clays studied: palygorskite (upper) and vermiculite (lower). Inset are the patterns of the oriented (black line), glycolated (red line) and heated (blue line) samples. Pal: palygorskite (JCPDS card No. 31-0783), Sm: smectite (JCPDS card No. 29-1497), Q: quartz (JCPDS card No. 46-1045), VRM: vermiculite (JCPDS card 16-0613).
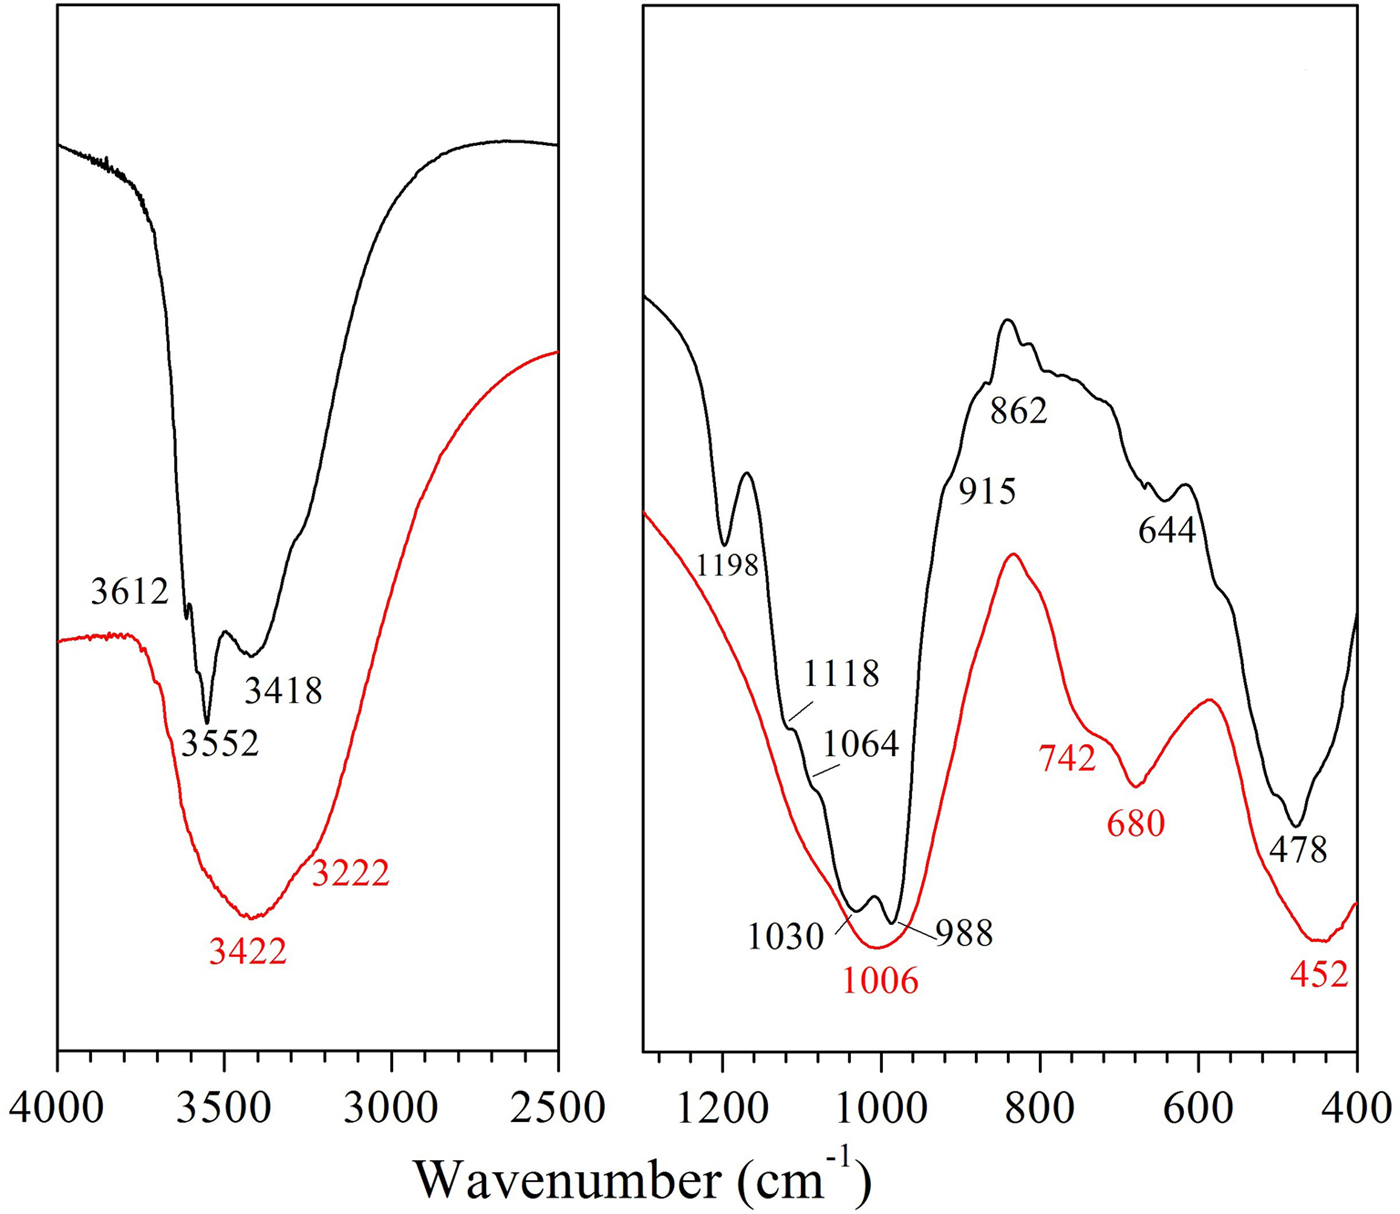
Fig. 2. FTIR spectra of the natural clays studied: palygorskite (ATP, black line) and vermiculite (VRM, red line).
The SEM images show a typical fibrous texture for attapulgite (ATP), while in the VRM, the mixed-layer phases were presented as brighter and darker regions (Fig. 3). The chemical compositions of the natural clays used, the CEC values and the textural properties of the clays are listed in Table 1.

Fig. 3. SEM images of the palygorskite (ATP, left) and vermiculite (VRM, right).
Table 1. Chemical composition (wt. %), CEC and textural properties of the natural clays studied.

1 LOI: loss on ignition, 2 bdl: below detection limit.
Effects of various parameters on the ability of adsorbents to remove Cu and Ni
Effect of pH
The initial pH value of the metal aqueous solution is a significant factor in the adsorption process and this controls the uptake of the metal ions at the adsorbent–clay interfaces. The effect of solution pH was investigated in the range 2–6 for copper and 2–8 for nickel, which avoids metal precipitation in hydroxide forms and maintains their cationic species (Bayat, Reference Bayat2002; Sen Gupta & Bhattacharyya, Reference Sen Gupta and Bhattacharyya2008); results are shown in Fig. 4. The adsorption of Cu2+ and Ni2+ ions was highly pH-dependent, and increased adsorption capacities, q e (mg g−1) with increasing pH were observed. As far as the efficiency of the studied clays is concerned, vermiculite took up more Cu2+ and Ni2+ ions at a given pH than palygorskite. The differences in amount adsorbed with pH, and particularly the reduced removal efficiencies for all studied cases at low pH, could be ascribed to: (1) the antagonism between the metal and H3O+ ions for the vacant adsorption sites on clay surfaces at substantially low pH values; and (2) surface protonation reactions lead to positively charged clay surfaces at lower pH and hence to increased repulsion forces between metal ions and clay surfaces, which prevent metal ions from accessing the surface binding sites. This ultimately leads to lower adsorption efficiency (Mathialagan & Viraraghavan, Reference Mathialagan and Viraraghavan2003; Sen Gupta & Bhattacharyya, Reference Sen Gupta and Bhattacharyya2008).
Fig. 4. Effect of pH on Cu2+, and Ni2+ adsorption by the natural clays studied. Contact time: 120 min; adsorbent dosage: 1 g L−1; initial metal concentration: 50 mg L−1.
Effect of clay amount
The effect of clay amount was studied by variation of dosages from 0.1 to 1 g L−1 and the results are presented in Fig. 5. In VRM a dose of 5 g L−1 exhibited removal efficiency of >90% for both Cu2+ and Ni2+ ions, while for ATP larger amounts are necessary to achieve satisfactory removal efficiencies. Generally, the adsorption extent, calculated as the % removal of Cu2+ and Ni2+ ions, increased with increasing clay dosage. This might be ascribed to the larger surface area and more binding sites available as the clay amount increased (Liu & Zhou, Reference Liu and Zhou2010; Sen & Gomez, Reference Sen and Gomez2011). A reverse trend was observed in adsorption capacity (q e) which decreased gradually with the increase in clay amount. This might be explained by: (1) the large clay quantities efficiently diminish the saturation of the adsorption sites resulting in the reduction of covered sites per unit mass and therefore to a lesser adsorption capacity; and (2) higher clay dosages led to aggregation phenomena which result in lower total surface area, and increased divisional path length, both of which lead to decreased adsorption capacity (Shukla et al., Reference Shukla, Zhang, Dubey, Margrave and Shukla2002).

Fig. 5. Effect of adsorbent dosage on Cu2+ and Ni2+ adsorption by the natural clays studied. Contact time: 120 min; initial pH: pHCu 5.10, pHNi 4.85; initial metal concentration: 50 mg L−1.
Effect of contact time and adsorption kinetics
The effect of contact time on the adsorption of Cu2+ and Ni2+ ions was investigated at various time intervals in the range 20–360 min and the results are presented in Fig. 6. The removal of Cu2+ and Ni2+ ions increased rapidly in both clays in the first 20 min of adsorption, while negligible differences in the removal of metal ions were noted after ~60 min of contact, indicating that adsorption equilibrium was established. This might be attributed to the high rate at which adsorption takes place on the free surface in the first stage of adsorption, while, as the sites were filled with the metal ions, the rate decreased (Srivastava et al., Reference Srivastava, Mall and Mishra2008). The adsorption capacities recorded for vermiculite were significantly higher than those for palygorskite, indicating its better applicability.

Fig. 6. Effect of contact time on Cu2+, and Ni2+ adsorption by the natural clays studied. Initial metal concentration: 50 mg L−1; initial pH: pHCu 5.10, pHNi 4.85; adsorbent dosage: 1 g L−1.
In order to investigate the adsorption mechanism, and particularly the adsorption rate, various kinetic models (data not shown) were used. The best-fit kinetic model was evaluated by the linear coefficient of determination (R 2) and the experimental (q e,exp) and calculated (q e,cal) adsorption capacities. Larger R 2 values and the smaller variations in q e values were observed for a pseudo-second-order kinetic model (Table 2), which is expressed by equation 3 (Ho & McKay, Reference Ho and McKay1998) as follows:
 $$\displaystyle{t \over {q_{\rm t}}} = \displaystyle{1 \over {(k_2q_{\rm e}^2 )}} + \displaystyle{1 \over {q_{\rm e}}}t$$
where q t and q e are the adsorption capacities at time t (min) and equilibrium time (mg g−1), respectively and k 2 (g mg−1 min−1) is the rate constant of the pseudo-second-order adsorption, which better described the experimental kinetic data.
Table 2. Parameters of the pseudo-second-order kinetic model for adsorption of Cu2+ and Ni2+ ions by the natural clays studied.

Adsorption isotherms
The experimental data obtained from the adsorption isotherm studies are essential for assessment of the surface properties and the affinity of an adsorbent for a specific sorbate, both of which are critical in optimizing its usage. The adsorption isotherms for Cu2+ and Ni2+ are presented in Fig. 7. The increase in the initial metal concentration resulted in an increase of the adsorption capacity. The isotherms were of L-type (Giles et al., Reference Giles, Smith and Huitson1974) indicating a high affinity between sorbent and solute. Τhe Cu2+ and Ni2+ ions adsorbed per unit mass of the natural clays studied were expressed as a percentage of the CEC and the results are given in Fig. 8. Even for an initial Cu2+ concentration of 250 mg/L, almost 66% and 78% of the available exchangeable sites of ATP and VRM samples were covered, respectively. Correspondingly, almost 64% and 98% of the available sites of ATP and VRM were covered with Ni2+, respectively.

Fig. 7. Adsorption isotherms for Cu2+ and Ni2+ ions. The lines represent a non-linear fit of the Langmuir isotherm.
Fig. 8. The amounts of Cu2+ and Ni2+ ions adsorbed in different initial concentrations, expressed as a percentage (%) of the CEC of the natural clays studied.
With a view to understanding the mechanism of Cu2+ and Ni2+ adsorption onto the ATP and VRM samples, the experimental data obtained were tested with the Langmuir, Freundlich, Dubinin–Radushkevich (D–R), Temkin and Halsey isotherm models. The adsorption isotherm models equations are shown below (equations 4–8):
 $$q_{\rm e} = \displaystyle{{q_{\rm m}{\rm b}C_{\rm e}} \over {(1 + bC_{\rm e})}}$$
where q e (mg g−1) is the adsorption capacity at equilibrium, C e (mg L−1) is the concentration of the sorbate at equilibrium, b (L mg−1) is the Langmuir equilibrium constant associated to the energy of adsorption and q m (mg g−1) denotes the theoretical Langmuir monolayer adsorption capacity.
 $$q_{\rm e} = K_FC_{\rm e}^{1/{\rm n}} $$
where KF (mg1−n Ln g−1) and n (dimensionless) are Freundlich constants related to adsorption capacity and sorption intensity, respectively.
 $$q_{\rm e} = Q_{\rm m}e^{ - {\rm \beta \varepsilon} ^2}$$
where Q m (mol g−1) is the Dubinin–Radushkevich monolayer capacity, β (mol2 kJ−2) is a constant related to sorption energy, and ε represents the Polanyi potential constant which is related to the equilibrium concentration and is given as  $\varepsilon = {\rm R}T\ln (1 + \displaystyle{1 \over {C_{\rm e}}})$, where R is the gas constant (8.314.10−3 kJ mol−1 K−1) and T is the absolute temperature (K). Constant β gives the mean adsorption energy, E, of sorption per molecule of the sorbate when it is transferred to the surface of the solid from infinity in the solution and can be computed as
  $E = \displaystyle{1 \over {\sqrt {2{\rm\beta}}}} $
 $$q_{\rm e} = B_T\ln (\hbox{K}_{\rm T}C_{\rm e})$$
where B T (J mol−1) is related to the heat of adsorption and is given as  $B_T = \displaystyle{{{\rm R}T} \over {\hbox{b}_{\rm T}}}$, while bT is the Temkin isotherm constant and KT (L mg−1) is the equilibrium binding constant.
 $$q_{\rm e} = e^{\left[ {\displaystyle{{\left( {\ln {\rm K}_{\rm H} - \ln C_{\rm e}} \right)} \over {{\rm n}_{\rm H}}}} \right]}$$
where KH and nH are the Halsey isotherm constants.
The linear coefficient of determination, R2, was used to confirm the good fitness of each isotherm model to the experimental data, and the values along with the isotherms’ parameters are presented in Table 3. The highest values of R2 were observed for the Langmuir isotherm with the exception of Cu2+ adsorption onto VRM which follows the Freundlich isotherm model. The Langmuir equilibrium coefficient, b, was large with values of 42–94 L g−1 (Table 3) for the metal-ATP systems and even larger (130–203 L g−1) for the metal ion-VRM systems. The higher value of b (203 L g−1) for the adsorption of Ni2+ ions onto vermiculite showed that the interactions were stronger between nickel ions and vermiculite. The maximum adsorption capacity q m was 12.53 mg g−1 and 32.68 mg g−1 for Cu2+ for ATP and VRM, respectively, while for Ni2+ ions it was 11.57 mg g−1 and 37.85 mg g−1, respectively for ATP and VRM. The maximum adsorption capacities determined were higher in VRM than in ATP for both the Cu2+ and Ni2+ ions. Although the different experimental conditions applied make direct comparison between various adsorbents difficult, the adsorption capacities of the natural clays utilized in this study were notably higher than values reported from similar studies (Table 4). The separation factor, RL, values calculated by the equation RL=1/(1+bC 0), where C 0 (mg L−1) is the initial Cu2+ or Ni2+ concentration in the solution and b (L mg−1) is the Langmuir constant, varied between 0.33 and 0.141 indicating favourable adsorption.
Table 3. Adsorption isotherm models and parameter values for the adsorption of Cu2+ and Ni2+ ions on the studied clays.
Significant R2 values are marked in bold.
Table 4. Reported results on the adsorption capacities of various clay minerals for Cu2+ and Ni2+ ions.
The Freundlich isotherm model, based on multilayer adsorption, exhibited good applicability (R2 = 0.924–0.999). The estimated Freundlich adsorption constant (KF) was higher for vermiculite (Cu2+: 8.00, Ni2+: 11.39 mg1−n Ln g−1) compared to that of palygorskite (Cu2+: 4.20, Ni2+: 3.49 mg1−n Ln g−1). This is in accordance with the experimental results in which vermiculite exhibited higher adsorption capacities than palygorskite. The Freundlich coefficient n values ranging from 1 to 10 (3.41–5.27) support the favourable adsorption of Cu2+ and Ni2+ ions onto the studied natural clays.
The D–R model described the experimental data well with the exception of Cu2+ adsorption onto ATP which presented a lower R2 value (0.872) (Table 3). Within D–R parameters, the mean free energy (E) offers valuable information on the mechanism of adsorption. The E values were >8 kJ mol−1 (range 12.82–18.26 kJ mol−1) in all cases, suggesting the dominance of chemical adsorption of Cu2+ and Ni2+ ions onto ATP and VRM. The comparison of D–R and Langmuir models’ maximum monolayer capacity showed that the Langmuir model fitted the experimental data better than D–R isotherm. The Langmuir parameter (q m) was closer to the experimental capacity determined compared with the corresponding D–R parameter (Q m) which is higher than the experimental capacity value determined. Consequently, the Langmuir model explained better the Cu2+ and Ni2+ ions’ adsorption onto the studied natural clays than the Dubinin–Radushkevich model.
The Temkin isotherm (data not shown) provides a close fit to the data for adsorption of Cu2+ and Ni2+ onto vermiculite, but the experimental data for the adsorption of the metal ions studied onto ATP did not fit well in the concentration range studied (Table 3). The values of the Temkin constants BT, bT and KT are listed in Table 2. The BT values which are indicative of the heat of metal adsorption onto the studied natural clays were positive (1.022–4.448 J mol−1) suggesting an endothermic adsorption reaction. On the other hand, the Halsey isotherm plots for the adsorption of Cu2+ and Ni2+ ions onto the studied natural clays (data not shown) exhibited high R2 values (0.928–0.998) indicating a good fit of the experimental data and an accurate description of the sorption behaviour of Cu2+ and Ni2+ ions onto the studied clays (ATP and VRM) by the Halsey isotherm. The n H values of the adsorption of Cu2+ ions onto ATP and VRM were 5.27 and 3.41, respectively, while those for the adsorption of Ni2+ ions were 3.29 and 3.07, respectively, suggesting that the adsorbed molecules may form multilayers (Tang et al., Reference Tang, Chew, Chan and Raper2003).
Evaluation of adsorption mechanism
The retention of Cu2+ and Ni2+ ions by the clays is clearly an ion exchange process which is validated by the determination of Ca2+, Mg2+, Na+ and K+ ions released during Cu and Ni adsorption, in relation to the initial concentrations (Fig. 9). Also, the total release of positively charged ions (sum of Ca2+, Mg2+, Na+ and K+ ions) from the two clay adsorbents along with the total adsorbed and the residual Cu2+ and Ni2+ ions are shown.

Fig. 9. Concentrations of released K+, Na+, Ca2+, Mg2+ ions and total released cations (sum of K+ + Na++ Ca2++ Mg2+ ions) during Cu2+ (up), and Ni2+ (down) adsorption (adsorbed-residual) by palygorskite (a, c) and vermiculite (b, d). The contact time applied was 120 min. The measured CECs were ~0.58 meq/g for ATP and ~1.28 meq/g for VRM.
Briefly, in both the ATP and VRM clays, the amounts of Na+ and K+ ions released are small and remain almost invariable during Cu and Ni adsorption for the initial concentrations studied, indicating that they were not affected by the Cu and Ni adsorption. On the other hand, the amounts of the Ca2+ and Mg2+ ions released from the surfaces of both clays are greater, with the total released Ca2+ and Mg2+ contents from sample VRM being significantly greater than those from ATP. This is in accordance with the experimental results which showed higher adsorption capacity of the VRM for Cu2+ and Ni2+ ions than the ATP. The amounts of both Ca2+ and Mg2+ released from palygorskite increased with increasing initial metal concentration, while in vermiculite an increase in mainly Mg2+ ions was observed. The main reason for the increase in the release of Ca2+ and Mg2+ is the larger amounts of adsorbed Cu2+ and Ni2+ ions on the two clays by increasing their initial metal concentrations. Both clay adsorbents adsorbed successfully even higher Cu2+ and Ni2+ concentrations with simultaneous increase in Ca2+ and/or Mg2+ release.
In all studied cases, more cations were released than were metals adsorbed, indicating that ion-exchange reactions were more likely to predominate in Cu2+ and Ni2+ adsorption by both palygorskite and vermiculite (Fig. 9). Moreover, taking into account the CEC values of the natural clays (~0.58 meq/g for ATP and ~1.28 meq/g for VRM), it was clear that saturation was not reached. This observation indicated that Cu2+ and Ni2+ species occupy the exchange sites, forcing directly the release of counterbalanced ions through an ion exchange process and form outer-sphere complexes (Stumm, Reference Stumm1991):
 $$\left( { \equiv S - O^ -} \right)_2...C_{3 - n}^{n +} + M^{2 +} \rightleftharpoons \left( { \equiv S - O^ -} \right)_2...M^{2 +} + \left( {3 - n} \right)C^{n +}, $$
where S corresponds to framework Si or Al, C is the counterbalanced ion with charge n + (n = 1 or 2) and M is the studied metal Cu2+ or Ni2+.
A more detailed analysis of the chemical compositions of the surfaces of the natural clays used and the presence of Cu and Ni were investigated by elemental mapping using energy dispersive X-ray (EDX) (Fig. 10). The Si, Al, Fe and Mg corresponding micrographs for the two natural clays indicated the distribution of the functional groups formed on the surface. The presence of copper and nickel adsorbed on attapulgite and vermiculite showed uniform distribution in all cases (Fig. 10).

Fig. 10. SEM-EDX mapping images of the natural clays studied after (a) Cu2+ and (b) Ni2+ adsorption.
CONCLUSIONS
The present work aimed to study the use of a set of natural, low-cost clays in their capacity to adsorb Cu2+ and Ni2+ ions for environmental applications. Parameters that affect the ability of vermiculite and palygorskite to remove Cu and Ni were evaluated and the mechanistic model that best describes the process was determined. The experimental results indicated that adsorption of Cu2+ and Ni2+ ions by the studied clays was heavily dependent on pH, while an increase in mineral amount increased in turn the removal percentage. The adsorption kinetics were rapid with equilibrium being established in ~60 min and followed the pseudo-second-order kinetic model. The adsorption isotherms were better simulated by the Langmuir model with the exception of Cu2+ adsorption to vermiculite which was better fitted by the Freundlich model. The maximum adsorption capacities for Cu2+ were 12.53 mg g−1 and 32.68 mg g−1 for palygorskite and vermiculite, respectively, while the corresponding values for Ni2+ ions were 11.57 mg g−1 and 37.85 mg g−1, respectively. The proposed ion-exchange mechanism was verified indirectly by the fact that a gradual increase of exchangeable Ca2+ and Mg2+ ions was followed by an increase in the adsorption capacity with increasing initial concentration.
ACKNOWLEDGMENTS
Part of this study was co-financed by the European Union (European Social Fund – ESF) and Greek national funds through the Operational Program “Education and Lifelong Learning” of the National Strategic Reference Framework (NSRF) – Research Funding Program: Heraclitus II: Investing in knowledge society through the European Social Fund. The authors extend their thanks to the Greek local authorities in the regions of western and central Macedonia, Greece, for procedural facilitation with raw material collection.