


Phosphogypsum is a waste product of the phosphoric acid manufacturing process. It is produced in the form of a fine powder with a large calcium sulfate content. This process produces ~5 tons of phosphogypsum for every ton of phosphoric acid manufactured (Hammas et al., Reference Hammas, Horchani-Naifer and Férid2013).
According to the International Atomic Energy Agency (IAEA), annual phosphogypsum production worldwide is ~160 million tons, of which 50 million tons are produced in China and 40 million tons are produced in the USA (IAEA, 2013). Raw phosphogypsum is generally yellowish, which, along with its greyish grains, defines it as a low-grade gypsum material in traditional applications, such as in cements and mortars (Costa et al., Reference Costa, Fortes, Rocha, Cerqueira, Santos and Amaral2019). Primary impurities in phosphogypsum are phosphates, fluorides, organic substances and alkali metals (Hua et al., Reference Hua, Wang and Yao2016; Walawalkar et al., Reference Walawalkar, Nichol and Azimi2016).
The commercial use of phosphogypsum in the areas of agriculture, road construction, the cement industry and the manufacturing processes of other building materials is limited by the presence of the significant quantities of natural radionuclides, such as U, Ra and Th (Pérez-López et al., Reference Pérez-López, Macías, Cánovas, Sarmiento and Pérez-Moreno2016). However, there is still a lack of information regarding the potential release of metals and radionuclides during the lifetime of certain applications (Hua et al., Reference Hua, Wang and Yao2016; Cánovas, Reference Cánovas2018).
Naturally occurring radionuclides are the main sources of human exposure to ionizing radiation. The redistribution of these radionuclides in the environment through human activities should be considered for inclusion within the scope of regulation as naturally occurring radioactive materials (IAEA, 2013). Phosphate minerals, as a source of phosphogypsum, have significant natural radioactivity, originating from natural radionuclides that are members of the 238U and 232Th decay series. Sedimentary phosphate rocks contain high concentrations of uranium and low concentrations of thorium, while igneous rocks have lower concentrations of uranium and higher concentrations of thorium and rare earth elements (Moreira et al., Reference Moreira, Queiroga, Paiva, Medina, Fontana and Guazzelli2018). The concentration of 238U varies according to the mineral origin, from 260 to 1860 Bq kg–1 for apatite and from 460 to 640 Bq kg–1 for phosphorite (Saueia, Reference Saueia1998).
Through the manufacturing process, ~80% of 226Ra, 14% of 238U and 30% of 232Th tend to be enriched in phosphogypsum, and the rest remains in phosphoric acid (Jung et al., Reference Jung, Lim, Ji, Chung and Kang2017). This is due to the extremely low solubility product of RaSO4 (3.66 × 10⁻¹¹). Thus, large amounts of Ra are concentrated in phosphogypsum, while U and Th are transferred into the phosphoric acid. Through these chemical processes, the secular equilibrium between the specific decay series breaks down.
The main objective of this study was to extract and characterize purified gypsum, as well as insoluble impurities from raw phosphogypsum. A secondary objective was to examine natural radionuclide activities in samples of phosphogypsum from a waste deposit before and after the recrystallization process. The results obtained in this study may promote the potential utilization of purified phosphogypsum in the construction industry and in agriculture.
Materials and methods
Samples
The raw phosphogypsum samples were obtained from the waste landfills of the chemical company Elixir Prahovo (Serbia) (Fig. 1), which produces 165 000 tons of phosphoric acid annually (Elixir Prahovo, Reference Prahovo2018). Several subsamples were collected from two different points at the landfill and were mixed to produce two composite samples. The samples were dried at 50°C for 48 h and sieved through a 2 mm sieve. These raw samples, labelled as PG1 and PG2, were subjected to chemical, phase and morphological characterization, as well as activity concentration determination.

Fig. 1. Location of the phosphogypsum landfill.
Sample PG1, due to its higher activity concentration of 238U, was further subjected to the recrystallization process (Fig. 2). A total of 10 g of the sample was mixed with 2 L of distilled water in a beaker. Using a magnetic stirrer, the mixture was stirred for 2 h at ~45°C, allowed to settle for 2 h at the same temperature and filtered through filter paper. The filtrate was then heated in another beaker at 90°C, stirred with a magnetic stirrer for 1 h and allowed to settle for 7 h at the same temperature, allowing excess calcium sulfate to crystallize. Recrystallized gypsum was filtered and washed with boiling distilled water. The supernatant liquid was mixed with the phosphogypsum from the first beaker. This cycle was repeated several times until the PG1 sample was reduced to an insoluble residue. In this manner, the phosphogypsum was separated into recrystallized gypsum (PG1P), insoluble residue (PG1R) and supernatant. Using the available literature data and general knowledge of the phosphoric acid production process, the most significant impurities identified in raw phosphogypsum were detrital quartz (by volume), RaSO4 (by radioactivity) and ferric oxyhydroxides affecting the colour (e.g. Pérez-López et al., Reference Pérez-López, Macías, Cánovas, Sarmiento and Pérez-Moreno2016; Jung et al., Reference Jung, Lim, Ji, Chung and Kang2017). As all of these components are essentially insoluble in water, in contrast to calcium sulfate, the recrystallization procedure was employed to improve gypsum purity, radioactivity level and colour.
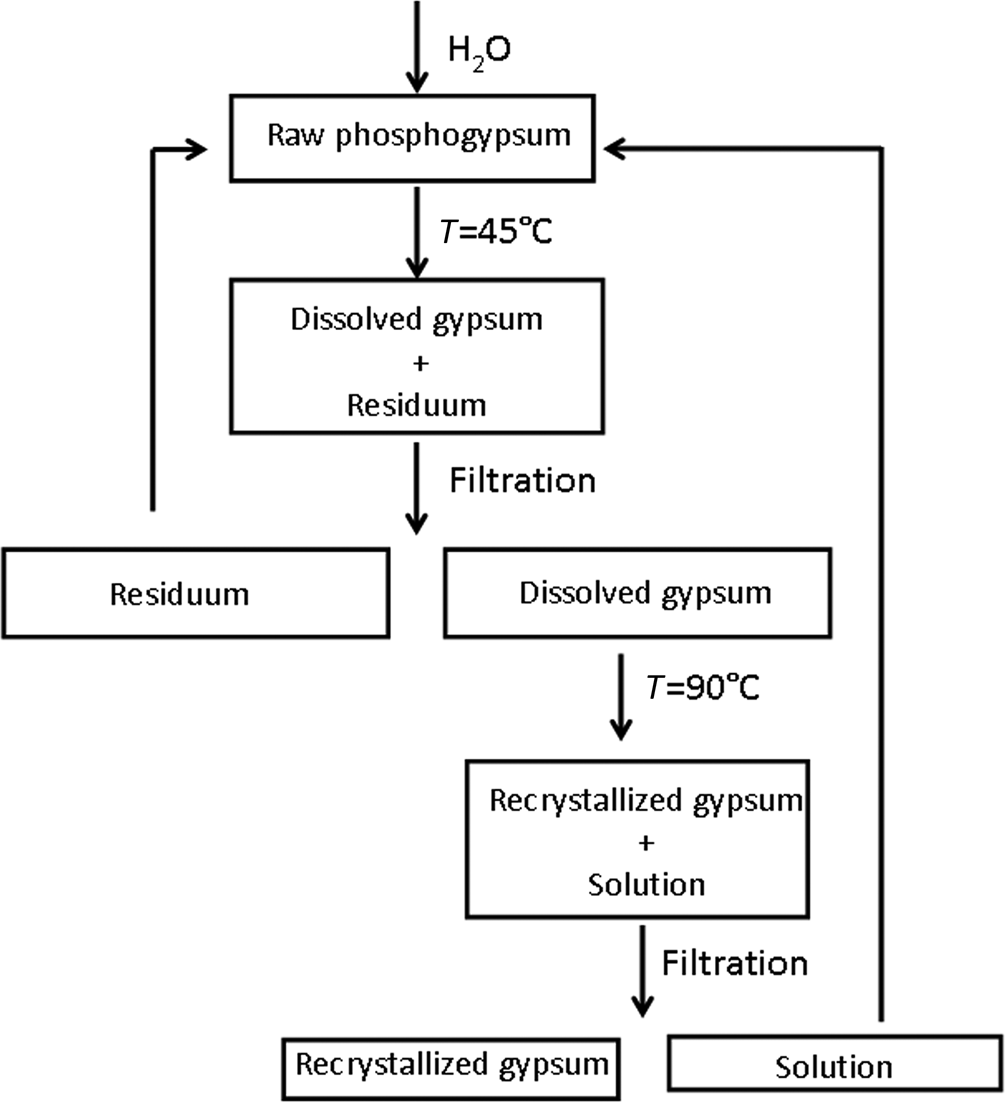
Fig. 2. Schematic overview of the recrystallization process.
The retrograde solubility of gypsum in water (slowly increasing from 0 to 40°C, with a subsequent decrease from 40 to 100°C; Rolnick, Reference Rolnick1954; Amjad, Reference Amjad1988; Azimi, Reference Azimi2010) was used as a driving mechanism for the recrystallization process. The mass balance of the recrystallization experiment for the PG1 sample is as follows: the yield of purified gypsum (PG1P) was 90.50%, with 4.29% of insoluble residue (PG1R) and 5.21% of the original mass in the supernatant.
Sample PG1P was also subjected to chemical analysis, phase and morphological characterization and activity concentration determination, while sample PG1R was subjected only to chemical characterization using scanning electron microscopy with energy-dispersive spectrometry (SEM-EDS).
Scanning electron microscopy
SEM-EDS analysis was performed using a JEOL JSM-IT300 SEM coupled with an Oxford Instruments XMax 50 mm2 silicon drift detector energy-dispersive spectrometer, in high-vacuum mode, at an accelerating voltage of 20 kV and a probe current of ~0.1 nA. For SEM imaging, the samples were coated with gold. The EDS elemental analyses were conducted using low magnification (50×) on carbon-coated samples.
Inductively coupled plasma optical emission spectrometry measurements
The chemical compositions of the PG1 and PG1P samples were determined using inductively coupled plasma optical emission spectrometry (ICP-OES) with a Thermo Scientific iCAP 6500 Duo ICP-OES spectrometer (Thermo Fisher Scientific, UK) equipped with a RACID86 charge injector device (CID) detector. The detection limit for the elements analysed was ~0.1 mg L–1. The digestion was performed in an Advanced Microwave Digestion System (ETHOS 1, Milestone, Italy) using an HPR-1000/10S high-pressure segmented rotor.
X-ray diffraction measurements
Mineralogical composition was determined using a Philips PW 1710 automated diffractometer, using Cu-Kα radiation (λ = 1.54184 Å) on randomly oriented powders in the range 4–60°2θ with a scanning step of 1° min–1. The tube current was set to 30 mA and the voltage to 40 kV. The identification of mineral phases followed the criteria recommended by Mikheev (Reference Mikheev1957) and the Joint Committee for Powder Diffraction Standards (JCPDS).
Whiteness index
In order to compare the quality of the samples for utilization in the construction industry, the whiteness index (WI) values of raw phosphogypsum and recrystallized gypsum were measured. The WI was determined from the luminous reflectance, as described by Milošević & Logar (Reference Milošević and Logar2017).
Radiometric measurements
For the activity concentration determination, the samples were placed in 120 cm3 cylindrical plastic containers. Sealing was performed to achieve radioactive equilibrium within the natural radioactive series for a period of 4 weeks. The activity concentration of radionuclides was determined using a high-purity germanium radiation detector of 50% relative efficiency. The detector was calibrated using a secondary reference material with a charcoal matrix in the same 120 cm3 cylindrical geometry (Pantelić et al., Reference Pantelić, Todorović, Nikolić, Rajačić, Janković and Sarap2015), spiked with standard radioactive solution ERX 9031-OL-427/12 (Czech Metrology Institute, Inspectorate for Ionizing Radiation). The radioactive solution contained 241Am, 109Cd, 139Ce, 57Co, 60Co, 137Cs, 203Hg, 113Sn, 85Sr, 88Y and 210Pb radionuclides with energies that ranged from 46.5 to 1898 keV and with a total activity of 72.4 kBq at the reference date of 31 August 2012. The samples of raw phosphogypsum were measured twice, before and after the sealing of the samples’ containers, and the purified gypsum sample was measured once, after the container was sealed.
By applying the γ-spectrometry method, the activity concentration of 238U was determined from its decay products 234Th (63 keV) and/or 234mPa (1000 keV). The decay products of 226Ra, 214Bi (609, 1120 and 1764 keV) and 214Pb (295 and 352 keV) were used for activity determination. The activity of 232Th was calculated using its daughter product 228Ac (338 and 911 keV). 40K was determined from its single line of 1460 keV γ-energy. The background spectrum was recorded regularly before or after sample counting. The measurement time was 60,000 s. The measurement uncertainty was ~10%.
For uniformity in exposure estimates, the radionuclide concentrations have been defined in terms of radium equivalent activity (Raeq) in Bq kg–1. This allows a comparison of the activity concentrations of materials containing various amounts of 226Ra, 232Th and 40K according to Eq. (1) (UNSCEAR, 2000):
 $${\rm Ra}_{\rm eq} = C_{\rm Ra} + 143\cdot C_{\rm Th} + 0.0 77\cdot C_{\rm K}$$
where C Ra, C Th and C K are the activity concentrations of 226Ra, 232Th and 40K in Bq kg–1, respectively. The limit for Raeq is 370 Bq kg–1, set by the report of the Organisation for Economic Co-operation and Development (OECD, 1979).
To assess the radiological hazard associated with the investigated samples of phosphogypsum, the γ index for construction materials was calculated using Eq. (2) (RS Official Gazette, 2018):
 $$I_{\rm \gamma} = \displaystyle{{C_{\rm Ra}} \over {\rm MPC\lpar Ra\rpar }} + \displaystyle{{C_{\rm Th}} \over {\rm MPC\lpar Th\rpar }} + \displaystyle{{C_{\rm K}} \over {\rm MPC\lpar K\rpar }}$$
where C Ra, C Th and C K are the measured concentrations and MPC(Ra), MPC(Th) and MPC(K) are the maximum permissible concentrations of 226Ra, 232Th and 40K, respectively. Equivalent values for building materials used for interior, exterior and civil engineering construction as a base for roads, playgrounds and other civil engineering constructions (under the overlay layer) are listed in Table 1.
Table 1. Maximum permissible concentrations (MPCs) for 226Ra, 232Th and 40K in building materials used for interiors, exteriors and in civil engineering construction.

In the present work, the α index, used for the assessment of the excess α radiation due to radon inhalation originating from the building materials, was determined using Eq. (3) (Pantelić et al., Reference Pantelić, Todorović, Nikolić, Rajačić, Janković and Sarap2015):
 $$I_{\rm \alpha} = \displaystyle{{C\lpar {}^{226}{\rm Ra}\rpar } \over {200}}$$
The external and internal hazard indices, H ex and H in, were defined using Eq. (4) and Eq. (5), respectively (UNSCEAR, 2000):
 $$H_{\rm ex} = \displaystyle{{C_{\rm Ra}} \over { 370}} + \displaystyle{{C_{\rm Th}} \over {{\rm 259\ }}} + \displaystyle{{C_{\rm K}} \over { 4810}}$$
 $$H_{\rm in} = \displaystyle{{C_{\rm Ra}} \over { 185}} + \displaystyle{{C_{\rm Th}} \over { 259}} + \displaystyle{{C_{\rm K}} \over { 4810}}\;\;\;\;\;\;$$
The values of these indices should be <1, to indicate that the radiation hazard is insignificant.
Results and discussion
Chemical analysis
For each sample, three areas of ~5 mm2 were analysed by SEM-EDS and the average results obtained are listed in Table 2. The PG1 and PG2 samples contain large amounts of Ca, S and O, as expected for the calcium sulfate-based material. The major impurity is Si, followed by small amounts of P, Al, Fe and Sr, which are typical of phosphogypsum from various deposits around the world (Jalali et al., Reference Jalali, Magdich, Jarboui, Loungou and Ammar2016; Zhou et al., Reference Zhou, Sheng, Li, Shu, Chen and Wang2016; Kandil et al., Reference Kandil, Cheira, Gado, Soliman and Akl2017).
Table 2. Chemical compositions (wt.%) of the samples investigated, obtained by SEM-EDS analysis.

a Calculated by stoichiometry.
b Quantitative results normalized to 100%.
BDL = below detection limit.
The recrystallized PG1P sample is enriched in calcium sulfate, containing only small amounts of Al, Si and P. A more precise chemical analysis of the two samples was performed by ICP-OES, confirming the enrichment of Ca and S and the drastic depletion of Si and Fe after recrystallization (Table 3). These results support the effectiveness of recrystallization, which removed most of the slightly soluble impurities, which contain Si, Fe, Al, Ti, etc., from phosphogypsum.
Table 3. Chemical compositions of the samples investigated, obtained by ICP-OES analysis.

XRD analysis
The XRD analysis showed that the most abundant phases in the PG1 and PG2 samples are gypsum (CaSO4⋅2H2O), brushite (CaHPO4⋅2H2O) and quartz (Fig. 3). These phases have also been identified in various phosphogypsum samples by various researchers (Roode & Strydom, Reference Roode and Strydom1999; Jalali et al., Reference Jalali, Magdich, Jarboui, Loungou and Ammar2016, Tian et al., Reference Tian, Yan, Hu, Xu, Chen and Shi2016). The XRD trace of PG1P is typical of pure gypsum (Fig. 3). The presence of other crystalline phases was not confirmed by XRD analysis, in accordance with the low levels of impurities obtained using SEM-EDS and ICP-OES elemental analyses. Specifically, in the PG1P sample, Al, Si and P calculated as oxides by stoichiometry amount to 1.02 wt.% in SEM-EDS analysis. In addition, 10 trace elements in ICP-OES analysis (Table 3) comprise 0.63 wt.%, which gives a low probability of detection in distinctive phase(s) by XRD analysis. The same applies for trace amounts of Na, Mg, Al, K, Ti, Fe, Sr and Ba in raw phosphogypsum (total 0.24 wt.% as oxides). The SEM-EDS, ICP-OES and XRD results confirmed that calcium sulfate dihydrate is the principal phase present in raw phosphogypsum samples, which is formed according to the chemical reaction in Eq. (6):
 $${\rm C}{\rm a}_{10}\lpar {{\rm P}{\rm O}_4} \rpar _6{\rm F}_2 + 10{\rm H}_2{\rm S}{\rm O}_4 + 20{\rm H}_2{\rm O} \to 10{\rm CaS}{\rm O}_4\cdot 2{\rm H}_2{\rm O} + 6{\rm H}_3{\rm P}{\rm O}_4 + 2{\rm HF}$$
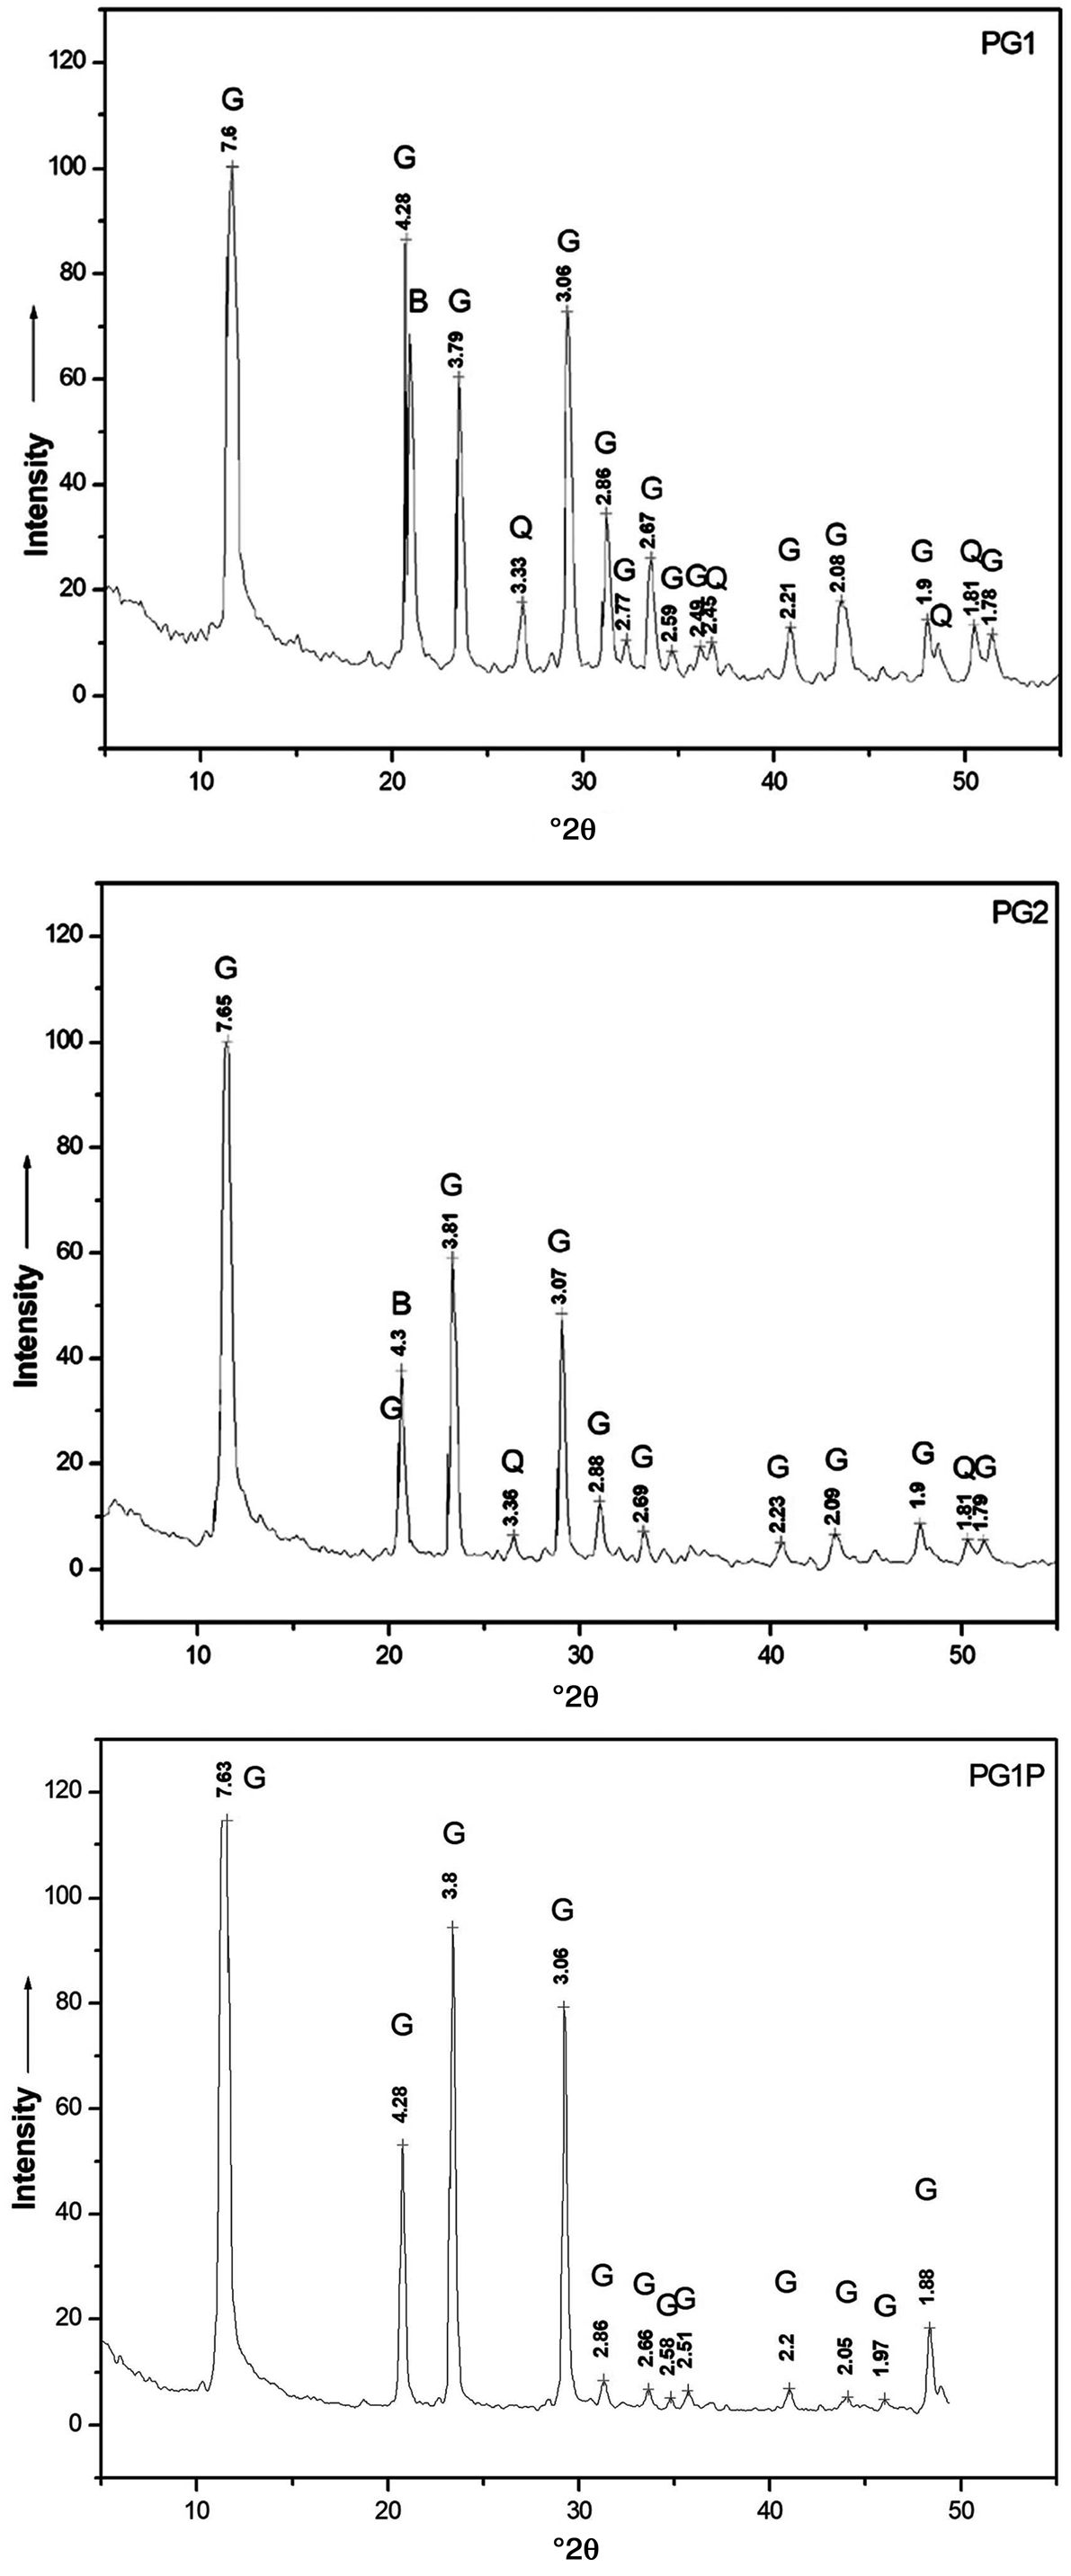
Fig. 3. XRD traces of investigated samples. The numbers correspond to the d-spacings of the main diffraction maxima (Å) of the phases present. B = brushite; G = gypsum; Q = quartz.
Quartz is the predominant Si-bearing phase, originating from the parent phosphate rock, as well as being precipitated by acid digestion of natural silicates and aluminosilicates. A relatively significant amount of phosphorus in raw phosphogypsum is present in the form of brushite, as was confirmed by XRD patterns (Roode & Strydom, Reference Roode and Strydom1999). Brushite formed similarly to gypsum, which is not surprising as these are isostructural mineral phases (see Eq. (7)) (Mikheev, Reference Mikheev1957):
 $${\rm C}{\rm a}_{10}\lpar {{\rm P}{\rm O}_4} \rpar _6{\rm F}_2 + 9{\rm H}_2{\rm S}{\rm O}_4 + 20{\rm H}_2{\rm O} \to {\rm CaHP}{\rm O}_4\cdot 2{\rm H}_2{\rm O} + 9{\rm CaS}{\rm O}_4\cdot 2{\rm H}_2{\rm O} + 5{\rm H}_3{\rm P}{\rm O}_4 + 2{\rm HF}$$
During acid digestion of aluminosilicate minerals, Al3+ ions are first released and then chemically bonded in synthetic chukhrovite (Ca4.5Al2(SO4)F13·12H2O) (Fig. 4), according to the reaction in Eq. (8):
 $$13{\rm C}{\rm a}_{10}\lpar {{\rm P}{\rm O}_4} \rpar _6{\rm F}_2 + 123{\rm H}_2{\rm S}{\rm O}_4 + 266{\rm H}_2{\rm O} + 4{\rm A}{\rm l}^{3 + }\to 2{\rm C}{\rm a}_{4.5}{\rm A}{\rm l}_2\lpar {{\rm S}{\rm O}_4} \rpar {\rm F}_{13}\cdot 12{\rm H}_2{\rm O} + 121{\rm CaS}{\rm O}_4\cdot 2{\rm H}_2{\rm O} + 78{\rm H}_3{\rm P}{\rm O}_4 + 12{\rm H}^ + $$
Fig. 4. SEM image of mineral chukhrovite. Scale bar: 10 μm.
On the other hand, phosphogypsum was purified to a significant extent after the recrystallization process. Quartz and some other impurities (such as Ba in BaSO4, Ra in RaSO4, Ti in hydrated TiO2, Al in chukhrovite, Fe in ferric oxyhydroxide species, etc.), due to their poor solubility, remained in the insoluble residue, while highly soluble ions (Na+, K+, Mg2+) tended to concentrate in the supernatant. Although the solubility of brushite is a twelfth of that of gypsum, the recrystallization did not affect significantly the phosphorus content. This may be indicative of: (1) other P-bearing phases being present; (2) replacement of SO42– with HPO42– within the crystal structure of gypsum; or (3) shifting of the HPO42– + H2O ↔ H2PO4– + OH– equilibrium in the neutral water solution to the left compared to the highly acidic conditions of phosphate rock digestion with H2SO4. (Ca(H2PO4)2 has 100 times greater solubility than the less acidic CaHPO4⋅2H2O form.)
SEM analysis
The SEM analysis revealed a significant increase in the gypsum crystal size after the recrystallization (Fig. 5). Moreover, the z/x axis ratio increased from 1–3 to >5 for raw and recrystallized samples, respectively, producing long-bladed crystals. Stable laboratory conditions (temperature of 90°C, no stirring) promoted such crystal growth. A similar result was obtained with calcium sulfate whiskers synthesized from flue gas desulfurization of gypsum using the atmospheric acidification method (Sun et al., Reference Sun, Tan, Peng and Liang2016).

Fig. 5. SEM images of (a) PG1, (b) PG2 and (c,d) PG1P. Scale bars: 100 μm.
Whiteness index
The WI of 52.5%, determined for raw phosphogypsum (PG1), is too low for potential use in some industries (a value of 100% corresponds to a pure white colour). An increase of the WI to 80.5% after the recrystallization is in accordance with the ICP-OES and SEM-EDS analyses, which showed a significantly smaller Fe content in the purified gypsum. This increase in the WI benefits the potential use of recrystallized phosphogypsum in various industries. For example, in the Serbian cement industry, A-grade cements should have WI values >80%, so for gypsum to be used as one of the components of A-grade cements, it must comply with this standard (RS Official Gazette, 2014). Furthermore, chiefly high-strength gypsum of high whiteness is applied for interior decoration (Lushnikova & Dvorkin, Reference Lushnikova, Dvorkin and Khatib2016).
Activity concentration measurements
The phosphogypsum samples were analysed by means of γ-spectrometry to quantify radioactivity concentrations using a high-purity germanium detector. The results obtained are presented in Table 4. Similar phosphogypsum activity levels for the radionuclides 238U, 226Ra, 232Th and 40K have also been reported in other studies (Sahu et al., Reference Sahu, Ajmal, Bhangare, Tiwari and Pandit2014; Jung et al., Reference Jung, Lim, Ji, Chung and Kang2017). The activity concentration values for natural radionuclides before and after the sealing of the samples’ containers were within experimental uncertainty of the measurements, except in the case of 238U and 40K (Table 4). This is in accordance with the work of Ji et al. (Reference Ji, Lim, Kim, Kim, Lim and Chung2017), who reported that in chemically processed materials such as phosphogypsum, 226Ra may be accurately quantified in hermetically sealed samples using γ-spectrometry, but not 238U.
Table 4. Activity concentration values of phosphogypsum samples (PG1 and PG2) and purified gypsum (PG1P).

a Samples measured before the sealing of sample container.
Further analysis showed that after the recrystallization process, the activity concentration of 226Ra decreased by approximately five- to six-fold, and for other natural nuclides, their activity concentrations were below the minimum detectable level. During recrystallization, all radionuclides precipitated in the insoluble residue due to their poor solubility. In addition, the main radiation risk of the investigated samples comes from 226Ra activity concentrations, which could be accurately determined using γ-spectrometry without attaining secular equilibrium.
The results of the radiological hazard assessments are listed in Table 5. The calculated values for the PG1 and PG2 samples were greater than the limiting values for Raeq (>370 Bq kg–1), the α index (I α >1), the external hazard index (H ex >1) and the internal hazard index (H in >1). Those values were approximately twice as high the maximum values recorded after measurement of 265 gypsum samples used as building materials in Serbia (260, 1.30, 0.70 and 1.41 for Raeq, I α, H ex and H in, respectively) (Pantelić et al., Reference Pantelić, Todorović, Nikolić, Rajačić, Janković and Sarap2015). After recrystallization, all of the calculated values decreased significantly (Table 5), being three to five times smaller than the maximum values of building materials (Pantelić et al., Reference Pantelić, Todorović, Nikolić, Rajačić, Janković and Sarap2015).
Table 5. Raeq, I α, H ex, H in and I γ values calculated for phosphogypsum samples (PG1 and PG2) and purified gypsum (PG1P).

a Samples measured before the sealing of sample container.
According to the γ-indices, with limiting values <1, the PG1 and PG2 samples should be rejected as materials for exterior and interior usage (Table 5) and may be used only in civil engineering construction as a base for roads, playgrounds and other civil engineering constructions. On the other hand, the PG1P sample, obtained after the recrystallization process, met all of the radiological hazard criteria associated with construction materials and can be used safely in construction projects.
Summary and conclusion
Two samples of phosphogypsum, obtained from the waste landfills of the chemical company Elixir Prahovo (Serbia), are dominated by Ca and S in the form of calcium sulfate dihydrate (i.e. gypsum; CaSO4⋅2H2O). The major impurity is represented by Si in the form of quartz. After applying a recrystallization process, the purified gypsum obtained was composed of very pure calcium sulfate dihydrate, containing only small amounts of phosphorus. There was a substantial increase in the gypsum crystal size, yielding a long-bladed crystal habit with an improved WI.
Based on γ-spectroscopic analysis, the mean activity concentrations of 238U and 226Ra in raw phosphogypsum samples are greater than the international recommended limits, while the opposite result was obtained for recrystallized gypsum.
For both phosphogypsum samples, the calculated values for Raeq, the α-index and almost all γ-indices were higher than the international recommended limits, except for the γ-index limit calculated for utilization in road construction. On the other hand, all of the calculated indices for the recrystallized gypsum were lower than the recommended limits. Therefore, the recrystallized gypsum satisfies all of these requirements and presents no radiation hazard when used as a building material, while raw phosphogypsum from the Elixir Prahovo waste landfills can be directly used only as a road construction material.
Acknowledgements
The authors are grateful to Professor George Christidis, Principal Editor of Clay Minerals, and three reviewers for their constructive suggestions and corrections, which greatly improved the paper. The authors are also grateful to Dobrila Nikolić, MA in English, for language and style corrections and to the chemical company Elixir Prahovo for providing the samples for analysis.
Financial support
The research was supported by the Ministry of Education, Science and Technological Development of the Republic of Serbia through Project No. 176010 and Project No. 43007.


