


Montmorillonite (MNT), a natural clay categorized in the smectite group (Bergaya et al., Reference Bergaya, Theng and Lagaly2006), is a dioctahedral 2:1 phyllosilicate consisting of one octahedral (O) sheet surrounded by two tetrahedral (T) sheets (Darvishi & Morsali, Reference Darvishi and Morsali2011b; Zhao et al., Reference Zhao, Luo, Wang and Huang2020) with various cations that occupy octahedral, tetrahedral and interlayer positions (Bergaya et al., Reference Bergaya, Theng and Lagaly2006). This structure is the primary mineral constituent of commercial smectite-rich raw bentonite; however, additional phases of quartz, feldspar, cristobalite, pearlite, carbonates, chlorite, kaolinite, mica and illite may also be present (Kaufhold et al., Reference Kaufhold, Dohrmann, Ufer and Meyer2002). MNT is used widely in various industries due to its physical and chemical properties, such as its cation-exchange capacity (CEC), large specific surface area and pore volume and great swelling ability, among others (Kaluđerović et al., Reference Kaluđerović, Tomić, Đurović-Pejčev and Životić2021). Impurities of low-grade bentonite limit its industrial applications, e.g. in the cosmetics industry, the food industries, packaging, nanocomposites, additives and water purification. It is noteworthy that some impurities such as quartz and cristobalite are carcinogenic, and the processing steps required to remove these are challenging to implement (Gong et al., Reference Gong, Liao, Lv and Wang2016). Therefore, bentonite purification is an unavoidable process in making bentonite suitable for the abovementioned applications, in which the purification level depends on the final proposed application, raw bentonite quality, processing costs and the critical amount of detrimental impurities allowed (Carrado et al., Reference Carrado, Decarreau, Petit, Bergaya, Lagaly, Bergaya, Theng and Lagaly2006).
The purification process of raw bentonite includes removing unwanted materials using chemical, physical or granulometric methods (Carrado et al., Reference Carrado, Decarreau, Petit, Bergaya, Lagaly, Bergaya, Theng and Lagaly2006). In chemical purification, various chemicals are applied to decompose carbonates (with sodium acetate or dilute hydrochloric acid), to dissolve oxides and hydroxides (with citrate solutions), to dissolve silicas (with acid oxalate solutions), to eliminate the iron oxide and to oxidize organic materials (with hydrogen peroxide and sodium hypochlorite; Ammann, Reference Ammann2003; Carrado et al., Reference Carrado, Decarreau, Petit, Bergaya, Lagaly, Bergaya, Theng and Lagaly2006). The threshold of the levels of chemicals allowed in some applications, such as those used in food industries, is one limitation of the chemical method (Gong et al., Reference Gong, Liao, Lv and Wang2016). One of the main advantages of the granulometric method in comparison with the chemical method is that no traces of chemicals can be found after the purification.
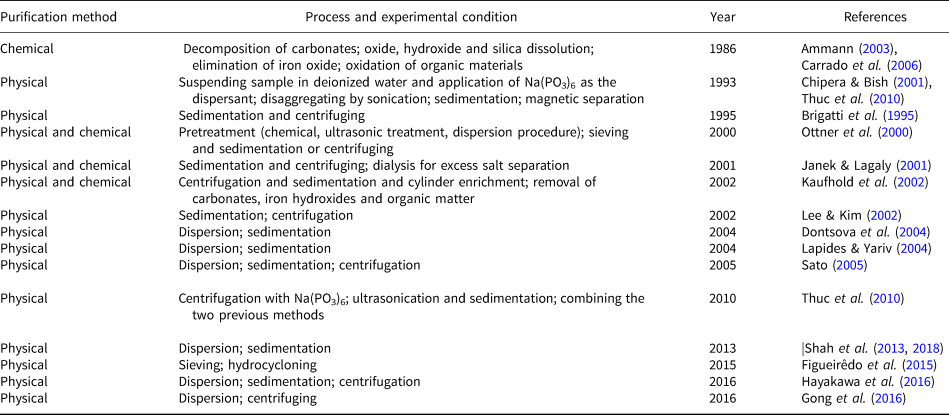
Based on the settling velocity, the granulometric method separates fine MNT particles from coarse impurities such as feldspar, calcite and quartz (Thuc et al., Reference Thuc, Grillet, Reinert, Ohashi, Thuc and Duclaux2010). This method includes dispersion and sedimentation or centrifuging, where Na(PO3)6 often acts as the dispersant (Brigatti et al., Reference Brigatti, Corradini, Franchini, Mazzoni, Medici and Poppi1995; Ottner et al., Reference Ottner, Gier, Kuderna and Schwaighofer2000; Chipera & Bish, Reference Chipera and Bish2001; Janek & Lagaly, Reference Janek and Lagaly2001; Kaufhold et al., Reference Kaufhold, Dohrmann, Ufer and Meyer2002; Lee & Kim, Reference Lee and Kim2002; Dontsova et al., Reference Dontsova, Norton, Johnston and Bigham2004; Lapides & Yariv, Reference Lapides and Yariv2004; Sato, Reference Sato2005; Bergaya et al., Reference Bergaya, Theng and Lagaly2006; Thuc et al., Reference Thuc, Grillet, Reinert, Ohashi, Thuc and Duclaux2010; Shah et al., Reference Shah, Valenzuela, Mannan, Díaz and Khattak2013; Figueirêdo et al., Reference Figueirêdo, Cartaxo, Silva, Silva, Neves and Ferreira2015; Hayakawa et al., Reference Hayakawa, Minase, Fujita and Ogawa2016).
The primary bentonite purification methods are reviewed in Table 1.
Table 1. Chronological review of extant research efforts on bentonite purification.
Sodium hexametaphosphate (NaHMP) has been used widely as a phosphate dispersant to purify bentonite physically. The absorption of negative charges ((PO3)n –) leads to the neutralization of the positive charges on the edges of the sheets. In addition, NaHMP increases the negative charge density of particles by creating an electrostatic barrier. By increasing this repulsive force, the clay slurry becomes more stable (Goh et al., Reference Goh, Leong and Lehane2011).
The ζ-potential determines the isoelectric point and stability of the MNT slurries. At the isoelectric point, bentonite dispersion can be optimized. The suspension is stable because the charges on the edges of MNT sheets are zero (Kelessidis et al., Reference Kelessidis, Tsamantaki and Dalamarinis2007); therefore, the repulsive force is maximized due to the negative charges of the surfaces of MNT flakes. When the pH of the suspension is greater than the pH of the isoelectric point, the edge charges are negative, creating a repulsive force between the edges and surfaces and stabilizing the suspension.
In ultrasonication, ultrasonic irradiation generates acoustic cavitation in a liquid medium, resulting in microbubble formation, growth and collapse (Kim, Reference Kim2016). The cavitational collapse causes extreme conditions, such as temperatures as high as 2000–5000 K and pressures up to 1800 atm inside the collapsed cavity, leading to mechanical effects such as microjets and shockwave impacts (Peters, Reference Peters1996; Lapides & Yariv, Reference Lapides and Yariv2004). These shockwaves can fracture fragile solids (Chatakondu et al., Reference Chatakondu, Green, Thompson and Suslick1987) and cause particle-size reduction (Peters, Reference Peters1996; Lapides & Yariv, Reference Lapides and Yariv2004). The effects of milling, particle size, concentration of suspensions, centrifuge time and speed, pH, ζ-potential and sedimentation time have not yet been investigated when using the granulometric approach.
For nanomontmorillonite synthesis, various approaches such as solvothermal (Darvishi & Morsali, Reference Darvishi and Morsali2011a), sonochemical (Darvishi & Morsali, Reference Darvishi and Morsali2011b), acid treatment (Yadav et al., Reference Yadav, Soni and Majumder2015), co-precipitation (Sirait et al., Reference Sirait, Gea, Bukit, Siregar and Sitorus2018), milling (Bukit et al., Reference Bukit, Frida and Harahap2013) and organoclay synthesis (He et al., Reference He, Ma, Zhu, Frost, Theng and Bergaya2014) have been utilized. Organically modified MNTs or organoclays, formed via the intercalation of quaternary ammonium cations, have long been used as rheological modifiers and additives in paints, inks, greases and cosmetics and as carriers and delivery systems for the controlled release of drugs. Perhaps the greatest single usage of organoclays has been in polymer–clay nanocomposites. Organoclays are also helpful in pollution control and water treatment (Calabi Floody et al., Reference Calabi Floody, Theng, Reyes and Mora2018).
Using the sonochemical and solvothermal methods, Darvishi & Morsali (Reference Darvishi and Morsali2011a, Reference Darvishi and Morsali2011b) synthesized nanowires and nanoparticles. Sirait et al. (Reference Sirait, Gea, Bukit, Siregar and Sitorus2018) synthesized nanobentonite with a small particle size using H2SO4 as a solvent via the co-precipitation method. Bukit et al. (Reference Bukit, Frida and Harahap2013) synthesized nanobentonite after 10 h of milling with a planetary mill.
He et al. (Reference He, Ma, Zhu, Frost, Theng and Bergaya2014) used various quaternary ammonium salts such as dodecyl trimethylammonium (DTMA) and hexadecyltrimethylammonium bromide (HDTMAB) for organoclay synthesis to increase their d-spacing via intercalation. These authors also discussed the basal spacings of organomontmorillonite prepared with various concentrations of HDTMAB in the solution. The d 001 value achieved in this research is greater than almost all of the values reported in previous research, which focused on the CEC of the untreated (parent) MNT and surfactant concentration in the solution.
The interlayer space can be increased using quaternary ammonium compounds such as hexadecyltrimethylammonium (HDTMA; Lee & Kim, Reference Lee and Kim2002) and cetyltrimethylammonium bromide (CTAB; Sayyahi et al., Reference Sayyahi, Jahanbakhshi and Dehghani2013; Shirzad-Siboni et al., Reference Shirzad-Siboni, Khataee, Hassani and Karaca2014) or anionic surfactants such as sodium lauryl sulfonate (SLS; Yu et al., Reference Yu, Ke, Deng, Lu, Ji, Hu and Zhao2018). If the length of the alkyl chain and concentration of cations increase, the interlayer space (d 001) will also increase. The greater the increase of the CEC of MNT, the greater the number CTAB molecules that could intercalate between the layers (He et al., Reference He, Ma, Zhu, Frost, Theng and Bergaya2014; Ltifi et al., Reference Ltifi, Ayari, Chehimi and Ayadi2018). The effects of purification on the CEC of MNT and the quality of nanomontmorillonite have not been investigated.
To the best of the authors’ knowledge, the optimization of parameters has not been reported regarding ultrasonication and dispersion/sedimentation methods for nanomontmorillonite synthesis. Impurities of the raw bentonite restrict the further application of bentonite because of the low quality of the synthesized nanomontmorillonite. In addition, this purification step improves the effects of surfactant in the synthesis of nanomontmorillonite. Therefore, bentonite purification is unavoidable for the affordable synthesis of high-quality nanomontmorillonite. In this research, ultrasonication and dispersion/sedimentation methods were used to design an efficient purification process (75%) for Iranian calcium bentonite for the cost-effective synthesis of nanomontmorillonite with a high exfoliation level. In this regard, the effects of milling type and time, particle size, concentration of suspensions, centrifuge time and speed, pH, ζ-potential and sedimentation time were investigated. While the dispersion/sedimentation method was more scalable than ultrasonication, the latter led to greater purity.
Materials and methods
Materials
The chemical composition of calcium bentonite (Tajeran Nemoone, Iran) used in this study was 11.31% Al2O3, 69.26% SiO2, 2.15% MgO, 0.77% K2O, 4.01% CaO, 1% Fe2O3 and 11.5% loss on ignition (LOI). The NaHMP (Sina Chemistry Company, Iran; 68%), deionized water (Sabalan Nanochemistry, Iran) and CTAB (Merck, Germany; >98%) were used as received.
Purification of raw bentonite
Method A: dispersion/centrifuging
Two samples of raw bentonite weighing 5.0 and 0.5 g were ground for 2 h in a planetary mill and jar mill (Sanat Ceram, Iran) with zirconia and alumina balls, respectively. The volume filling was 30% and the powder-to-ball weight ratio was 1:5. The ground powders were suspended in 100 mL of deionized water and added subsequently to 100 mL of NaHMP suspension (0.250 or 0.025 wt.%). Each mixed suspension was stirred for 24 h with a stirrer (MR Hei-standard, Heidolph, Germany). After that, the suspension was left unmoved for ~7 min to separate the upper part through the settling of the heavier particles. Then, the supernatant was centrifuged (Mini-Centrifuge, Aryanpaya, Iran) twice; details regarding the speed and time of centrifugation are presented in Table 2. The final supernatant was dried at 100°C for 24 h (Universal Oven U, Memmert, Germany).
Table 2. Experimental procedures for purifying bentonite with NaHMP using centrifugation and sedimentation methods A and B.

Method B: dispersion/sedimentation
Samples of 5 g of raw bentonite were ground for 2 h in a jar mill with alumina balls (volume filling of 30% and powder-to-ball weight ratio of 1:5). The ground powders were suspended in 100 mL of deionized water and added subsequently to 100 mL of NaHMP suspension (0.25 wt.%). Then, the mixed suspension was stirred for 24 h and left unmoved for ~50 h. Finally, after precipitation, the supernatant was dried at 100°C for 24 h.
Method C: ultrasonication treatment
Samples of 5.0 and 0.5 g of raw bentonite were ground using a jar or planetary mill for ~2 h and suspended in 1 L of deionized water. Each suspension was sonicated (Up400s, Hielscher Ultrasound Technology, Germany) for ~20 min, followed by stirring for 24 h and an additional sonicating stage for ~20 min. The mixtures remained unmoved for ~55 h to separate the supernatant from the sediment; then, deionized water was added to the sedimentation to reach a total volume of 1 L. This procedure was repeated at least three times. Finally, the collected supernatant at each step was dried at 100°C for 24 h. Tables 1 and 2 show the experimental procedures used in methods A, B and C.
Nanomontmorillonite synthesis
Nanomontmorillonite powder was synthesized using an exfoliation method with a planetary mill containing zirconia balls with a ball-to-powder weight ratio of 20:1, in which 2.5 g of purified bentonite and 0.875 g of CTAB were milled in the presence of 125 mL of deionized water for 2 h. Finally, the suspension was dried at 100°C for 24 h. The synthesized nanomontmorillonite samples SB and SRB were prepared by using the purified sample (PB5) and raw bentonite, respectively.
The experimental procedures for bentonite purification using NaHMP and ultrasonication are mentioned in Tables 2 and 3, respectively. Figure 1 provides a schematic of the experimental procedures for the purification of bentonite and nanomontmorillonite synthesis.
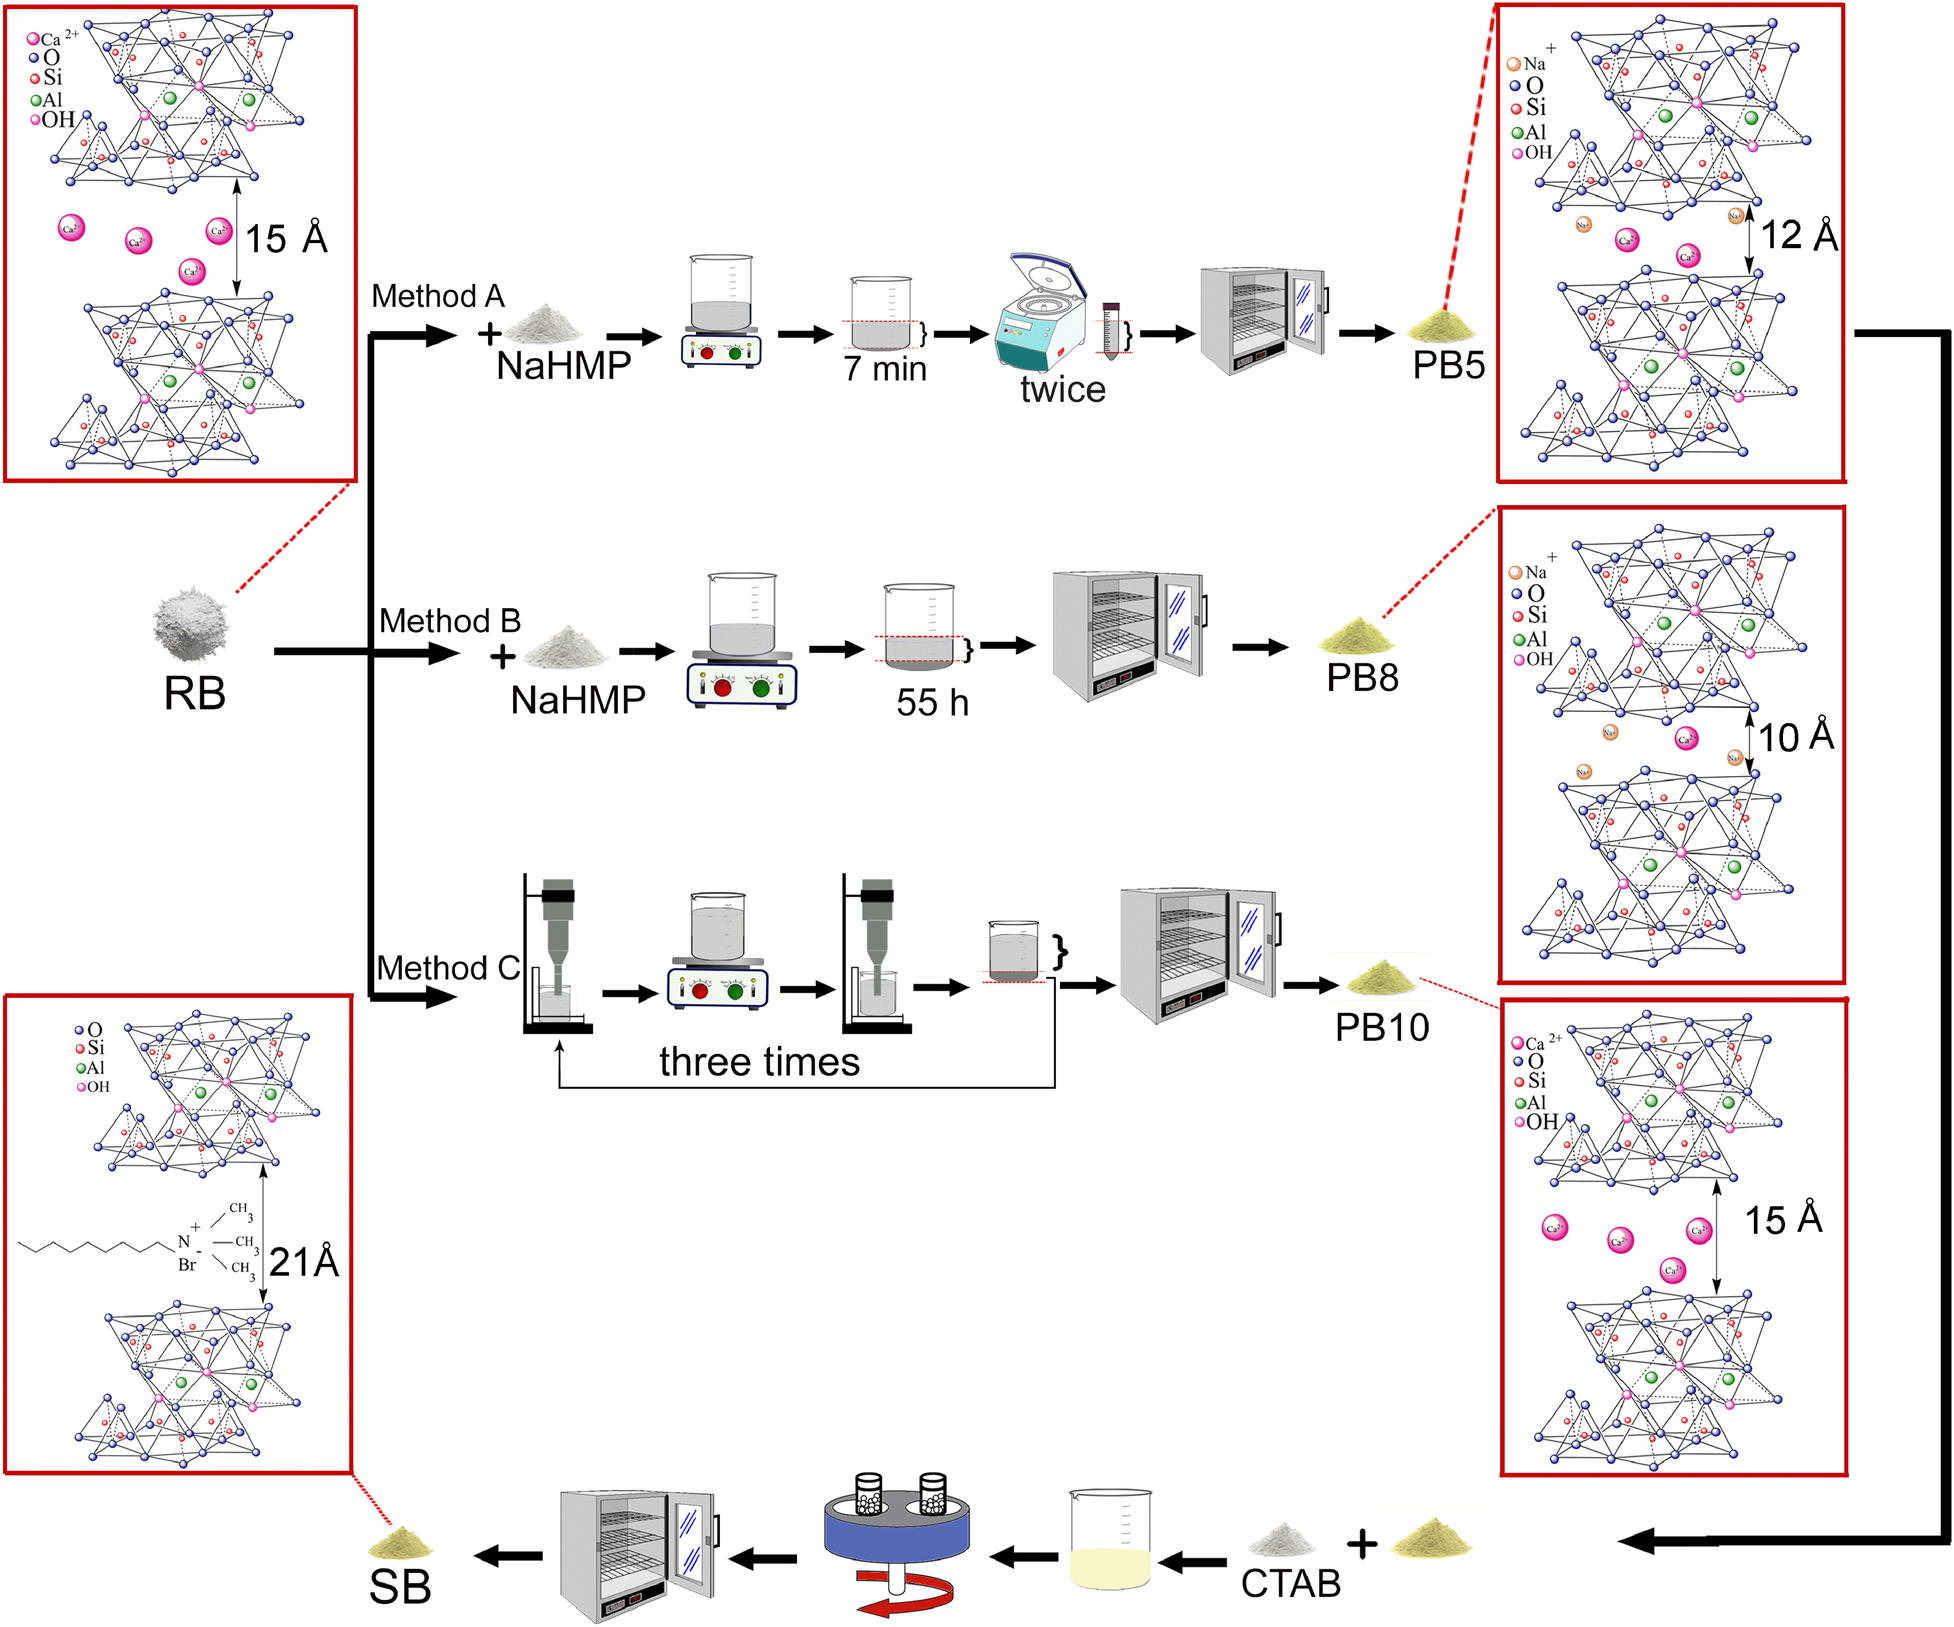
Fig. 1. Schematic of the experimental procedures for purifying bentonite and for the synthesis of nanomontmorillonite.
Table 3. Experimental procedures for purifying bentonite using ultrasonication method C.

Characterization techniques
The ζ-potential was measured using an SZ-100 instrument (Horiba Scientific Company, Japan). For this, 0.5 g of raw milled bentonite was added to 15 mL of deionized water to produce a suspension without light scattering. Next, NaOH and HCl were added to adjust the pH value using a pH meter (HI98107, HANNA Instruments, Romania). Finally, the suspensions were ultrasonicated in an ultrasonic bath (vCLEAN1-L3, Backer, Iran) for 30 min. The chemical composition of the raw bentonite was characterized using an X-ray fluorescence (XRF) spectrometer (PW1480, Philips, The Netherlands). Particle-size analysis was used to determine the particle-size distribution and the specific surface area (Mastersizer 2000, Malvern, UK). Phase analysis of the milled and sieved powders (200 mesh) was performed using X-ray diffraction (XRD; Advanced D8, Bruker, USA) with Cu-Kα radiation (λ = 0.154 nm) in the 2θ range of 0.8–8.0° (low angle) and 5–80° (normal mode), and the scan rate was 0.04°2θ s–1. Fourier-transform infrared (FTIR) spectroscopy (Avatar, Thermo Fisher Scientific, USA) was used to collect the FTIR spectra, and the morphology was investigated using scanning electron microscopy (SEM; Vega Tescan, Czech Republic) and energy-dispersive spectroscopy (EDS; XFlash 6-10, Bruker, Germany).
The CEC of the raw and purified bentonite was measured based on the following procedure: 5 g of the raw bentonite (RB) sample and purified bentonite were added to 33 mL of sodium acetate (1 N) separately, and the suspension was shaken for ~5 min. Then, it was centrifuged (sr1, Arminad Company, Iran) at 2500 rpm for 5 min (three times). Subsequently, 33 mL of ethanol was added to settle the particles, and the previous procedure was repeated. The electrical conductivity of alcohol was measured using a conductometer (HI98312, HANNA Instruments, Romania). If the value is <40 μmhos cm–1, the washing can be considered sufficient, but the washing should be continued if the value is greater than this threshold. All of the sodium acetates and soluble salts were removed as alcoholates.
After the washing stage, 33 mL of ammonium acetate was added to the washed bentonite. The suspension was shaken and centrifuged at 2500 rpm, each for 5 min, and the supernatant was separated and poured into a balloon of 100 cm3 (repeated twice). Finally, ammonium acetate was added to the filled balloon, and so ammonium ions were exchanged with all of the adsorbed Na+ ions. The amount of released sodium was determined using a flame photometer (PFP-7, Jenway Company, UK). The CEC was calculated according to Equation 1:

where V, A, C and W are the final volume (mL), sodium condensation (mg L–1), coefficient of dilution and mass of the sample powder (g), respectively.
Results and discussion
ζ-potential and particle-size analysis
The stability of the bentonite dispersion was determined using ζ-potential analysis to optimize the purification process. The ζ-potential vs pH and the particle-size distribution of milled and unmilled powders are shown in Fig. 2. Figure 2a shows the relation between the pH and ζ-potential in the 5 wt.% suspensions prepared from raw bentonite. The conditions of the ζ-potential analysis are given in Table S1.
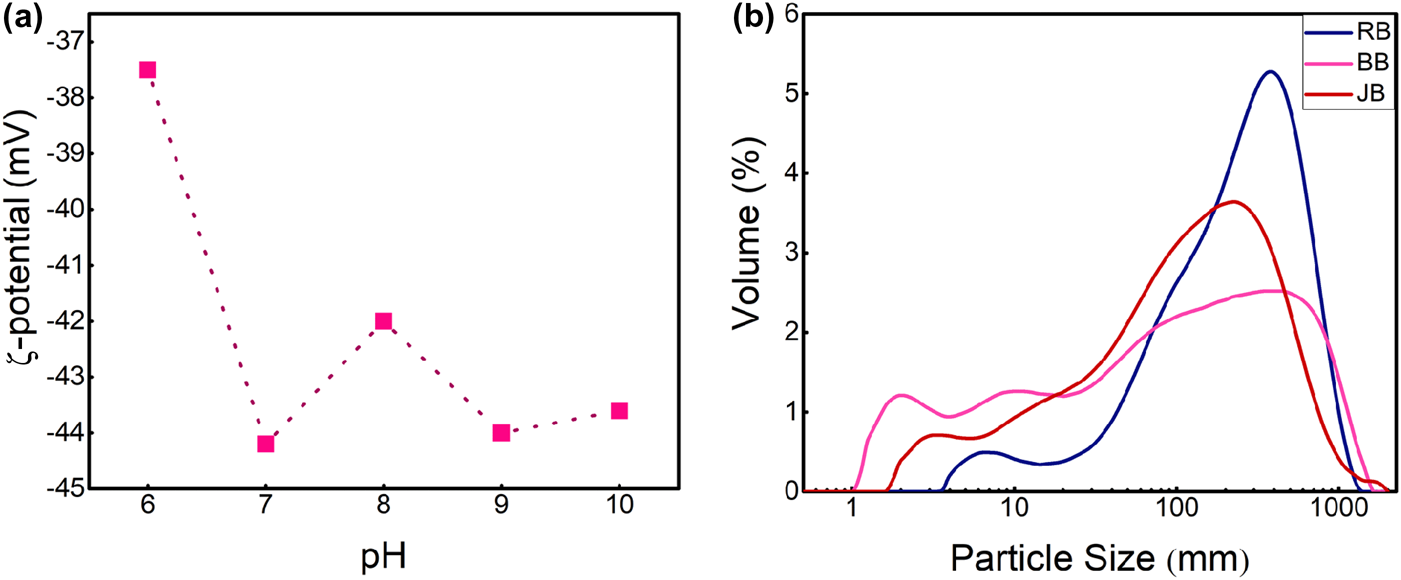
Fig. 2. (a) ζ-potential vs pH diagram of raw bentonite dispersion. (b) Volume percentage changes with particle size of unmilled raw bentonite (RB; d(0.1): 42 μm, d(0.5): 232 μm, d(0.9): 601 μm), planetary-milled raw bentonite (BB; d(0.1): 3 μm, d(0.5): 91 μm, d(0.9): 616 μm) and jar-milled raw bentonite (JB; d(0.1): 10 μm, d(0.5): 112 μm, d(0.9): 438 μm).
According to the measured ζ-potential, the stability of the dispersion is achieved at a ζ-potential of <–30 mV. The lower the value, the more stable the suspension (Emil & Gautam, Reference Emil, Gautam and Grumezescu2019). Therefore, the dispersion with pH = 7 is the most stable one.
In Fig. 2b, planetary and jar milling are shown to have reduced the initial size of the bentonite particles and resulted in a broader particle-size distribution than that of RB, where the planetary milling produced a more uniform particle-size distribution. In the planetary-milled raw bentonite (BB) sample, finer particles in the range of 1–10 μm represent a larger fraction than those of the same size range in the jar-milled raw bentonite (JB) sample. The percentages of particles in the 1–10 μm range in RB, BB and JB were 0.08%, 0.42% and 0.30%, respectively. In addition, the particle-size analysis indicated mean particle sizes (d 0.5) of 232, 91 and 112 μm for RB, BB and JB, respectively.
In summary, an appropriate grinding procedure could contribute to the uniform decrease in particle size needed for effective purification and post-processing steps.
Phase characterization
To purify the raw bentonite, XRD analysis of the samples (Fig. 3) was used to determine the optimal grinding conditions, pH value, centrifuge time and weight percentage of suspension for the dispersion method. XRD analysis was also applied to select the proper grinding conditions and weight percentage for the ultrasonication method.
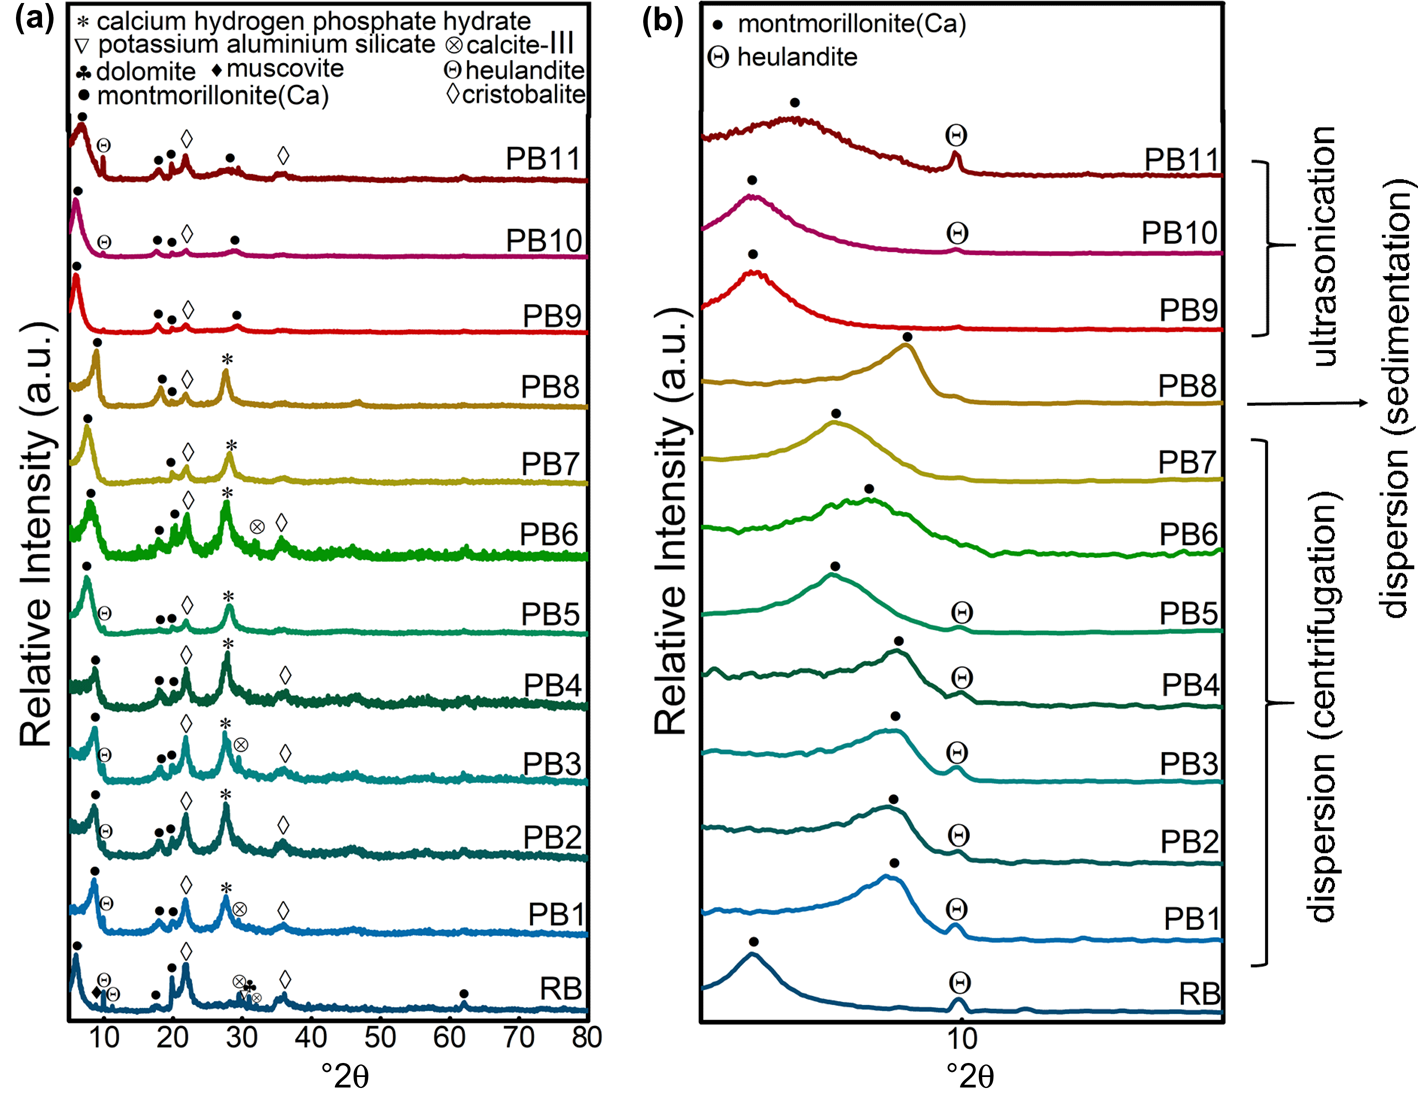
Fig. 3. (a) XRD traces of raw bentonite and purified samples obtained using methods A, B and C. (b) Low-angle-normalized XRD traces of raw bentonite and purified samples obtained using methods A, B and C in the range of 5–15°2θ.
Figure 3a shows the phase-identification results for purification methods A, B and C compared with raw bentonite. XRD analysis of the raw bentonite showed Ca-MNT (MNT-15A, reference code: 000130135) to be the primary phase; however, cristobalite (reference code: 000391425), feldspar (reference code: 000200848), heulandite (reference code: 010890582), muscovite (reference code: 010750948), dolomite (reference code: 000050622) and calcite-III (reference code: 000170763) were also noted. The XRD traces of all of the purified samples also indicated Ca-MNT as the primary phase and cristobalite, feldspar, heulandite, muscovite, dolomite and calcite-III as coexisting phases. The feldspar, dolomite and calcite peaks were removed largely as a result of the accuracy of the device used.
To select the optimal conditions, all of the samples purified using each method were self-compared and compared through a parallel comparison of normal and low-angle XRD analysis.
The cristobalite phase was not eliminated completely in all methods, although cristobalite removal in PB5 (prepared by centrifugation of a planetary-milled sample of a 2.5 wt.% bentonite and 0.125 wt.% NaHMP dispersion at pH 7) was much more promising. A detailed investigation of the effects of milling velocity and time, pH and concentration is discussed regarding samples PB1–PB8. In addition, the results showed that replacing planetary with jar milling was influential in eliminating unwanted phases when scaling up, as reflected in a comparison between the PB5 and PB7 samples.
Finally, PB5 – the most stable suspension – was selected for the synthesis step; it had a pH of 7 and a ζ-potential of –44.2 mV, as well as the greatest purity among all of the samples prepared according to method A. At pH 7, the positive charges on the edges of the particles were neutralized more effectively due to the attraction of NaHMP. This neutralization of the positive charges on the edges of the particles increased the net negative charge of the particles, which resulted in greater repulsion of the particles in the suspension (Goh et al., Reference Goh, Leong and Lehane2011). Thus, greater stability of the suspension was achieved, which led to more complete and straightforward precipitation of unwanted phases. The silica particles were stable in an aqueous solution with pH < 5. Therefore, the cristobalite phases were precipitated and removed by centrifugation, and the supernatant was collected for further processing (Franks, Reference Franks2002).
As the hardness of MNT particles (1.0–2.0 Mohs; Gong et al., Reference Gong, Liao, Lv and Wang2016) is less than that of cristobalite particles (4.5–7.0 Mohs; Wypych, Reference Wypych and Wypych2016), the milling process is more effective on MNT. When the raw bentonite is ground, the degree of freedom will increase, which helps the cristobalite particles to separate from the MNT particles (Patil & Pandit, Reference Patil and Pandit2007). In addition, the charge density would increase on the surfaces of the particles, which assists in the formation of stable suspensions and leads to easier precipitation of cristobalite particles (Shainberg & Levy, Reference Shainberg, Levy and Daniel2005; Mekhamer, Reference Mekhamer2011). Thus, from the particle-size analysis (Fig. 2b), the more efficient milling of the planetary mill (PB7) than the jar mill (PB5) results in a greater purification of the raw bentonite.
The XRD traces of PB1–PB11 at 0–10° are discussed in Fig. 3b. The PB1–PB4 samples had the same peak shift (3–4°) at 6°, assigned to d 001 planes, which means that pH and centrifuge time and speed did not change significantly the distances of the d 001 planes in the purified MNT prepared using the centrifuge method. In addition, the calcium hydrogen phosphate hydrate phase (reference code: 000440810) formed due to the reaction of NaHMP and exchanged Ca2+ cations between the bentonite layers in these four samples. This significant upward shift in the PB1–PB4 samples could be related to the ion exchange of calcium for sodium between the layers of the bentonite structure during the physical purification step. This exchange is confirmed by the sodium oxide percentage increase in the chemical composition of PB5 as detected in the XRF analysis (0.61% Na2O, 2.07% MgO, 10.48% Al2O3, 83.39% SiO2, 0.62% K2O, 1.34% CaO, 0.14% TiO2, 1.34% Fe2O3) compared to RB (<0.01% Na2O). The increase in d-spacing of the (001) planes of MNT due to ion exchange resulted from the allocation of adsorbed phosphate ions at the junctions of the surfaces and edges. This also inhibits the formation of a three-dimensional network structure (Goh et al., Reference Goh, Leong and Lehane2011), thus letting the calcium cations exchange with sodium ions in the purified samples and enabling the formation of the hydrogen phosphate hydrate phase. In fact, these phosphate groups make spatial barrier layers, separating the layers and reducing the attraction between the surfaces and cations (Ca2+). Therefore, some of the Ca2+ ions are replaced by Na+ ions of the NaHMP dispersant. As the sodium ion radius is smaller than the calcium ion radius, the d-spacing value is reduced. According to Bragg's law (d = λ/2sinθ), at the reflection position (2θ; Pevelen, Reference Pevelen and Lindon2010) this reduction shifted the characteristic peak to the right. Thus, the specified peaks (5.8°) in RB shifted by ~1–3° higher in PB5, PB6 and PB7. The amount of peak shift and the d-spacing between the layers decreased with increasing bentonite concentration. An increase in the bentonite concentration led to an increase in the viscosity of the bentonite suspension (Choo & Bai, Reference Choo and Bai2015). The subsequent decrease in ion diffusion with increased viscosity (Avramov, Reference Avramov2009) reduced the exchanged Na+ ions, phosphate phase formation and d-spacing change.
The two-stage centrifugation at 4000 and 3000 rpm for 1 and 2 min, respectively, would be the optimized centrifugation conditions in method A. The more significant peak shift observed in PB8 compared to PB7 is related to the greater extent of ion exchange and calcium hydrogen phosphate hydrate formation in the sedimentation method (method B). This was due to the greater interaction time in this latter method.
The potential for sedimentation to replace centrifugation as a more economical process was also examined. By comparing PB8 and PB7 in sedimented and centrifuged 2.5 wt.% samples at pH 7, respectively, the sedimentation process was also found to be promising in terms of achieving acceptable elimination of unwanted phases.
In Fig. 3a, the elimination of impurities was also evaluated using ultrasonication (method C). A comparison between the effects of the jar and planetary milling was made for PB9 and PB10. When a 0.5 wt.% suspension was prepared, the results showed that the heulandite phase had not been eliminated at all when using this method. In addition, the sharp MNT peaks highlighted in these two samples compared to sedimented and centrifuged samples reflect their less damaged structures, while the cristobalite phase decreased significantly compared to samples obtained using the dispersion technique. Various mechanisms lead to these differing results with method C, in which no chemicals were used for purification. The local pressure on the surface separates the particles physically due to the collapsed cavities and the resulting shockwaves and microjets (Chatakondu et al., Reference Chatakondu, Green, Thompson and Suslick1987; Peters, Reference Peters1996; Lapides & Yariv, Reference Lapides and Yariv2004; Yuran et al., Reference Yuran, Truong, Bu and Xie2020). These shockwaves impact the aggregates composed of MNT, heulandite, feldspar, dolomite, calcite and cristobalite phases and separate them. In the ultrasonication stage, these phases were separated gradually through the dissociation of aggregates. However, separating the supernatant in the subsequent precipitation step would isolate the lower-density heulandite and MNT particles. At the same time, the higher-density particles composed of feldspar, cristobalite, calcite, dolomite and undetached aggregates would precipitate. Finally, when this two-stage ultrasonication–sedimentation process was repeated three times, most of the aggregated particles broke into smaller pieces, enabling the unwanted particles to settle.
The results show greater efficiency for planetary milling than jar milling in all methods (A, B and C), despite their various purification mechanisms (sedimentation, centrifugation and ultrasonication, respectively). This observation resulted from the same effects of grinding and ultrasonication for detaching the aggregates in methods A and C. Due to this gravitational separation mechanism, the heulandite phase did not separate from the bentonite in method C (highlighted in the XRD traces of PB9–PB11 in Fig. 3a and the SEM results discussed in the ‘Morphological and bonding investigation’ section below). The comparison between PB10 and PB11, with their different concentrations of bentonite (being ten times greater in PB11), indicated the limitations of the extent of purification as a factor of the weight percentage of raw bentonite. The smaller degree of bentonite crystallinity and cristobalite elimination could be related to the smaller amount of impaction (i.e. shockwaves from strikes) on each aggregate and subsequent lower sedimentation speed of these dense phases and undetached aggregates in more concentrated samples (Lapides & Yariv, Reference Lapides and Yariv2004).
PB9 and PB10 showed no peak shifts compared to RB. The increase in the bentonite concentration when using this method caused a widening and simultaneous reduction in the (001) peak relative to the intensity in PB11 (Fig. 3b). Due to the 10x greater concentration of raw material in this sample, the overall impact of cavitation formation due to ultrasonication on each aggregate decreased significantly, thereby reducing its effectiveness in separating unwanted phase aggregates from the MNT crystals. However, due to the gravitational mechanism and the similarity in density of heulandite and MNT, this method did not remove the heulandite phase in a higher-concentration initial suspension. By increasing the bentonite concentration, the overall impact of cavitation formation on each aggregate is reduced. Therefore, some larger crystals of MNT in the aggregates could not be separated from unwanted phases and were sedimented out with other impurities. This unwanted sedimentation meant that the smaller MNT crystals remained in the suspension, resulting in a weaker and broader characteristic peak at 6° and a lower purification yield.
Regarding method A, this comparison reflected the dominant effect of optimized centrifuge speed and time with respect to the milling type (jar or planetary) on the crystallinity and purity of bentonite. However, pH and bentonite concentration had significant effects on the purification of raw bentonite.
In Fig. 4a, the XRD traces of nanomontmorillonite and its related raw (RB), purified (PB5) and washed-purified (Washed-PB5) bentonites are shown, confirming the presence of MNT and cristobalite after the synthesis step. The heulandite phase was exfoliated in the synthesis process to the thinner layers, which has also been reported by Schulman et al. (Reference Schulman, Wu and Liu2020). Figure 4b shows that the (001) reflection at 5.8°2θ in raw bentonite shifted to the right (7.6° and 6.2°2θ) after purification and washing, respectively, while this reflection shifted to the left (4.1°2θ) after synthesis. According to Bragg's law (Pevelen, Reference Pevelen and Lindon2010), the d 001 value decreased after purification because of cation exchange and increased after synthesis due to exfoliation. On the other hand, the comparison between the XRD traces of SRB and SB indicated that the synthesis process was more effective in terms of the interlayer space increases for SB than SRB. In addition, the (001) peak in SB was broader than the same peak in SRB, which could be ascribed to the thinner sheets in SB. This means that applying a purification step before the synthesis step could result in thinner MNT sheets with larger d-spacings. Due to the broadening of the MNT (001) peaks in SRB, the relative intensity of the cristobalite peaks in SRB was greater than the intensity of the same peaks in RB.
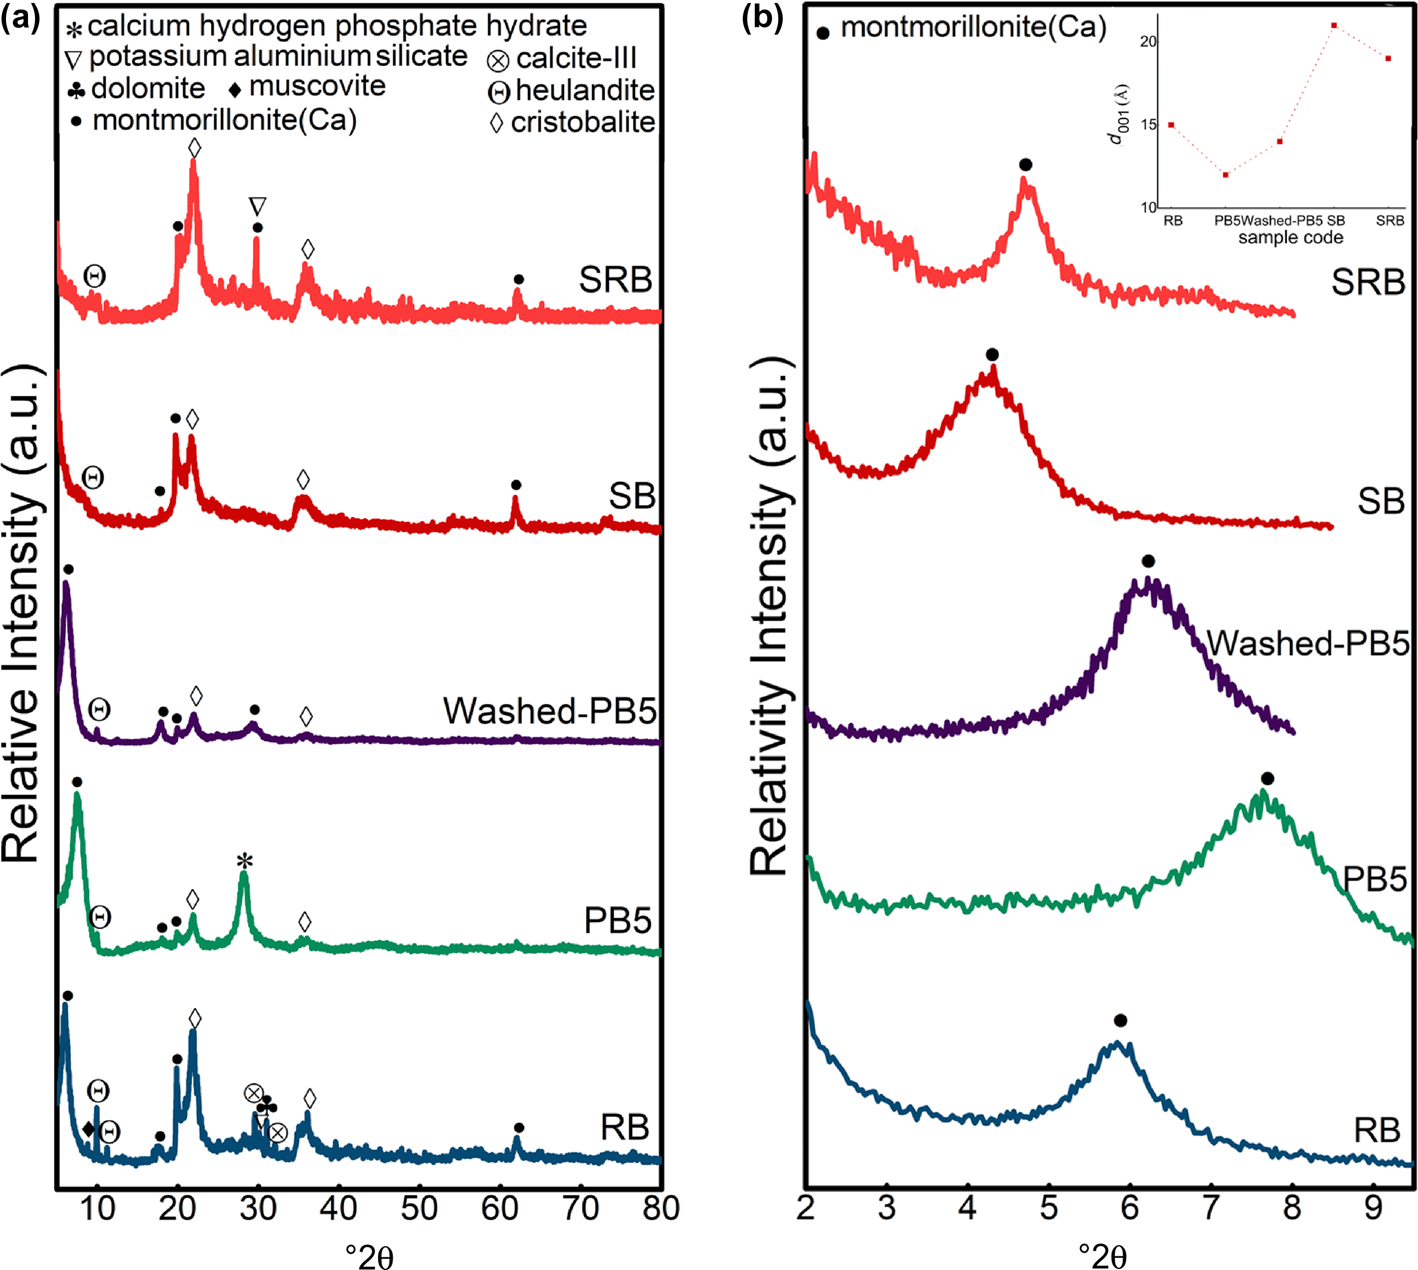
Fig. 4. (a) XRD traces of raw bentonite (RB), purified bentonite obtained using method A (PB5) and after washing (Washed-PB5) and synthesized nanomontmorillonite (SB). (b) Low-angle-normalized XRD traces and d 001 values (inset) of RB, PB5, Washed-PB5, SB and SRB.
Regarding the comparison between the raw and washed bentonite samples, XRF analysis confirmed the elimination of the phosphate phase in the washing step of the purification process. On the other hand, sodium was characterized in the XRF trace of the washed bentonite (~0.6 wt.%), while this element was rare (<0.01 wt.%) in the raw bentonite, confirming the ion exchange of Ca2+ cations with Na+ in the purification process. An intense peak was characterized at 28.1°2θ in all of the purified samples in methods A and B (Fig. 3a), which is related to the calcium hydrogen phosphate hydrate phase (reference code: 000440810) formed by the reaction of NaHMP and exchanged Ca2+ cations between the bentonite layers. Figure 4a indicates that the unwanted phase could be removed with deionized water (Washed-PB5 compared to PB5); however, this washing step was designed to be performed at the end of the MNT nanosheet synthesis process.
Cation-exchange capacity
The MNT structure needs interlayered cations to balance its charges. However, the structural cations could be replaced by lower-valence cations (Al3+ by Mg2+ and Si4+ by Al3+) due to isomorphous substitution. The charges of these exchangeable cations represent the CEC, which is expressed in meq 100 g–1. The magnitude of the CEC value determines the number of quaternary ammonium cations that can enter the interlayer space via cation exchange (He et al., Reference He, Ma, Zhu, Frost, Theng and Bergaya2014). The difference between the CEC values of raw and purified samples is due to the impurities in the raw bentonite. The amount of ammonium alkyl and cations absorbed in MNTs depends on the CEC and length of the alkyl chain (Ltifi et al., Reference Ltifi, Ayari, Chehimi and Ayadi2018). A greater amount of CTAB could intercalate between the layers and increase the CEC of MNT. If the length of the alkyl chains and concentration of cations was increased, the interlayer space (d 001) would also increase (He et al., Reference He, Ma, Zhu, Frost, Theng and Bergaya2014). According to Equation 1, the CEC values of raw bentonite and purified bentonite (PB5) were 0.650 and 0.119 meq 100 g–1, respectively. These CEC results show that purification could increase the CEC value. This means that purification facilitates the synthesis process.
Morphological and bonding investigation
The characterization of functional groups and bondings was carried out using FTIR spectroscopy analysis. Figure 5a shows the FTIR spectra of the raw bentonite (RB), purified samples (PB5, PB8, PB10) and nanomontmorillonite (SB). The peaks at ~473–524 cm–1 indicate Si–O bending vibrations (Darvishi & Morsali, Reference Darvishi and Morsali2011b). The peaks at 524 and 473 cm–1 are attributed to Si–O–Al and Si–O–Si bending vibrations, respectively, which correspond to the Si–O bond of the tetrahedral in the MNT structure (Motawie et al., Reference Motawie, Madany, El-Dakrory, Osman, Ismail and Badr2014). The peak at 792 cm–1 shows the stretching vibration of Al–O–Si, while the sharp absorption peak at 1047 cm–1 corresponds to the stretching vibration of the Si–O bond (Darvishi & Morsali, Reference Darvishi and Morsali2011b).
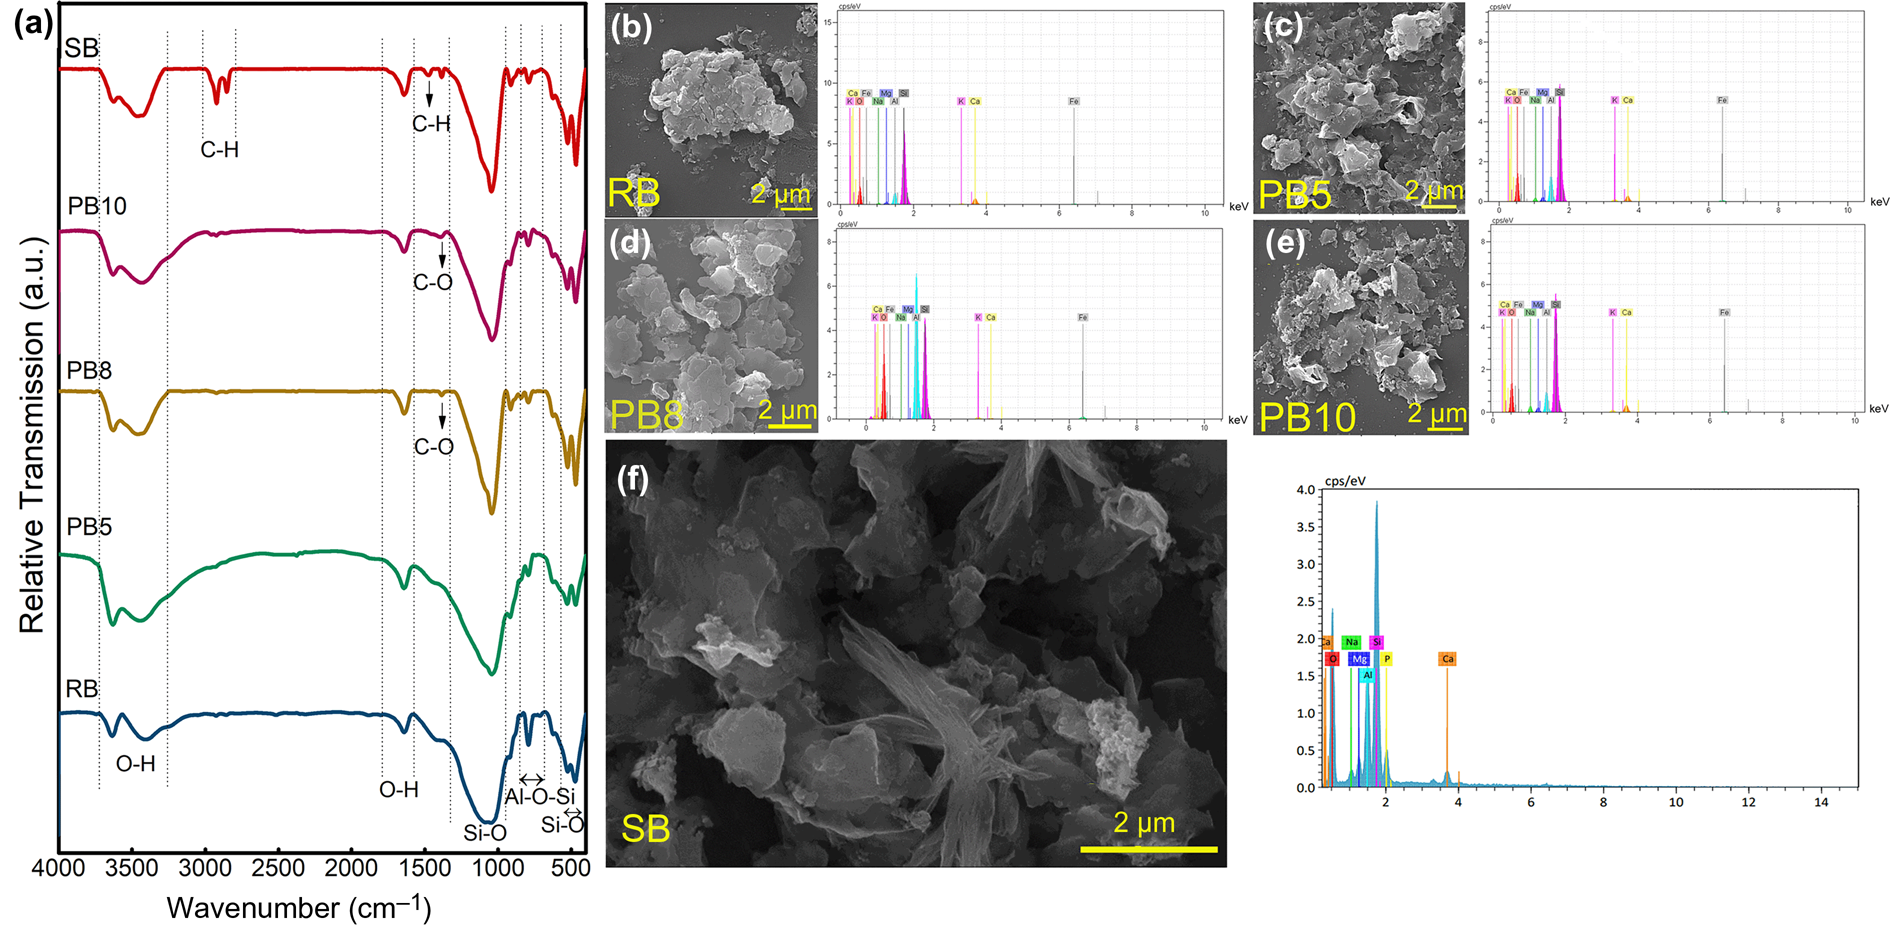
Fig. 5. (a) FTIR spectra of the RB, PB5, PB8, PB10 and SB samples. SEM images and corresponding EDS analyses of (b) RB, (c) PB5 (sample purified using the dispersion and centrifugation method), (d) PB8 (sample purified using the dispersion and sedimentation method), (e) PB10 (sample purified using ultrasonication) and (f) SB (synthesized nanomontmorillonite).
The weak infrared absorption bands at ~3600–3300 cm–1 are related to O–H stretching vibrations, whereas the bonds at ~3407 and 1640 cm–1 are attributed to water molecules in the bentonite structure (Darvishi & Morsali, Reference Darvishi and Morsali2011b). However, the OH bending band at ~912 cm–1 is related to Al–OH, and the one at ~1476 cm–1 could be due to carbonates (Motawie et al., Reference Motawie, Madany, El-Dakrory, Osman, Ismail and Badr2014). The FTIR spectrum of SB showed almost the same pattern as those of the raw and purified bentonites, except for some new bands at 2923 and 2853 cm–1 due to the –CH asymmetric and symmetric stretching vibrations, respectively. In addition, a bond at 1477 cm–1 corresponds to –CH2 bending vibrations of the methylene groups (Pavia et al., Reference Pavia, Lampman and Kriz2001; Motawie et al., Reference Motawie, Madany, El-Dakrory, Osman, Ismail and Badr2014), which confirmed the presence of the CTAB organic groups in the synthesized nanomontmorillonite (Motawie et al., Reference Motawie, Madany, El-Dakrory, Osman, Ismail and Badr2014).
The peak at 3635 cm–1 originated from the stretching vibration of OH in Al2OH (Tabak et al., Reference Tabak, Yilmaz, Eren, Caglar, Afsin and Sarihan2011). In other words, this peak was observed in the spectrum of smectite with a great amount of Al in the octahedral sites (Madejová, Reference Madejová2003). The broad peak at ~3407 cm–1 belongs to the overlapping asymmetric and symmetric H–O–H stretching vibrations of H-bonded water (Madejová, Reference Madejová2003). The peak at 1640 cm–1 is related to the H–O–H bending vibration of water molecules adsorbed on MNT (Madejová, Reference Madejová2003).
Bonds at 3407 and 1640 cm–1 are related to the OH bondings of water molecules (Motawie et al., Reference Motawie, Madany, El-Dakrory, Osman, Ismail and Badr2014). The peak at 3407 cm–1 was blue-shifted after the purification and synthesis process due to a decrease in polarizing power (charge/radius) of the interlayer cations (Madejová, Reference Madejová2003). According to the XRF traces of PB5 and PB8, it seems that the Ca2+ interlayer was exchanged with some of the Na+ of NaHMP, so the polarizing power of the interlayer cations in PB5 and PB8 decreased compared to that of RB. Therefore, the strength of the cations with OH bonds decreased, which resulted in shifting the peak to a higher wavenumber. While PB5 and PB8 showed almost the same interlayer cations (Na+, Ca2+), PB5 showed a more intense peak at the stretching vibrations of hydrogen bonding in water and thus had a greater water content than PB8. The comparison between PB5 and PB8 shows that suspension centrifugation is more effective in terms of its impact on water absorption and levels of H-bonded water on the surface of purified bentonite than leaving the suspension non-centrifuged. However, SB showed a lower intensity of OH bands of water molecules than PB5 due to the displacement of hydrated Ca2+ and Na+ with cetyltrimethylammonium ions (CTA+). A greater decrease in the bending and stretching bands of water in SB than PB5 and PB8 confirmed the diminishing amount of water resulting from organic cation adsorption after the synthesis process. Therefore, this replacement caused the MNT surface to demonstrate a hydrophobic property (Madejová, Reference Madejová2003).
The comparison between the dispersion and ultrasonication methods shows that the OH-stretching vibration bond was affected variously during these processes. The increasing water content was reflected in the increasing intensity of the water band at ~3400 cm–1 in PB5. The PB8 sample had lower polarizing power than PB10 due to the interlayer cations (Ca2+ in PB10 and Na+ and Ca2+ in PB8), demonstrating less absorbed water. Therefore, the PB10 sample (which was purified using the ultrasonication method) compared to PB8 (which was purified using the dispersion method) could be more hydrophilic. Therefore, the degree of hydrophilicity, which is essential in the preparation of composites with a hydrophilic matrix, could also be tuned by controlling the type and extent of purification.
All of the samples demonstrated a more intense adsorption peak of water molecules than RB, which could be related to their greater CEC and absorption improvement during the subsequent purification step, as discussed in the ‘Cation-exchange capacity’ section above.
SEM was employed to investigate the morphology of the samples. Figure 5b–f shows the plate-like structure of the MNT and nanomontmorillonite (Choo & Bai, Reference Choo and Bai2015), illustrated using a back-scattered electron detector. Figure 5e demonstrates that the mean particle size in the PB10 sample was smaller than those of the raw and dispersion-purified bentonite, indicating the particle-size reduction effects of ultrasound in the purification step (Kim, Reference Kim2016). Figure 5f shows the plate-like morphology and layers of the synthesized nanomontmorillonite.
In summary, the particle-size analysis showed that the milling procedure reduced the lateral size of the bentonite particles and led to a broader particle-size distribution than in RB. The processing based on planetary milling produced a more uniform particle-size distribution and a greater proportion of particles in the 1–10 μm range than jar milling. The ζ-potential measurements indicated that fixing the pH of the dispersion at 7 resulted in the most stable suspension, as proved using XRD analysis of method A. In method A, the optimized sample (PB5) was prepared with 2.5 wt.% bentonite concentration at pH 7 using a centrifuge (4000 rpm for 1 min plus 3000 rpm for 2 min). In this method, centrifuge time and speed, suspension concentration and pH had greater impact than milling type. However, the results showed that sedimentation could replace the centrifugation process, which is crucial when designing industrial procedures. Although the ultrasonication method demonstrated the greater purification efficiency, the more scalable dispersion method is preferred for industrial procedures. In addition, the ultrasonication method produced smaller particles in sheets than the dispersion/sedimentation method, which could be used where smaller particles are needed. The dispersion-based purification increased the CEC from 0.650 to 0.119 meq 100 g–1 from raw to purified bentonite, respectively, thereby improving synthesis quality and reflecting the increased d 001 value from 15 to 21 Å after synthesis. The lower CEC in raw bentonite led to a reduced d 001 value of 19 Å for synthesized nanomontmorillonite prepared from raw bentonite. Applying sedimentation pre-processing on bentonite for nanomontmorillonite synthesis increases the quality of the final product (i.e. a greater increase in the d 001 value), but the yield reduced from 100% to 75%. The optimized nanomontmorillonite with a d 001 value of 21 Å could be synthesized with a 2 wt.% purified bentonite suspension and CTAB. The purified bentonite was produced by a dispersion–centrifugation approach. The weight ratio of purified bentonite to CTAB was 7 to 20.
Conclusion
Because of the various applications of high-quality nanomontmorillonite (e.g. as a moisturizer, absorbent, catalyst support, etc.), the MNT phase was isolated from the impurities of bentonite using two approaches: dispersion and ultrasonication. These two approaches play key roles in the quality and characteristics of prepared MNT nanosheets. Nanomontmorillonite that is synthesized from purified bentonite exfoliated to a greater extent than that synthesized from raw bentonite. This improvement is related to the increase in CEC. The CEC of purified bentonite was 0.119 meq 100 g–1, while the CEC was 0.650 meq 100 g–1 in raw bentonite. The effect of pH on suspension stability and the role of particle size in purification efficiency were investigated. The most stable suspension for the purification process was prepared at a pH of 7. Various purification methods were compared, considering the degree of purification, scalability, exfoliation and extent of delamination. The dispersion approach based on centrifugation and sedimentation with NaHMP was less effective and more scalable than the ultrasonication method, resulting in a more hydrophobic MNT nanosheet. The optimized purification procedure in terms of the pH, concentration and centrifugation time and speed was determined for the dispersion/centrifuge method, which was similar to the dispersion and sedimentation methods. The optimized purification parameters were the pH of 7, bentonite suspension concentration of 2.5 wt.% and centrifugation time and speed of 4000 and 3000 rpm for 1 and 2 min, respectively, based on bentonite dispersion in water with NaHMP. However, the centrifugation process in the dispersion method could be replaced by the sedimentation process for ~55 h without incurring a significant effect on quality. In addition, the optimized purification with the ultrasonication method was obtained at 0.5 wt.% bentonite suspension concentration. The results showed that jar milling could replace planetary milling for industrial applications. The d 001 value of nanomontmorillonite synthesized with optimized parameters increased to from 15 to 21 Å in raw bentonite, but this led to a 25% reduction in efficiency. It might be beneficial to reduce the water consumption during purification by increasing the amount of dispersant. The various parameters of the nanomontmorillonite synthesis procedure could be investigated and then optimized to fit with the nanomontmorillonite applications.
Supplementary material
To view supplementary material for this article, please visit https://doi.org/10.1180/clm.2022.29.
Competing interests
The authors declare that they have no known competing financial interests or personal relationships that could have appeared to influence the work reported in this research.


