Application of organic coatings based on epoxy resin is one of the most practical and commonly used approaches for protecting metallic structures against corrosion. The corrosion protection efficiency of epoxy coatings might be improved by incorporating an appropriate pigment in their formulations. Pigments that are selected for this purpose act as inhibitors or sacrificial or barrier anticorrosive pigments (Tracton, Reference Tracton2006). MMT is a layered aluminosilicate mineral member of the smectite group. It consists of stacks of platelets ~1 nm thick. Thus, MMT may be considered as a nanofiller if these stacks break down to primary platelets during dispersion (Carrado et al., Reference Carrado and Bergaya2007; Pavlidou & Papaspyrides, Reference Pavlidou and Papaspyrides2008; Kiliaris & Papaspyrides, Reference Kiliaris and Papaspyrides2010). Incorporation of MMT into organic coatings improves the physical and mechanical properties of coatings and plays a dominant role in improving the barrier properties of the coatings due to its planar structure and high aspect ratio (Kim et al., Reference Kim, Hu, Woo and Sham2005; Tomić et al., Reference Tomić, Dunjić, Likić, Bajat, Rogan and Djonlagić2014; Madhup et al., Reference Madhup, Shah and Parekh2017). Other desirable properties of MMT are the layered structure, the fact that it is modified easily with organic molecules through the cation exchange reaction (CER), the large cation exchange capacity (CEC), the expandability, and the availability and relatively low cost, which make it commercially attractive for a wide range of applications. The aforementioned improvements depend heavily on the state of MMT dispersion in continuous polymeric matrices. The most desired characteristics can be obtained when a highly exfoliated MMT layer is formed in the polymer matrix (i.e. the MMT platelets are completely separated and dispersed randomly in the polymeric matrix; Jan et al., Reference Jan, Lee, Chiou and Lin2005; Stojšić et al., Reference Stojšić, Raos and Kalendová2014). Various parameters, such as dispersing conditions, type of polymer, nature of MMT and surface modification of MMT, should be considered when fabricating a nanocomposite with a great degree of MMT exfoliation (Le Pluart et al., Reference Le Pluart, Duchet, Sautereau and Gérard2002; Triantafillidis et al., Reference Triantafillidis, LeBaron and Pinnavaia2002; Yasmin et al., Reference Yasmin, Abot and Daniel2003; Rỳznarová et al., Reference Rỳznarová, Zelenka, Lednickỳ and Baldrian2008; Ngo et al., Reference Ngo, Ton-That, Hoa and Cole2009; Follain et al., Reference Follain, Alexandre, Chappey, Colasse, Médéric and Marais2016; Salam et al., Reference Salam, Dong, Davies and Pramanik2016). Organic surface modification of MMT makes it compatible with polymers. It consists of changing the surface characteristics of MMT (i.e. reducing MMT surface energy and turning the hydrophilic surface of MMT into a hydrophobic surface) by intercalation of organic compounds. Generally, surface modification of MMT is carried out by a CER between MMT and quaternary alkyl ammonium salts (QASs; Tiwari et al., Reference Tiwari, Khilar and Natarajan2008; Singla et al., Reference Singla, Mehta and Upadhyay2012), imadazolium salts (Bottino et al., Reference Bottino, Fabbri, Fragalà, Malandrino, Orestano, Pilati and Pollicino2003; Awad et al., Reference Awad, Gilman, Nyden, Harris, Sutto, Callahan, Trulove, DeLong and Fox2004), epoxy-amine adducts (Gârea et al., Reference Gârea, Iovu and Bulearca2008, Reference Gârea, Iovu and Voicu2010), alkyl phosphonium salts (Seyidoglu & Yilmazer, Reference Seyidoglu and Yilmazer2015) and silane-based modifiers (Ma et al., Reference Ma, Zhou, Li, Tao, Zhu, Yuan, Zhu and He2014). Among these, the use of QASs is very common practice (Favre & Lagaly, Reference Favre and Lagaly1991; Bilgiç et al., Reference Bilgiç, Karakehya, Çetinkaya, Singh and Chehimi2014; He et al., Reference He, Ma, Zhu, Frost, Theng and Bergaya2014; Yu et al., Reference Yu, Ren, Tong, Zhou and Wang2014), because it is cost effective in comparison with the aforementioned modifiers, it is available and it is simple to implement the CER on the QASs. In addition, there is a vast variety of functional substituents on the organic compounds, which makes them favourable choices for organic modification of MMT (He et al., Reference He, Ma, Zhu, Frost, Theng and Bergaya2014; Shah et al., Reference Shah, Pandya and Shukla2017). Moreover, MMTs modified with QASs show greater affinity and compatibility with organic compounds, including polymers (Favre & Lagaly, Reference Favre and Lagaly1991). As a member of the QAS family, hexadecyltrimethylammonium bromide (HDTB), a well-known cationic surfactant that contains an alkyl chain 16 carbon atoms long, is frequently used in daily life (Liu et al., Reference Liu, Fan, Zhong, Zhang, Ding, Yan and Han2010; Bilgiç et al., Reference Bilgiç, Karakehya, Çetinkaya, Singh and Chehimi2014). HDTB is also the most popular QAS for organic modification of MMT (Yan et al., Reference Yan, Wang, Yu, Wei, Du and Shan2007; Zohra et al., Reference Zohra, Aicha, Fatima, Nourredine and Zoubir2008; Gürses et al., Reference Gürses, Karaca, Açikyildiz and Ejder2009, Reference Gürses, Karaca, Aksakal and Açikyildiz2010; Kooli et al., Reference Kooli, Liu, Alshahateet, Messali and Bergaya2009; Xi et al., Reference Xi, Mallavarapu and Naidu2010; Lin et al., Reference Lin, Jeng and Lin2011; Wu et al., Reference Wu, Dai, Long, Zhu, Li, Wu and Dang2012; Hou et al., Reference Hou, Wu, Huang, Ruan, Liu and Zhu2014). HDTB has an optimum alkyl chain length for organic modification of MMT that not only provides the necessary hydrophobicity and d spacing for compatibility of modified MMT with organic media, but is also highly soluble in water at ambient temperature, which causes remarkable energy conservation during the modification process (Hoffmann et al., Reference Hoffmann, Dietrich, Thomann, Friedrich and Mülhaupt2000; He et al., Reference He, Ma, Zhu, Frost, Theng and Bergaya2014). Although the thermal stability of MMT modified with QASs is generally less than that of the phosphonium- and silane-based modified MMT, among the QASs, the thermal stability of HDTB-modified MMT is quite high, and it might be employed in polymeric nanocomposites by thermal compounding (melt intercalation) without considerable thermal degradation (Arora et al., Reference Arora, Choudhary and Sharma2011). The type, size and polarity of surfactant (Guo et al., Reference Guo, Jia and Cai2004; Fu & Heinz, Reference Fu and Heinz2010; Liu et al., Reference Liu, Han, Ke, Tang, Wan, Yin, Deng and Zhao2013), surfactant/MMT mass ratio (Hojiyev et al., Reference Hojiyev, Ulcay, Çelik and Carty2017), the CEC and the purity of MMT (Veiskarami et al., Reference Veiskarami, Sarvi and Mokhtari2016) affect the final characteristics of organo-MMT. The CER of MMT and surfactant may be performed through various approaches, including ultrasonic and hydrothermal (Xi et al., Reference Xi, Frost, He, Kloprogge and Bostrom2005), solid/solid (Zhuang et al., Reference Zhuang, Zhang, Guo, Liao and Zhao2015), semi-solid (Paiva et al., Reference Paiva, Morales, Branciforti and Bretas2012; Paiva & Morales, Reference Paiva and Morales2012) and super critical CO2 (Liu et al., Reference Liu, Thompson and Rodgers2014; Alves et al., Reference Alves, de Tarso Vieira e Rosa and Morales2016) methods. Kornmann et al. (Reference Kornmann, Lindberg and Berglund2001) prepared an epoxy/MMT nanocomposite using two MMTs with various CECs and investigated the effect of CEC of the MMT on the synthesis and structure of the epoxy/MMT nanocomposite. In that study, the authors found that the MMT with lower CEC values resulted in more exfoliated MMT layers in epoxy resin. Dai et al. (Reference Dai, Li and Yeh2008) investigated the effect of MMT modifier type on the physical properties of epoxy/MMT nanocomposites and found better dispersion of alkyl phosphonium-modified MMT in comparison with QAS-modified MMT in epoxy resin, leading to greater corrosion protection, gas barriers, mechanical strength, thermal stability and flame retardancy of the final nanocomposite. Sari et al. (Reference Sari, Ramezanzadeh, Shahbazi and Pakdel2015) modified MMT with a hyperbranched polymer (HBP) and evaluated its corrosion protection performance in an epoxy resin/MMT composite. It was reported that surface modification of the MMT by HBP improved the dispersion of the MMT in the epoxy resin. The better the dispersion state of MMT in the epoxy resin, the higher the barrier effect of the epoxy coating, which resulted in significant enhancement of epoxy coating corrosion resistance.
Despite the fact that there have been several studies on the modification and application of MMT in polymeric systems, only a few have investigated the effects of MMT modification on the mechanical and corrosion properties of epoxy coatings. Therefore, in the present study, an Iranian MMT was modified via CER with HDTB, and the effects of MMT modification and content on the morphological, mechanical and corrosion protection properties of the epoxy coatings were investigated.
MATERIALS AND METHODS
Materials
A two-component epoxy system based on a diglycidyl ether bisphenol-A and a polyamidoamine curing agent were employed. The diglycidyl ether bisphenol-A with an epoxy equivalent weight of 434–555 g/eq (Epiran-01X75) was supplied by Khuzestan Petrochemical Company, Iran. The polyamidoamine hardener with a hydrogen equivalent weight of 198 g/eq (HA-623X75) was supplied by Poly Resin Company, Iran. A MMT clay from Iran with a CEC of 96 meq/100 g was obtained from Nasim Saderat Rad Company, Iran. The HDTB was purchased from Sigma-Aldrich, USA. The chemical structure of HDTB is illustrated in Fig. 1a. Other required reagents and additives were supplied by BYK Company, Germany. All chemicals were used as received. ST-12 mild steel (Esfahan's Mobarakeh Steel Company, Iran) workpieces with dimensions of 80 mm × 80 mm × 2 mm were prepared and employed as the metallic substrates.

Fig. 1. (a) Chemical structure of HDTB. (b) Schematic representation of the CER between HDTB and MMT.
Methods
Synthesis of OMMT
The synthesis of organically modified MMT (OMMT) during the CER is shown schematically in Fig. 1b. A total of 500 mL of deionized water was poured into a two-neck flat-bottomed flask, and then 5 g of MMT was added. The flask was stirred by means of a magnetic stirrer at 800 rpm for 24 h at ambient temperature to obtain swollen MMT platelets. Subsequently, a stoichiometric amount of HDTB was pre-dissolved in the adequate amount of deionized water according to the CEC of MMT, and then an equivalent amount of HCl was added to the solution. The HDTB solution was slowly added to MMT suspension under continuous stirring at 600 rpm for another 6 h. Subsequently, the stirring process was ceased to allow the OMMT particles to settle down under ambient conditions. The OMMT sediments were filtered and washed with hot deionized water until no bromide anions were detected (AgNO3 test). The filtered paste was put into a vacuum oven to dry at 60°C for 24 h. The dried filtrate was ground with a ball-mill and sieved to a particle size of <45 μm (325 US Standard mesh).
Sample preparation
Specific amounts of MMT and OMMT were incorporated into the epoxy resin (see Table 1) and mixed vigorously for 2 h at ambient temperature at 2000 rpm using a mechanical stirrer. The resulting mixtures were sonicated (Hielscher UP400S ultrasonic sonicator, Germany) with a power of 100 W for 30 min and then degassed under vacuum. The steel plates were first degreased with acetone and then polished with P400, P800 and P1200 sandpaper to remove any existing rust and mill scale. The polished steel plates were washed with acetone and then dried. Then, a stoichiometric amount of hardener was added to the mixtures and gently mixed. The resulting mixtures were coated onto the steel substrates and the clean and flat polytetrafluoroethylene (PTFE) substrates using a film applicator with dry film thicknesses of 35 ± 5 μm on the steel substrates and of 200 ± 20 μm on the PTFE substrates. The coated substrates were kept in an oven for 1.5 h at 90°C the curing reaction was complete. The samples for mechanical measurement were separated from the PTFE substrates and cut into dimensions of 30 mm × 10 mm × 0.2 mm.
Table 1. Sample codes and compositions.
Note: The quantities of the components were calculated based upon the total weight of the final mixture. MMT3, OMMT1, OMMT3 and OMMT5 denote the concentration (wt.%) of MMT and OMMT in the epoxy (EP) resin.
Characterization
Characterization of MMT and OMMT
Fourier transform infrared (FTIR) spectroscopy images of MMT and OMMT were collected using a Bruker IFS-88 spectrometer (Germany) over the 4000–400 cm−1 region in transition mode at 4 cm−1 resolution. Thermogravimetric analysis (TGA) and differential TGA (DTG) of MMT and OMMT was performed using a Mettler TGA-SF1 instrument (Switzerland) over the temperature range of 30–700°C with a rate of temperature change of 10°C/min under a high-purity flowing nitrogen atmosphere.
Morphological study
The mineralogical composition and morphological properties of MMT and OMMT powders and their epoxy coatings were determined using XRD and TEM. The XRD measurements were carried out on a Philips X'Pert MPD X-ray diffractometer using Cu-Kα radiation (λ = 1.5418 Å) at room temperature. The diffraction patterns were recorded in the range 0.5–10°2θ at a scanning rate of 0.02°2θ/s. The TEM images of coating cross-sections were recorded with an EM 900 TEM instrument (Carl Zeiss, Germany) with an acceleration voltage of 80 kV. The cross-sections of coatings were cut by an ultra-microtome equipped with a diamond knife.
Physical and mechanical properties of the coatings
The thermal and mechanical behaviour of neat and filled epoxy coatings was determined by dynamic mechanical analysis (Triton TTDMA, UK). Samples in the form of a rectangular film with dimensions of 30 mm × 10 mm × 0.2 mm were prepared. The experiments were performed under tension mode. A frequency of 1 Hz was employed, while the temperature increased at a rate of 5°C/min from room temperature to 120°C. The glass transition temperature (T g) of samples was determined from the peak of tan δ (i.e. the ratio of loss to the storage modulus) curves. The adhesion strength of the coatings to the metallic substrates was measured by a pull-off adhesion tester (Defelsko Positest, USA) according to ASTM D4541. The pull-off tests were carried out before (dry adhesion) and after (wet adhesion) 1 week of immersion of samples in the 3.5% wt./wt. NaCl solution. The measurements were repeated at least five times and the mean values of the results reported.
Corrosion protection properties of the coatings
The corrosion protection properties of the samples were evaluated by EIS analysis at the frequency range 10 kHz to 10 mHz and an alternating current (AC) amplitude of 10 mV using an Ivium CompactStat electrochemical workstation (The Netherlands). The electrochemical measurements were performed in a 3.5% wt./wt. NaCl solution and a classical three-electrode cell including saturated Ag/AgCl as the reference electrode, Pt as the counter-electrode and coated steel substrate with an exposed area of 6 cm2 as the working electrode. The measurements were performed in triplicate to ensure reproducibility. The salt spray test was carried out according to ASTM B117. The samples were scratched according to ASTM D1654 and then placed in the salt fog chamber for about 168 h. After removing the samples from the salt spray test, their images were recorded with a digital scanner (Epson V550, Japan) at 600 dots per inch (dpi) resolution. Because in recent years image-processing methods have shown promising potential in quantitative characterization of the materials and their behaviour in various media (Ghodrati et al., Reference Ghodrati, Mohseni and Gorji Kandi2017, Reference Ghodrati, Kandi and Mohseni2018), an image-processing method was employed for non-subjective evaluation of the salt spray results. Using the Canny edge detection method as an image processing tool, the corroded area in the samples was evaluated quantitatively. In digital image processing, ‘edge’ refers to the pixels where a sudden change in image intensity occurs (Sonka et al., Reference Sonka, Hlavac and Boyle2014). The Canny edge detection algorithm is one of the most effective edge-detection methods (Sonka et al., Reference Sonka, Hlavac and Boyle2014). In this method, almost all of the real edges in the image are detected (even weak edges). On the other hand, false edges (i.e. other image features that are analogous to an edge but are not considered to be real edges) are correctly recognized and are not counted as edge pixels by the Canny method (Canny, Reference Canny1983, Reference Canny1986). Thus, detection of the corroded regions was performed by using the Canny edge detection algorithm on a personal computer. Then, the numbers of pixels located in the corroded regions were calculated and considered as quantitative corrosion protection criteria. The larger the number of the pixels, the lower the corrosion resistance.
RESULTS AND DISCUSSION
Characterization of MMT and OMMT
The FTIR spectra of MMT and OMMT are shown in Fig. 2. The bands at 3620 and 3423 cm–1 are assigned to the stretching vibration of hydroxyl groups in the structures of MMT and absorbed water molecules, respectively. The hydroxyl bending vibration of absorbed water molecules resulted in a band at 1640 cm–1 in both samples. The bands at 2851 and 2920 cm–1 for OMMT are attributed to stretching vibrations of CH2 and CH3 groups of the organic modifier, and the band at ~1470 cm–1 is attributed to bending vibrations of CH2 and CH3 groups of the organic modifier (Lv et al., Reference Lv, Zhou, Li and Shi2008; Osman et al., Reference Osman, Fitri, Rakibuddin, Hashim, Johari, Ananthakrishnan and Ramli2017). The FTIR spectra of OMMT attest to the presence of HDTB molecules in the modified MMT.
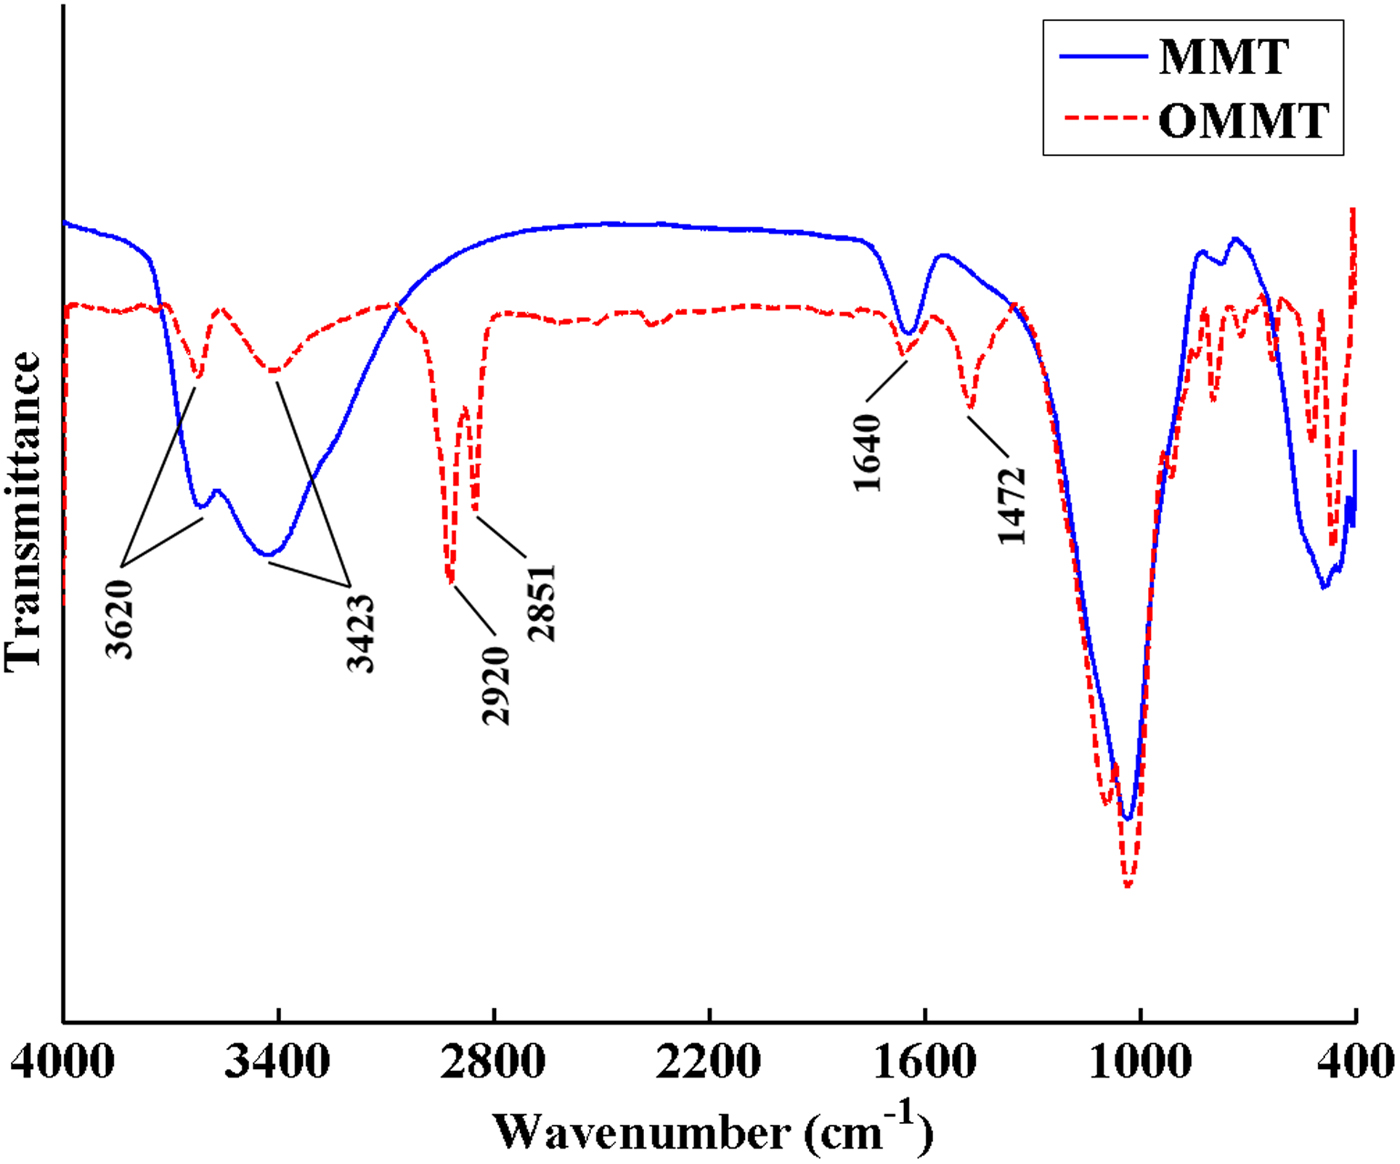
Fig. 2. FTIR spectra of MMT and OMMT.
The TGA and DTG curves of MMT and OMMT are shown in Figs 3 and 4, respectively. The TGA curve of MMT includes two main steps. The first step at 25–150°C with 5 wt.% weight loss is attributed to removal of adsorbed water from the MMT. The second step occurring above 550°C is assigned to dehydroxylation of MMT. In OMMT, the mass loss of surface-adsorbed water decreased to 2.5 wt.% due to the change in surface characteristics of MMT from hydrophilic to hydrophobic after modification with HDTB. Furthermore, an additional mass loss of ~26.4 wt.% was observed in the temperature range 200–500°C in OMMT, which is related to decomposition of the organic modifier. The different events at 261°C, 325°C and 422°C in the DTG curve of OMMT are due to different decomposition mechanisms of the organic modifier (Xie et al., Reference Xie, Gao, Pan, Hunter, Singh and Vaia2001; Xi et al., Reference Xi, Frost, He, Kloprogge and Bostrom2005; Bellucci et al., Reference Bellucci, Camino, Frache and Sarra2007). The maximum decomposition rate of pure HDTB was reported at ~200°C, but the temperature of the maximum mass loss rate for OMMT occurred at 260°C (second peak in the DTG curve of OMMT) (Fig. 4) which is higher than that of pure HDTB (Bonczek et al., Reference Bonczek, Harris and Nkedi-Kizza2002; Zhou et al., Reference Zhou, Frost, He and Xi2007; Sun et al., Reference Sun, Park, Zheng, Ayoko and Frost2013). These results indicate that HDTB molecules did not just physically mix with MMT, instead reacting with MMT layers during CER, causing HDTB thermal degradation at higher temperatures. This observation might be due to the following reasons (Xi et al., Reference Xi, Frost, He, Kloprogge and Bostrom2005; Bellucci et al., Reference Bellucci, Camino, Frache and Sarra2007; Mahmoodi et al., Reference Mahmoodi, Ebrahimi, Khosravi and Mohammadloo2017):
– The barrier properties of MMT layers prevent diffusion of volatile compounds formed during thermal degradation of surfactant, causing a shift in the degradation temperature of the surfactant.
– The surfactant connection to MMT via strong electrostatic interactions results in a higher thermal energy requirement for surfactant decomposition.
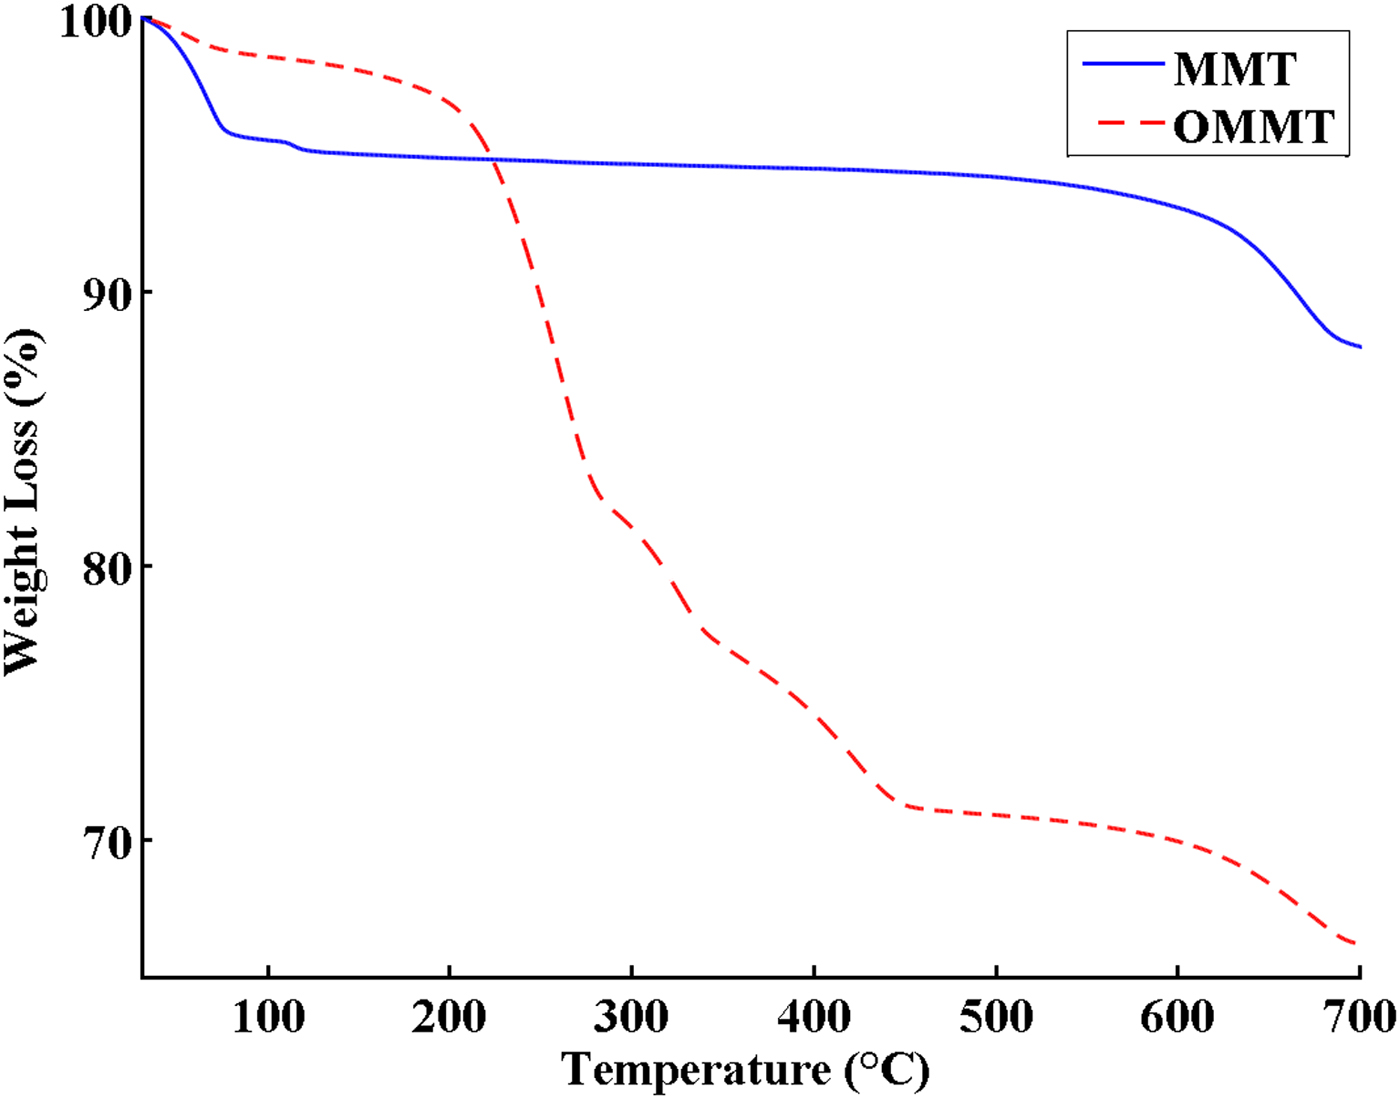
Fig. 3. TGA curves of MMT and OMMT.
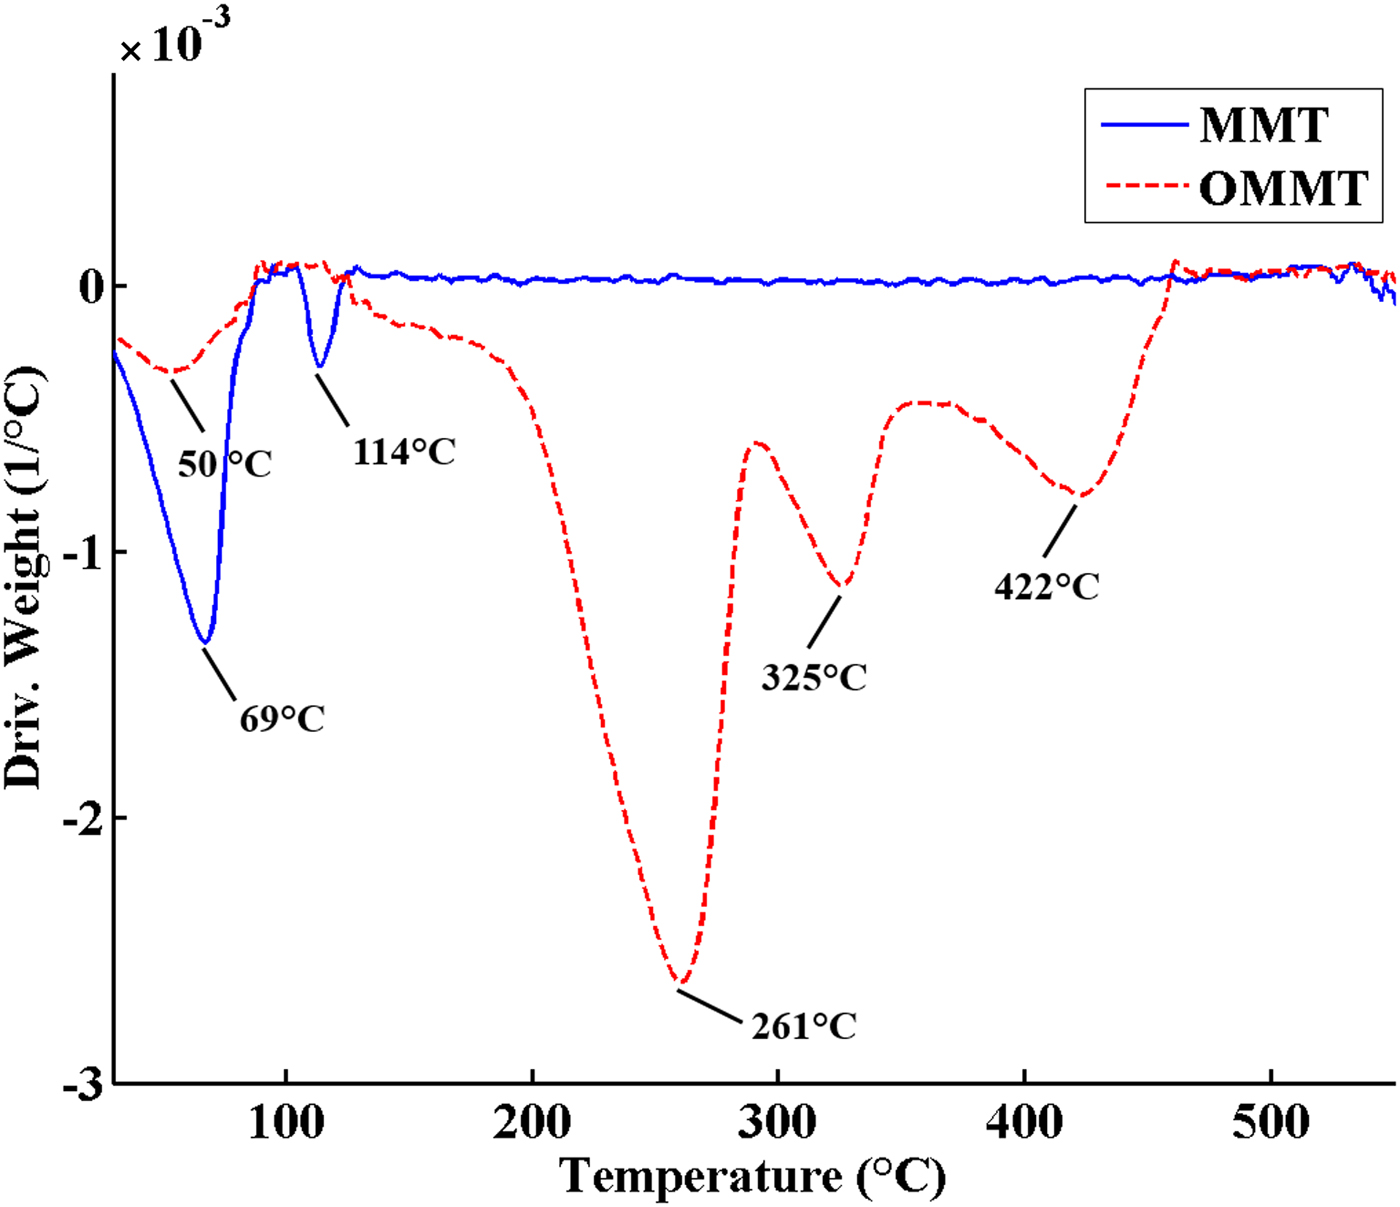
Fig. 4. DTG curves of MMT and OMMT.
The amount of grafted HDTB to MMT was 97% of the initial concentration of HDTB using the weight loss in the temperature range of 200–500°C in the TGA thermogram (Fig. 3). Hence, the cation exchange of the HDTB was almost complete and it is considered as one of the HDTB's advantages (He et al., Reference He, Ma, Zhu, Frost, Theng and Bergaya2014).
Dispersion and morphology
The XRD traces of MMT and OMMT and their epoxy coatings are illustrated in Figs 5 and 6, respectively. The d spacings of MMT are listed in Table 2. The (001) basal diffraction maximum of MMT occurred at 6.95°2θ, corresponding to a d spacing of 1.27 nm (Fig. 5). The appearance of two intense reflections at smaller 2θ angles with rational d spacings for OMMT is attributed to intercalation of HDTB in the MMT layers. The diffraction patterns of epoxy/MMT and epoxy/OMMT samples are shown in Fig. 6. The d spacing of MMT increased from 1.27 to 1.39 nm after dispersing in epoxy, indicating partial intercalation of the epoxy (sample EP-MMT3). In the epoxy/OMMT samples, the first-order peak at lower 2θ was significantly more intense than the second peak at higher 2θ, suggesting that the concentration of OMMT layers with the higher d spacing might be dominant in the samples. Most of the OMMT with d spacing 1.98 nm expanded after dispersion in epoxy matrix by 2.27, 1.73 and 1.72 nm for 1, 3 and 5 wt.% OMMT. It is difficult to interpret the peak of OMMT at 3.92 nm, but it likely disappeared after the dispersion of OMMT into the epoxy resin (Fig. 5). In fact, the OMMT layers with greater d spacing were more susceptible to expansion because the higher d spacing required less energy to overcome attraction forces between layers and facilitated diffusion of epoxy molecular chains into the interlayers. These observations demonstrate that the OMMT layers expand more in comparison with MMT layers when embedded into epoxy matrices. This reveals that modification of MMT with HDTB not only increases interlamellar distances due to the substantially larger molecular size of the surfactant in comparison with sodium, but it also improves compatibility of MMT with epoxy matrices due to the organic nature of HDTB, which is in agreement with previous studies (He et al., Reference He, Ma, Zhu, Frost, Theng and Bergaya2014). Consequently, epoxy molecules may partially or totally penetrate between OMMT layers and cause intercalated or exfoliated morphologies. In contrast, the compact structure and organophobicity of MMT makes it almost impossible for epoxy molecules to penetrate the interlayer space.
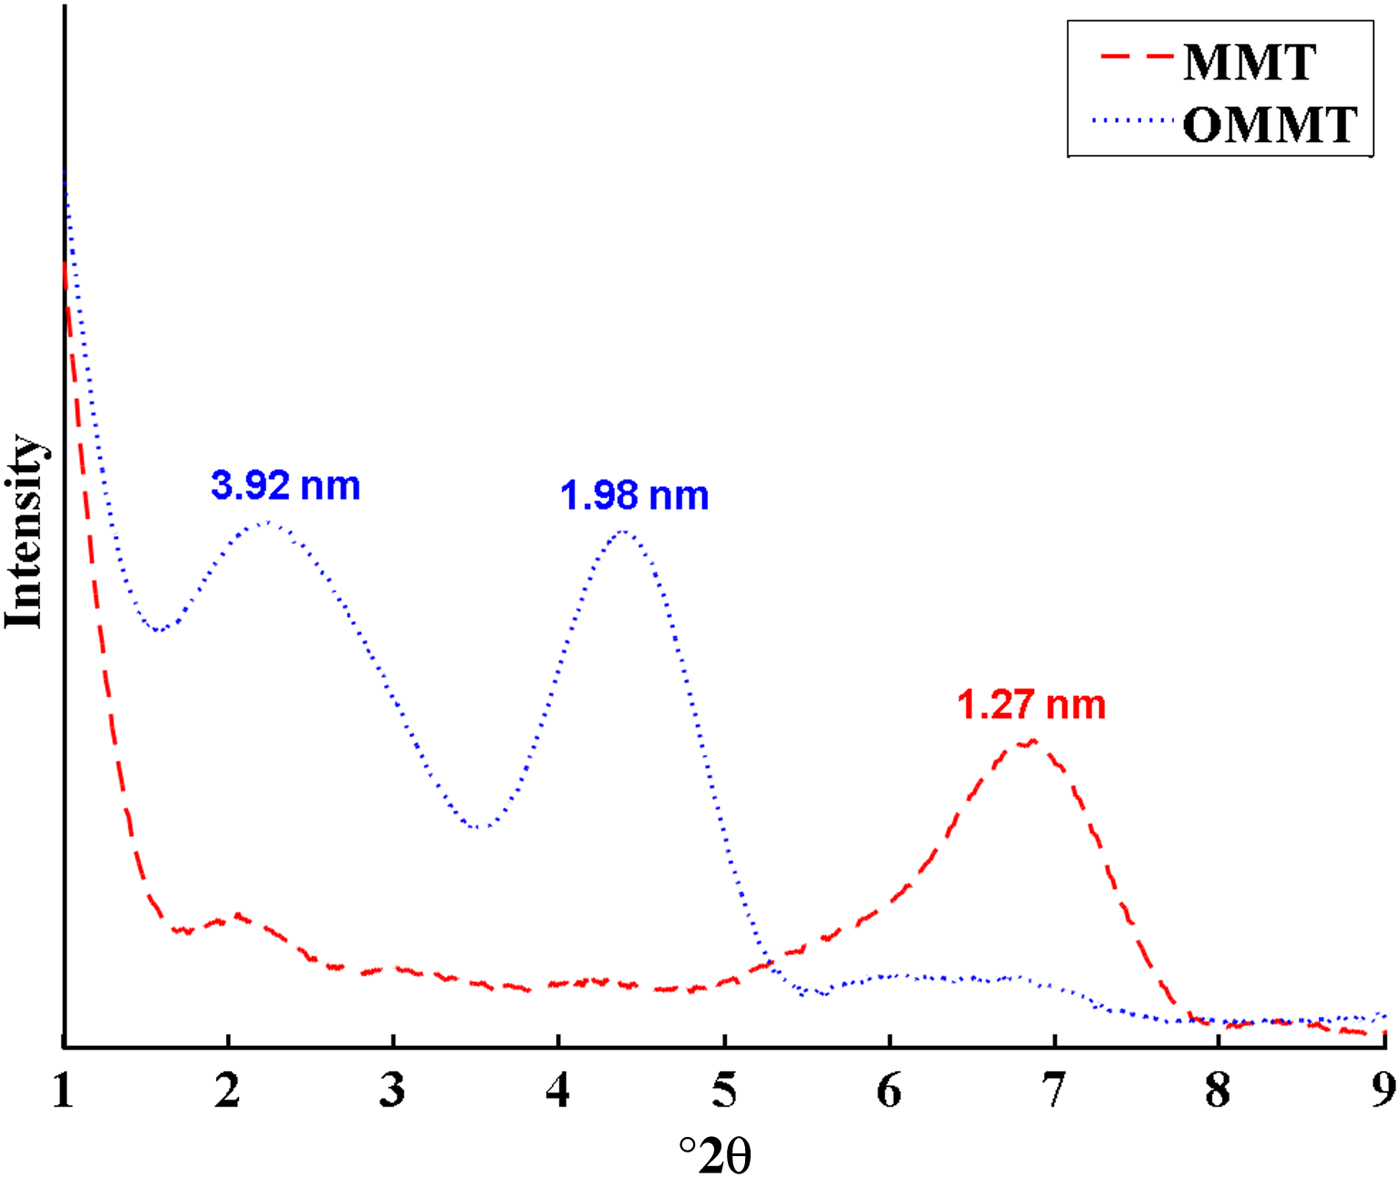
Fig. 5. XRD traces of MMT and OMMT.
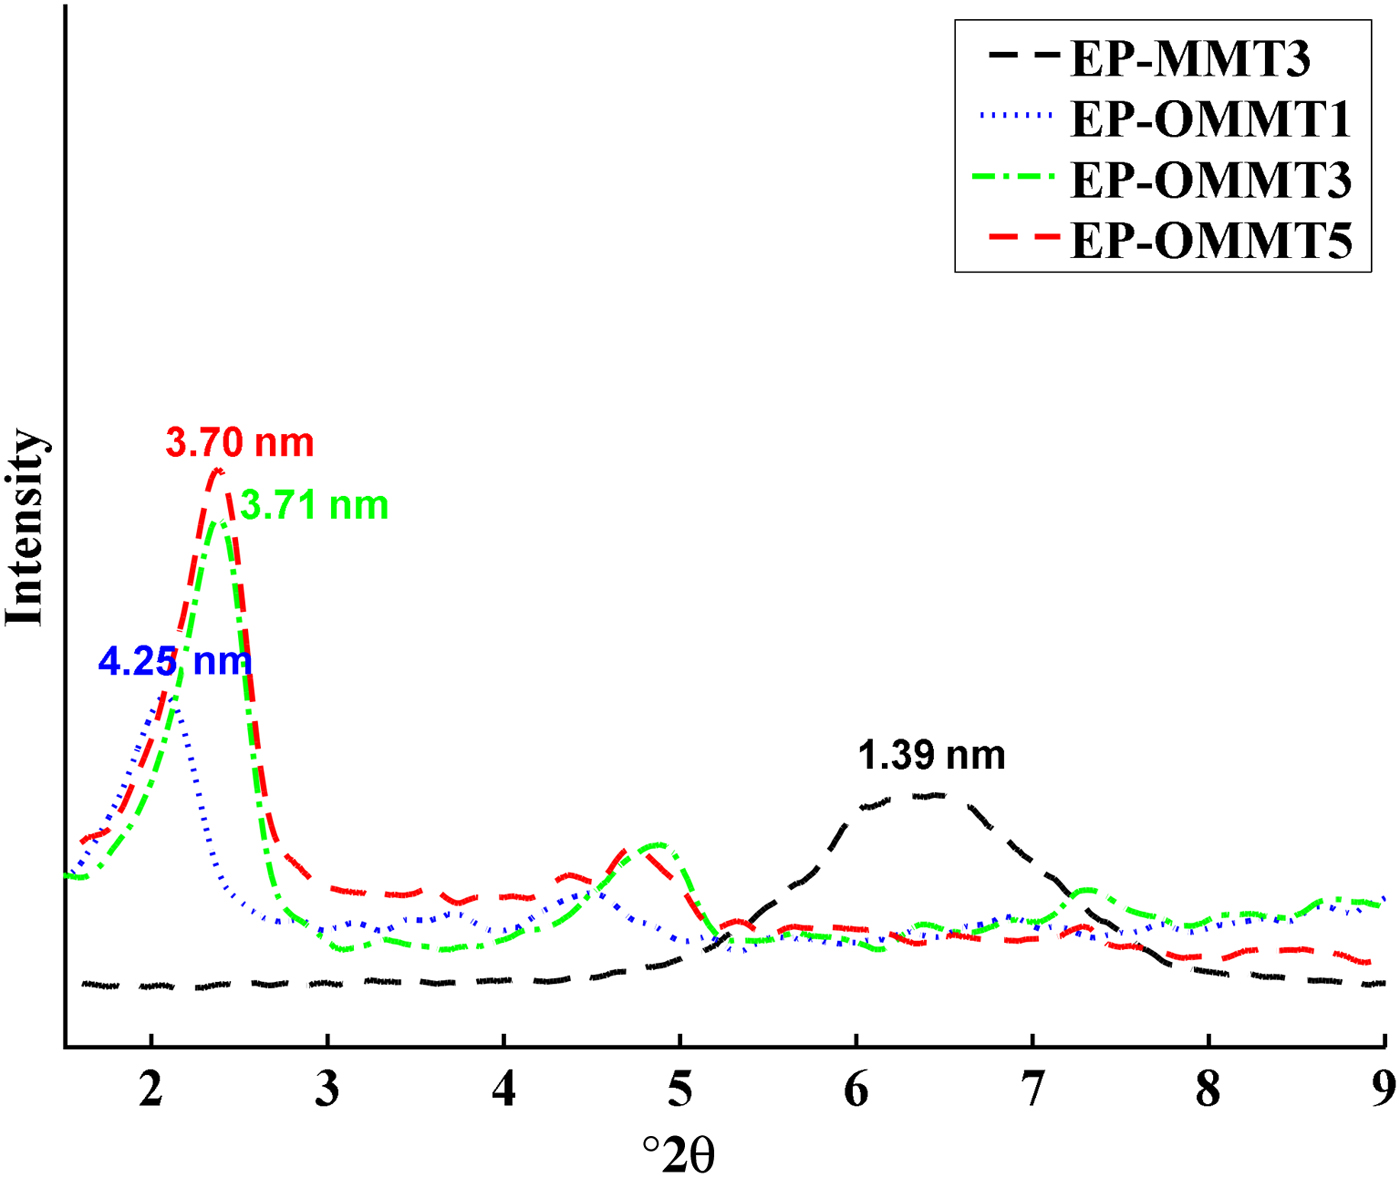
Fig. 6. XRD traces of epoxy/MMT and epoxy/OMMT at 1–5 wt.% clay.
Table 2. The d spacings of MMT and OMMT before and after incorporation into epoxy resin.

Figure 7 shows TEM images of epoxy coatings filled with 3 wt.% of MMT and OMMT (i.e. EP-MMT3 and EP-OMMT3). Dense black areas in EP-MMT3 (Fig. 7b) are indicative of MMT agglomeration, which suggests poor dispersion of MMT into epoxy matrices. In contrast, black areas in EP-OMMT3 (Fig. 7a) are obviously smaller and evenly distributed, suggesting that dispersion of OMMT into the epoxy matrix is far more effective than that of MMT.

Fig. 7. TEM images of (a) epoxy/OMMT (EP-OMMT3) and (b) epoxy/MMT (EP-MMT3) at 3 wt.% clay.
Dynamic mechanical properties of coatings
Figures 8 and 9 show the plots of the storage modulus (E′) and tan δ versus temperature, respectively. The sample Tg, E′ at 25°C, area under the tan δ peak (St) and the full width at half maximum (FWHM) of the tan δ peak values are listed in Table 3. The E′ of the epoxy coatings containing MMT and OMMT was higher than of the neat epoxy (Fig. 8, Table 3). The greatest improvement in E′ of epoxy coatings was observed in the sample with 3 wt.% OMMT (~54% improvement in comparison with neat epoxy), which is significantly higher than the sample containing 3 wt.% MMT (~25% improvement in comparison with neat epoxy). These results can be explained by the better dispersion and higher compatibility of OMMT with epoxy resin as compared to MMT. Thus, the effectively intercalated/exfoliated OMMT layers in epoxy coatings increased the interaction of OMMT layers with epoxy molecular chains (Fig. 7), leading to greater load transfer to clay layers and resulting in a higher E′ (Mahmoodi et al., Reference Mahmoodi, Ebrahimi and Khosravi2018). On the other hand, the low E′ of epoxy coatings containing 5 wt.% OMMT in comparison with epoxy coatings having 1 and 3 wt.% OMMT might be associated with agglomeration of OMMT in the epoxy coatings at high OMMT concentrations (Wang et al., Reference Wang, Chen, Wu, Toh, He and Yee2005; Qi et al., Reference Qi, Zhang, Bannister and Mai2006; Sharmila et al., Reference Sharmila, Ayswarya, Abraham, Begum and Thachil2014).
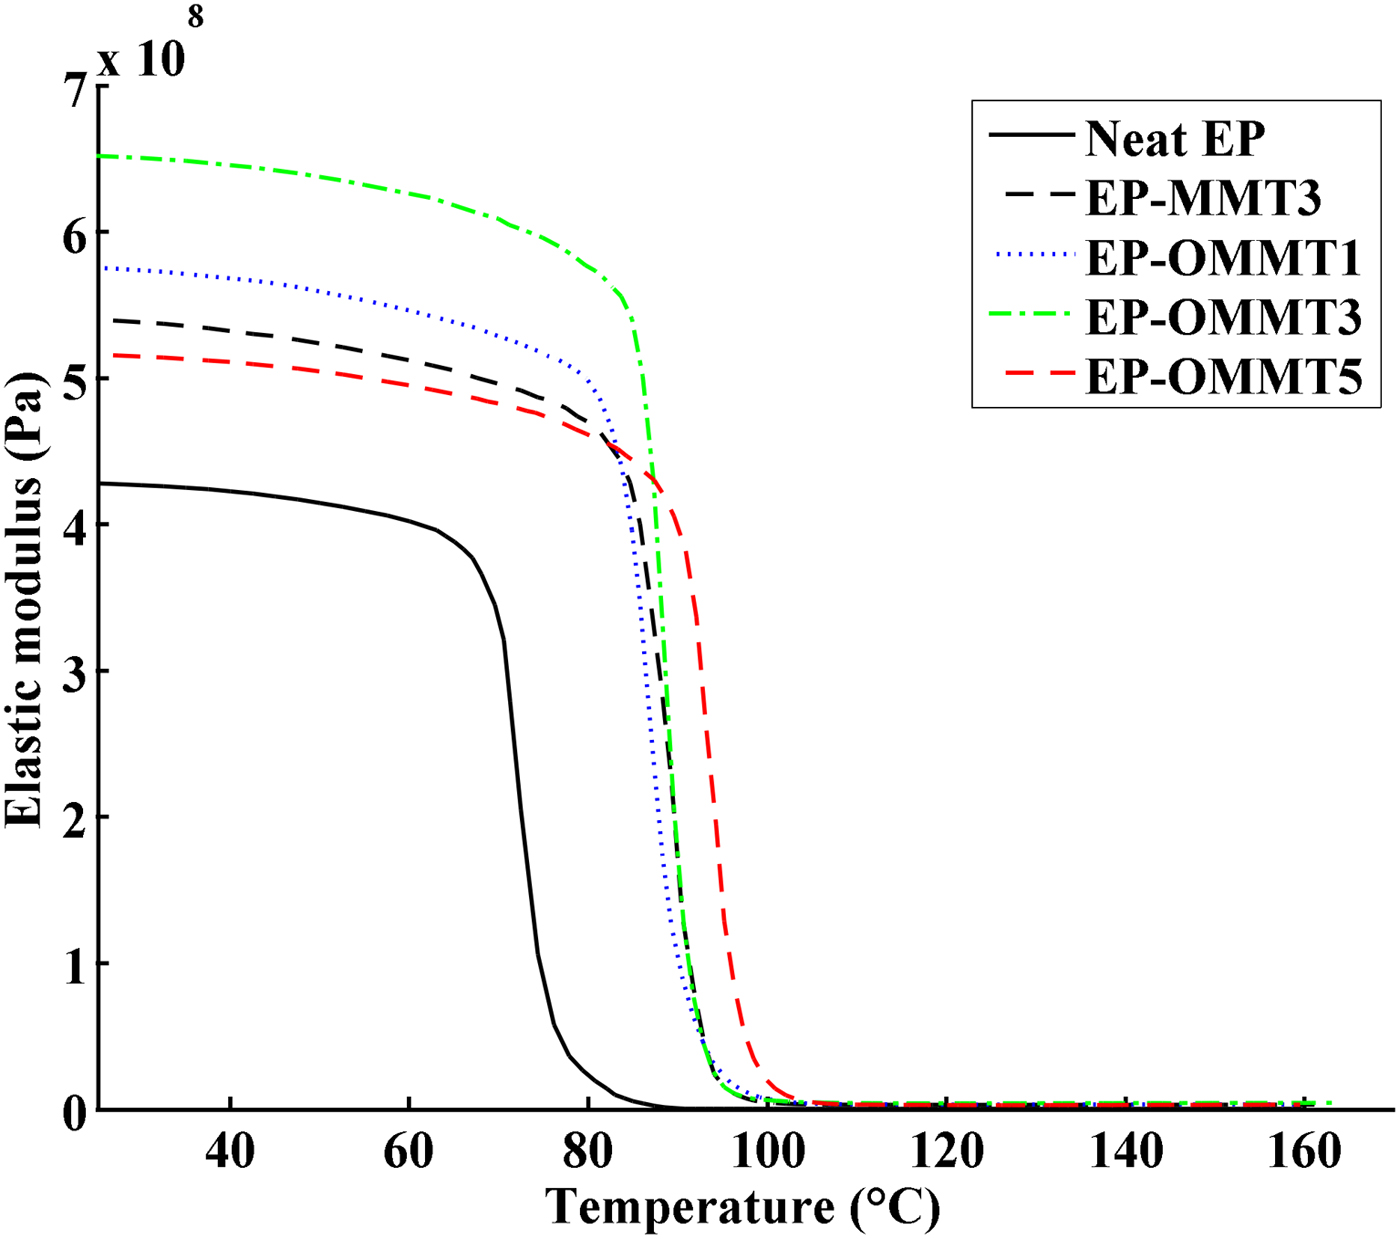
Fig. 8. E′ vs. temperature of neat epoxy coatings and epoxy coatings containing MMT and OMMT.
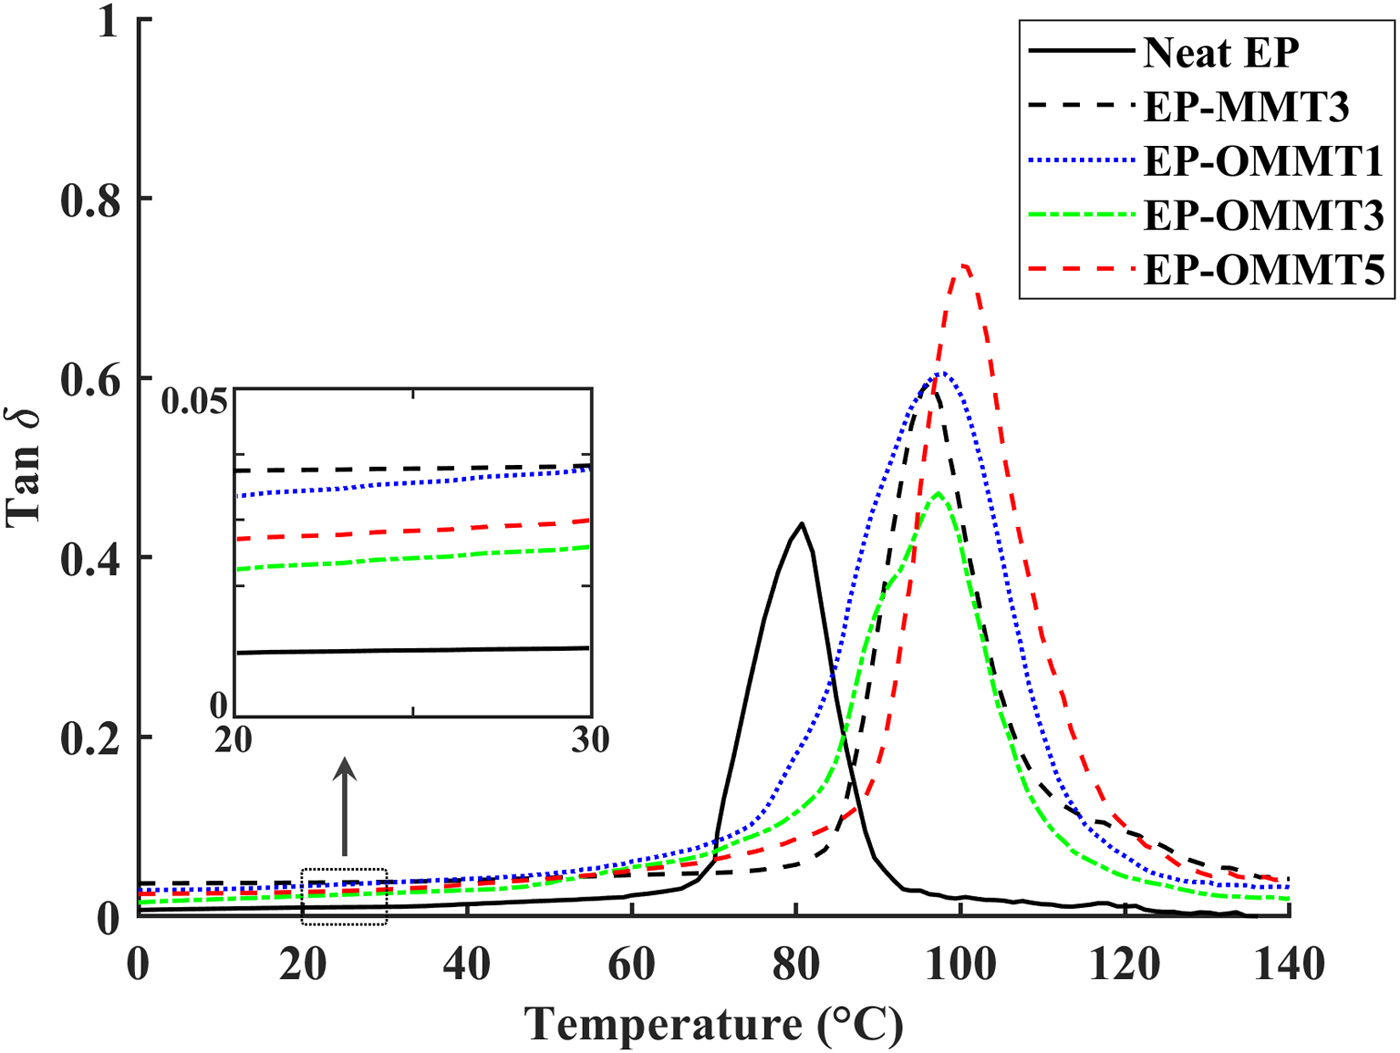
Fig. 9. Tan δ vs. temperature of neat epoxy coatings and epoxy coatings containing MMT and OMMT.
Table 3. T g, E′ at 25°C, S t and FWHM values of the samples.
The temperature for the maximum value of tan δ (damping factor) shows the Tg of the samples. The values of Tg increased (~16–21°C) after incorporation of OMMT and MMT in epoxy coatings (Fig. 9, Table 3). Sample EP-OMMT5 showed the greatest increase in Tg (21.5°C). The influence of clay particles on the Tg of the epoxy coatings is not clearly understood and results are contradictory (Becker et al., Reference Becker, Varley and Simon2002; Kornmann et al., Reference Kornmann, Berglund, Thomann, Mulhaupt and Finter2002; Park & Jana, Reference Park and Jana2003; Nigam et al., Reference Nigam, Setua, Mathur and Kar2004; Prolongo et al., Reference Prolongo, Martínez-Casado, Masegosa and Salom2010; Ferdosian et al., Reference Ferdosian, Ebrahimi and Jannesari2013; García del Cid et al., Reference García del Cid, Prolongo, Salom, Sánchez-Cabezudo and Masegosa2014; Motamedi et al., Reference Motamedi, Attar and Rostami2017). In general, the interaction between epoxy molecular chains and rigid clay layers, the plasticizing effect of clay ammonium-based modifiers on the epoxy molecular chains and the homo-polymerization of epoxy by clay ammonium-based modifiers may be responsible for the variation in the T g of the epoxy composite in previous studies. In the present study, it seems that the increase in the T g of epoxy after incorporation of OMMT and MMT is due to the restriction of epoxy molecular chain movement by MMT layers. Generally, the St and FWHM values of samples filled with OMMT were greater than those of neat samples and samples filled with MMT. The S t and FWHM reflect the energy absorption capacity and polymeric network inhomogeneity of samples, respectively. In fact, the higher S t and FWHM values of epoxy/OMMT samples are indicative of the better energy dissipation and lower network homogeneity as compared to neat epoxy and epoxy/MMT samples (Kuzak & Shanmugam, Reference Kuzak and Shanmugam1999; Almagableh et al., Reference Almagableh, Mantena, Alostaz, Liu and Drzal2009; Gupta et al., Reference Gupta, Mantena and Al-Ostaz2010; Guzmán et al., Reference Guzmán, Ramis, Fernández-Francos and Serra2014; Marasinghe et al., Reference Marasinghe, Croutxé-Barghorn, Allonas and Criqui2018). However, no obvious trend was observed for samples at various filler concentrations.
Electrochemical impedance spectroscopy
In order to evaluate the corrosion protection performance of the coatings, Nyquist and Bode plots of samples were obtained from EIS measurements. The measurements were carried out on the coated steel panels after 2, 30 and 50 days of immersion in 3.5% wt./wt. NaCl solution. Moreover, electrical equivalent circuits used to simulate the behaviour of one-time constant and two-time constant impedance data are shown in Fig 10. The electrochemical parameters of R c (coating resistance), log |Z|0.01 Hz (total impedance at low frequencies) and ƒb (breakpoint frequency) were also obtained and are listed in Table 4. The Nyquist and Bode modulus and phase angle diagrams of all samples after 2 days of immersion in the corrosive electrolyte are shown in Fig. 11. The Nyquist plots of neat EP and EP/OMMT samples presented a single capacitive loop (i.e. one time constant), which corresponds to superior barrier protection of coatings. Furthermore, the values of total log |Z|0.01 Hz of these samples were high, and their θ100 kHz values (phase angle at high frequencies) were almost –90°, suggesting good barrier protection of these samples after a short immersion time. The log |Z|0.01 Hz demonstrates the total resistance of the coating system because of almost direct current (DC) conditions at very low frequencies on the Bode plot (Haddadi et al., Reference Haddadi, Mahdavian and Karimi2015; Motamedi & Attar, Reference Motamedi and Attar2016; Mahmoodi & Ebrahimi, Reference Mahmoodi and Ebrahimi2018). Moreover, the θ100 kHz shows the tendency for current to pass from the capacitance or resistance elements of the coating. The θ100 kHz values of about –90° show the current passage from the capacitance element due to high resistance of the coating (Mahdavian & Attar, Reference Mahdavian and Attar2006). However, the appearance of a second loop in the Nyquist plot of the EP-MMT3 sample was attributed to activation control through charge transfer at the interface of the steel surface and the EP-MMT3 coating, even after only a short immersion time. This occurrence demonstrates that the electrochemical reactions at the metal/coating interface are in progress (Kendig et al., Reference Kendig, Mansfeld and Tsai1983). In addition, the total impedance at low frequency of EP-MMT3 was almost one order of magnitude less than for the other samples, possibly because of diffusion of corrosive electrolyte beneath the coating and initiation of the corrosion reaction at the steel substrate/coating interface.
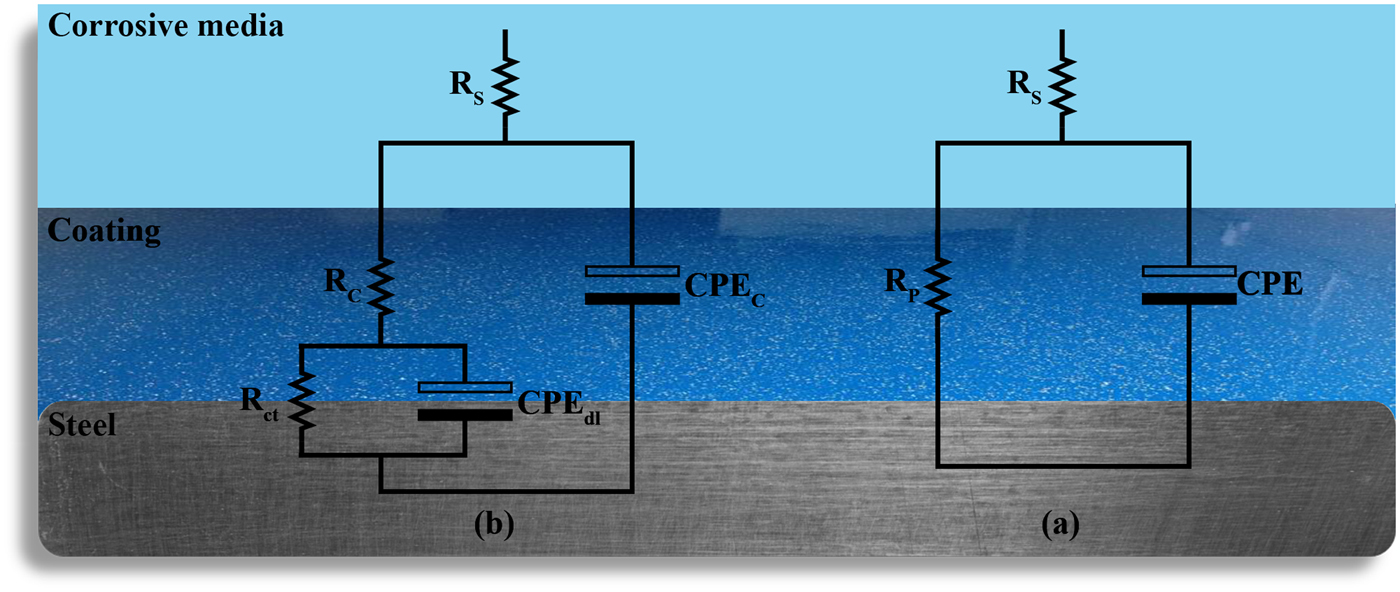
Fig. 10. The equivalent electrical circuits of (a) one-time constant (b) two-time constant impedance data. CPEC, CPEdl, RP, Rs and Rct stand for coating constant phase element, double-layer constant phase element, polarization resistance, solution resistance and charge transfer resistance, respectively.
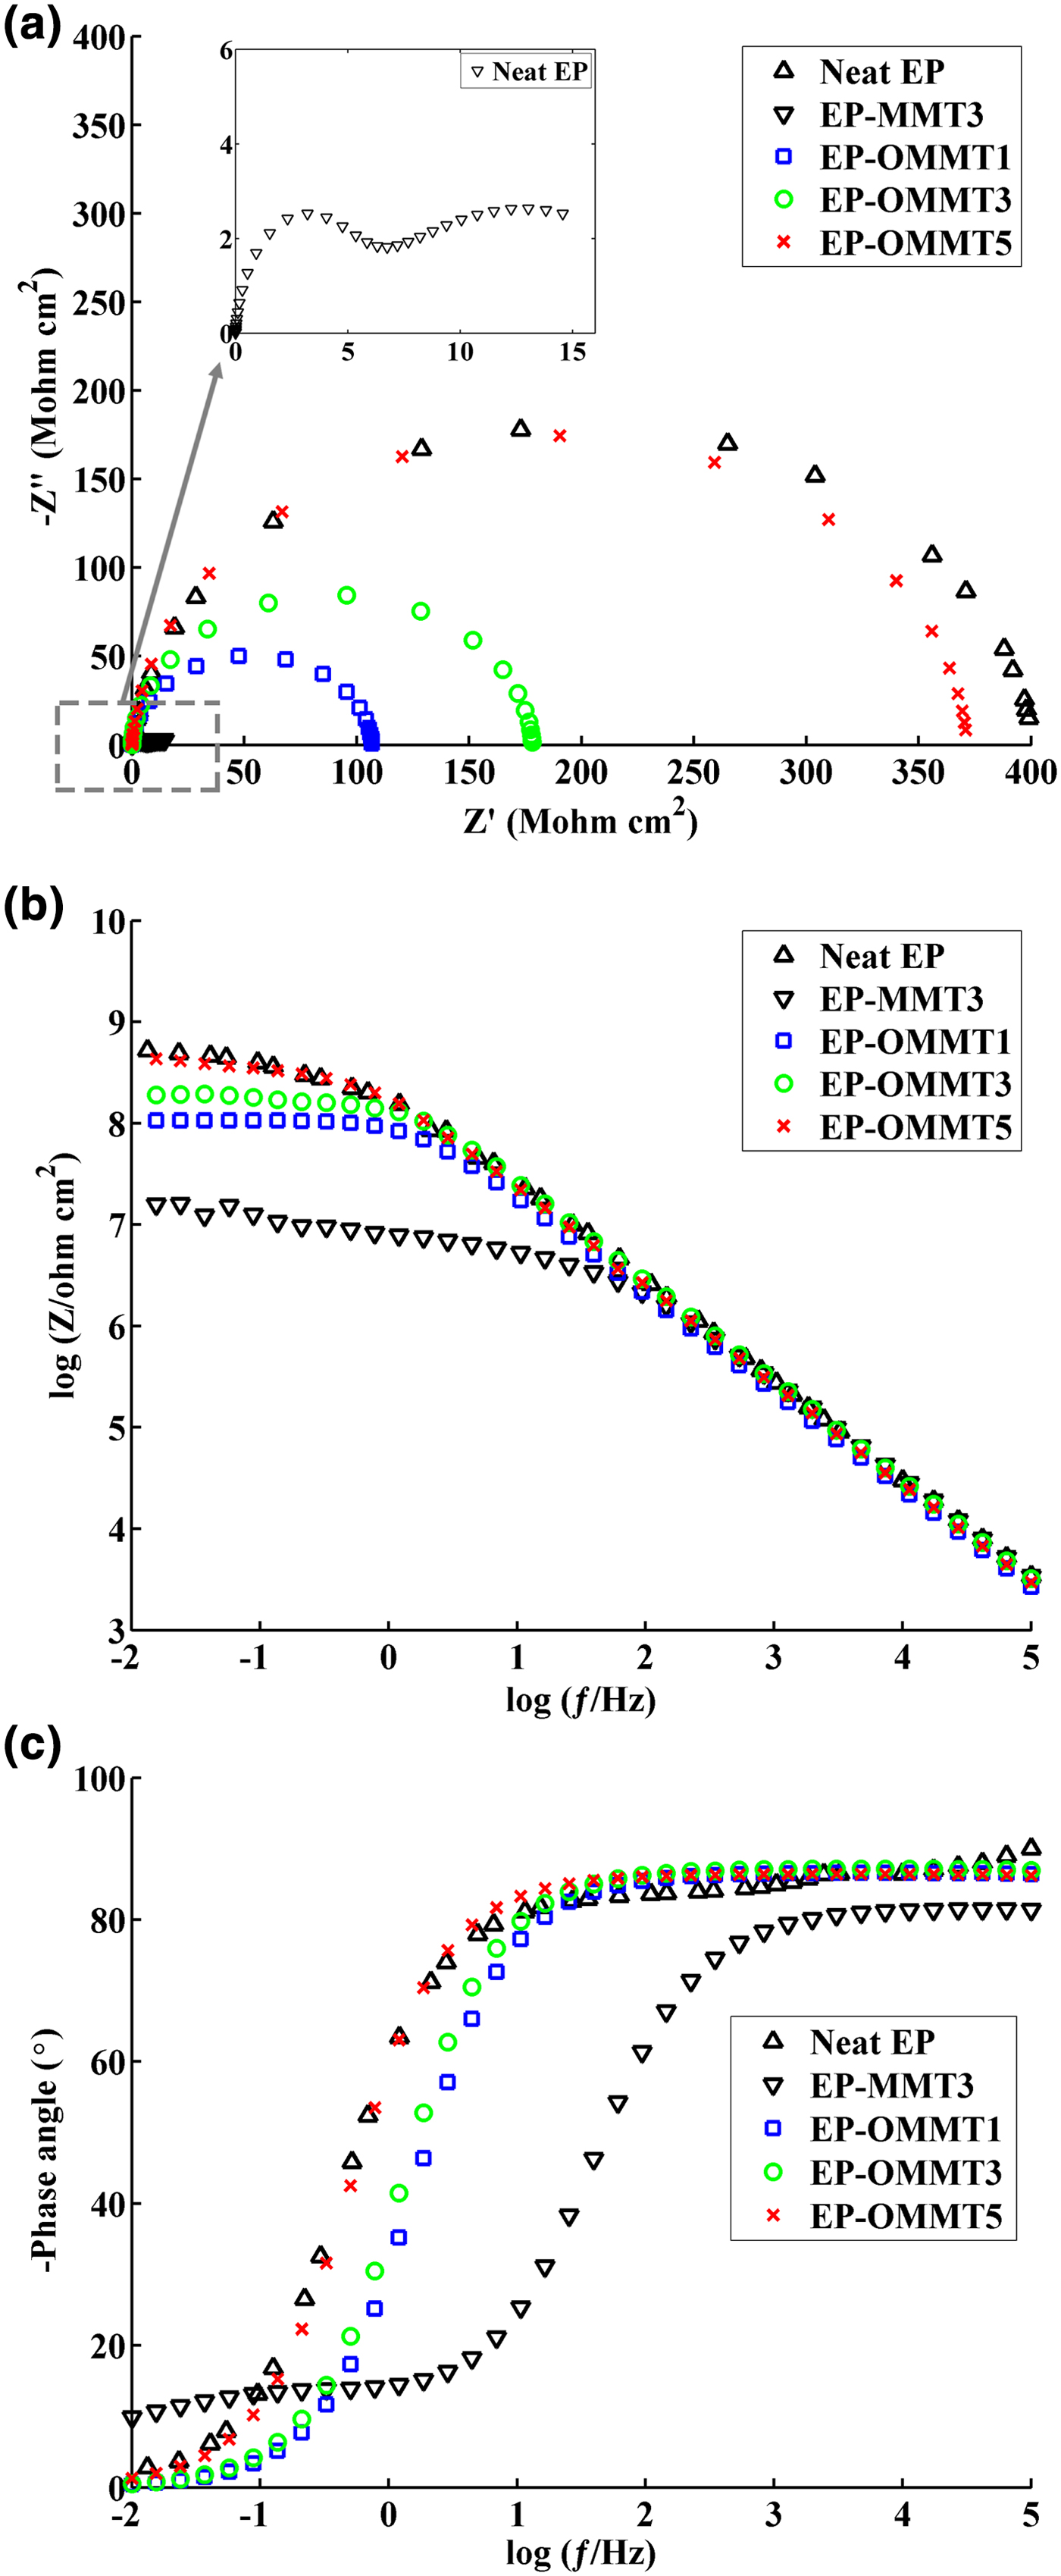
Fig. 11. The Nyquist (a), Bode (b) and phase angle (c) plots of the samples after 2 days of immersion in corrosive media.
Table 4. Impedance data of the samples.
At longer immersion times (30 and 50 days), the radius of the first loop decreased and a semi-circular loop appeared on the Nyquist diagrams of all samples (Figs 12 and 13). The values for log |Z|0.01 Hz and the phase angle also significantly decreased for all samples. The greatest decrease in log |Z|0.01 Hz after 50 days of exposure to corrosive electrolyte was ~27% for both neat EP and EP-MMT3, and the smallest decrease was obtained for EP-OMMT1 and EP-OMMT3, with a value of ~10%. These results demonstrate that all samples have lost their barrier protection performance, but this was less pronounced for coatings containing OMMT.
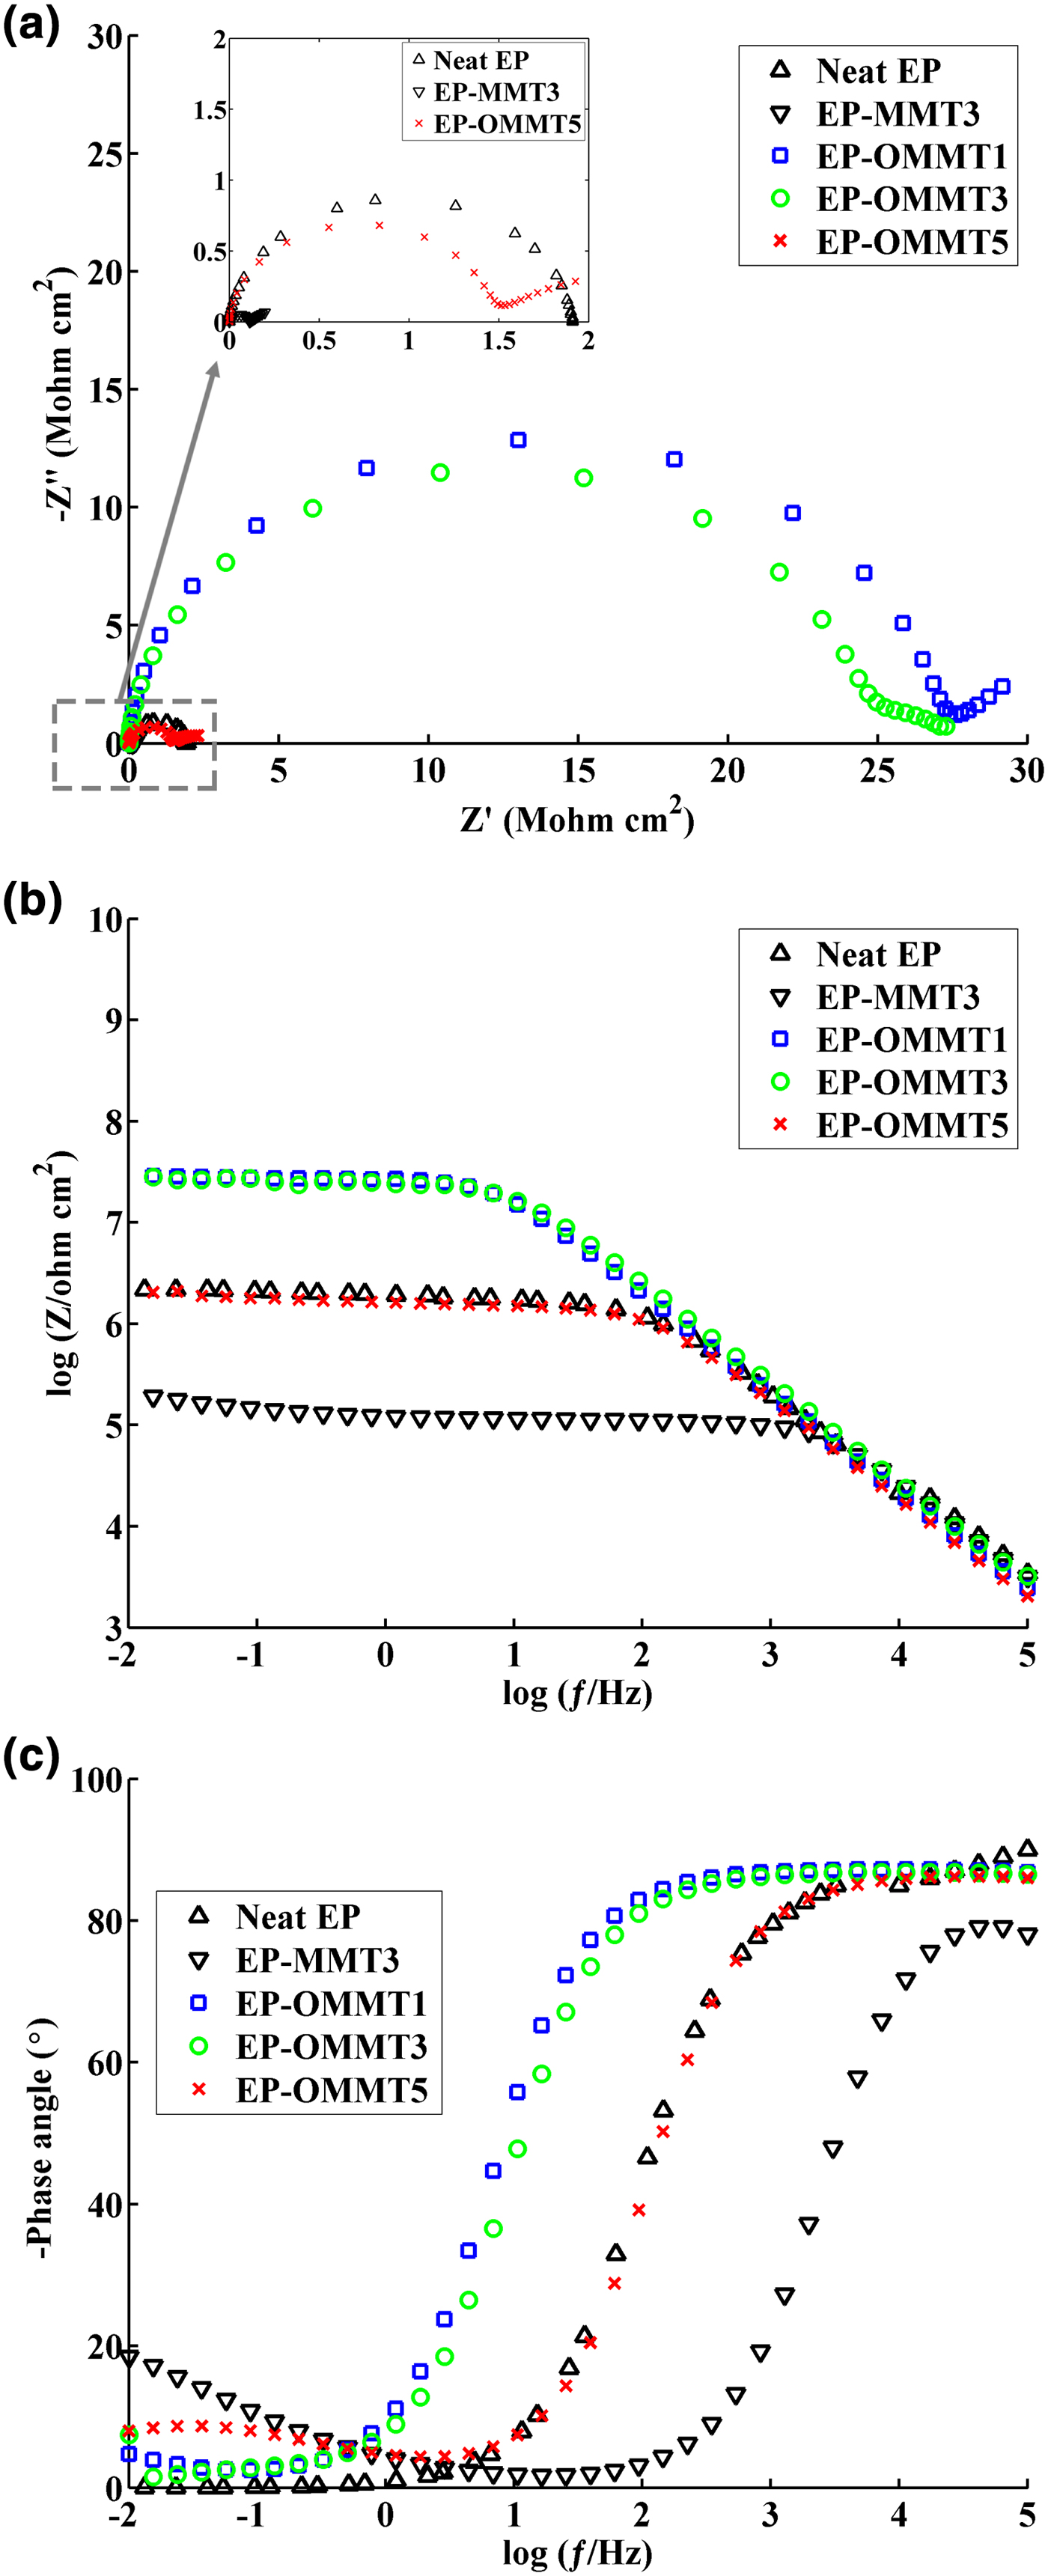
Fig. 12. The Nyquist (a), Bode (b) and phase angle (c) plots of the samples after 30 days of immersion in corrosive media.
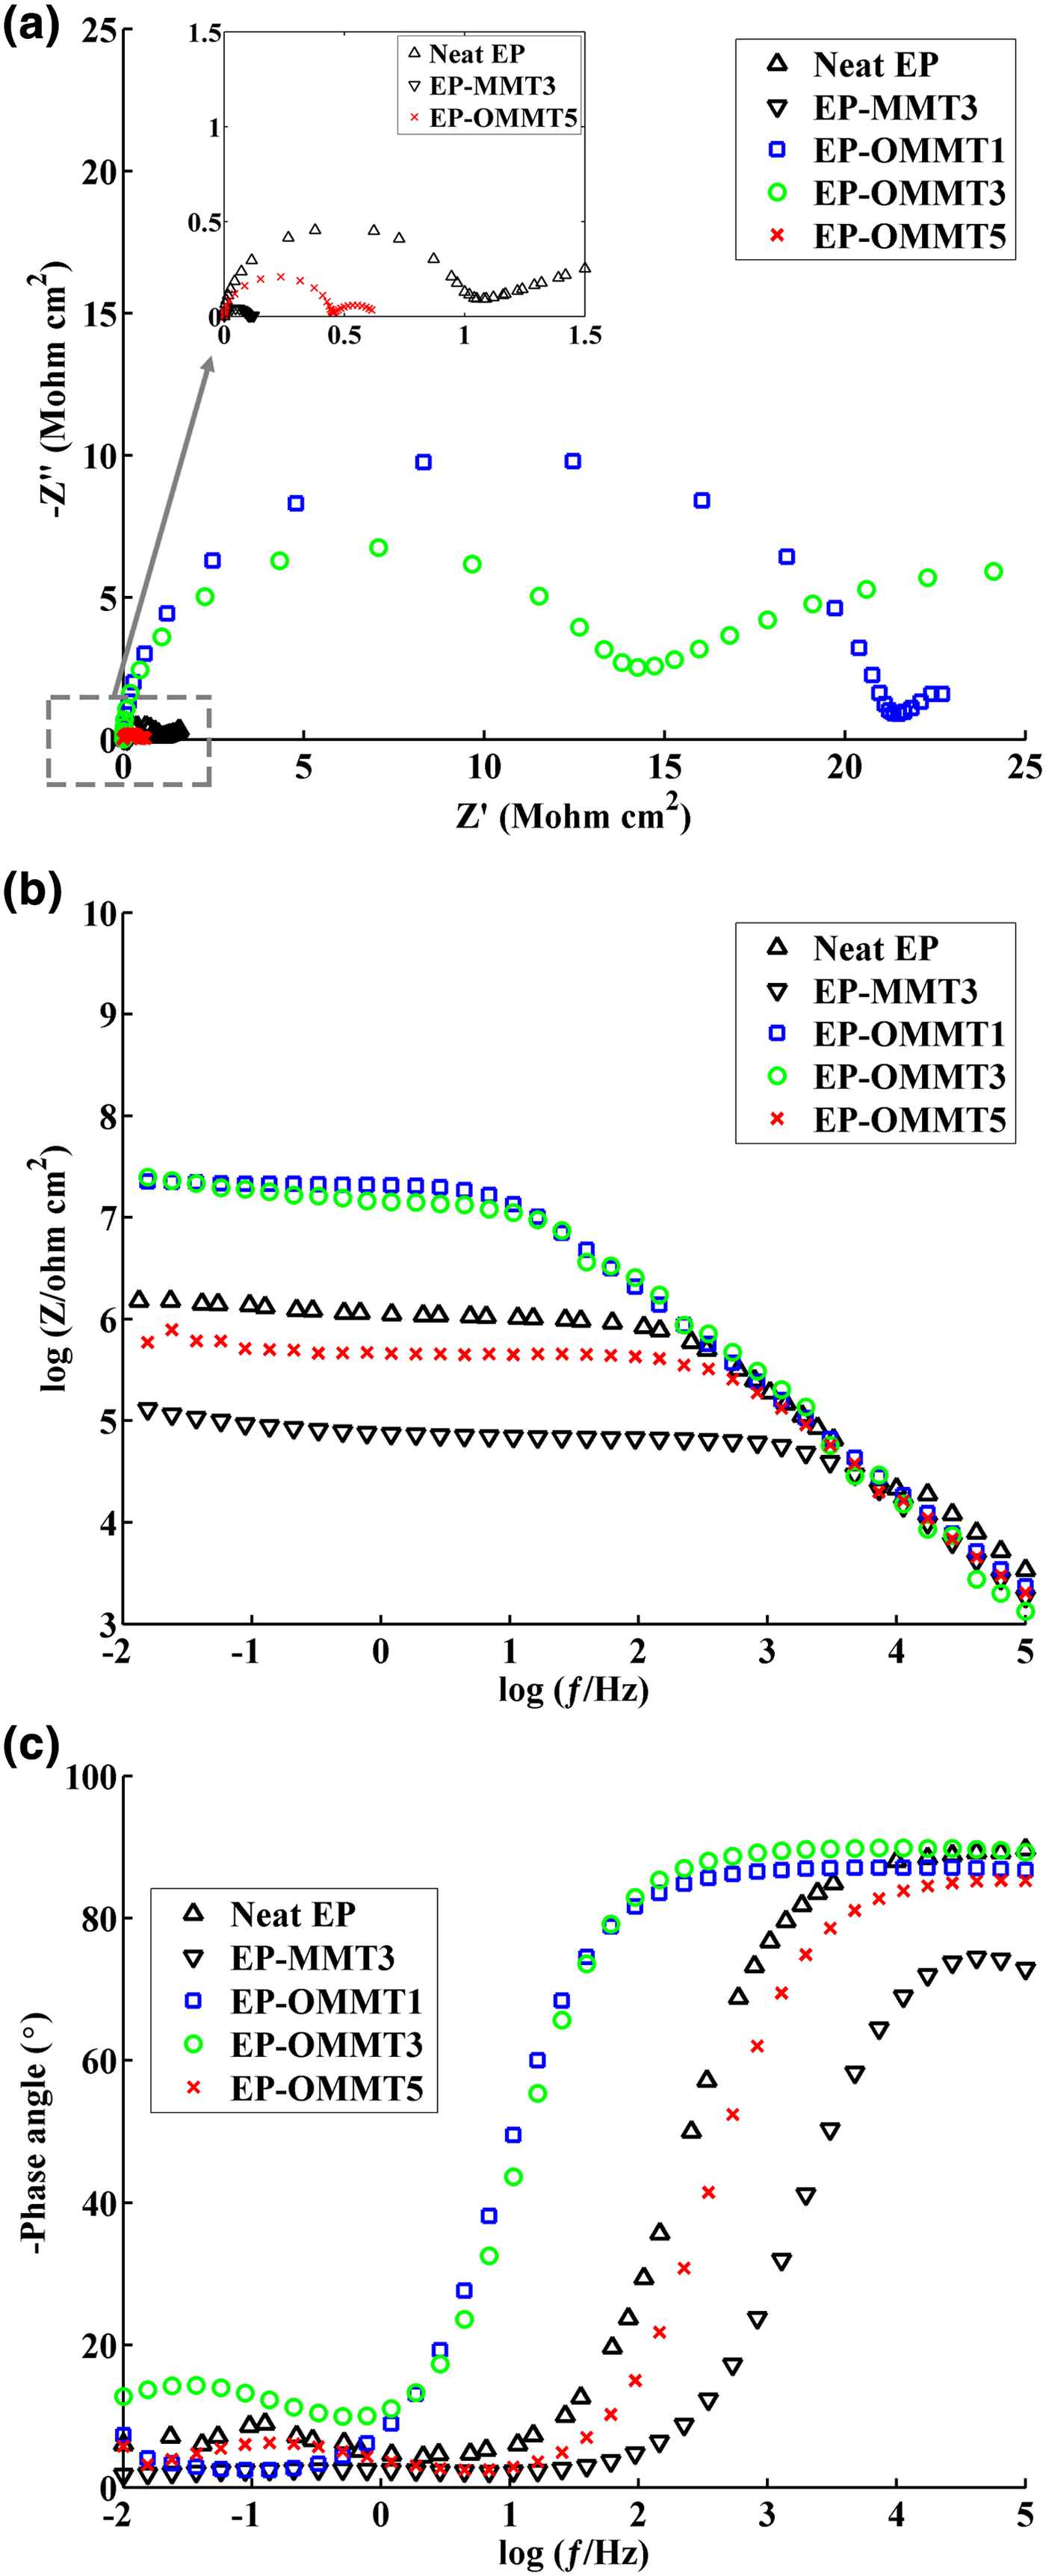
Fig. 13. The Nyquist (c), Bode (b) and phase angle (c) plots of the samples after 50 days of immersion in corrosive media.
The R c is another important parameter that describes the corrosion protection performance of coatings. After 30 and 50 days of immersion, the EP-OMMT1 and EP-OMMT3 samples showed greater R c values compared to those of other samples (Table 4). It seems that the addition of 1% and 3% of OMMT to the epoxy coating led to better corrosion protective performance of the coating, possibly because of the better dispersion state of OMMT as compared to MMT in the epoxy matrix. In fact, more intercalated/exfoliated OMMT layers in the epoxy matrix (confirmed by XRD and TEM results) impose a longer diffusion pathway on corrosive species through the coating. With increasing immersion time, the corrosion reaction continues also, resulting in more production of hydroxyl ions at the interface of the coating and steel substrate. The hydroxyl ions may break the interfacial bonding of the coating and steel substrate, causing delamination of the coating from the substrate. The ƒb parameter, which represents the frequency value at the phase angle of 45°, was used to assess the delaminated area of the coatings (Haruyama et al., Reference Haruyama, Asari and Tsuru1987). The values of ƒb increased as immersion time increased; the greatest increase in ƒb was obtained for the EP-MMT3 sample and the smallest increases were observed for EP-OMMT1 and EP-OMMT3 (Table 4). A slight increase in ƒb for coatings containing OMMT confirmed the smaller delaminated areas of these samples as compared to neat coatings and MMT-containing coatings.
Pull-off adhesion
Figure 14 shows the pull-off adhesion strength of the various coatings before and after 1 week of immersion in 3.5% wt./wt. NaCl solution. The adhesion-loss values of the samples were also calculated according to equation 1.
 $$\eqalign{& \hbox{Adhesion loss}\cr & \quad =\hbox{Dry adhesion strength-} \cr & {\hbox{Recovered adhesion strength}\over \hbox{Dry adhesion strength}}\times 100}$$
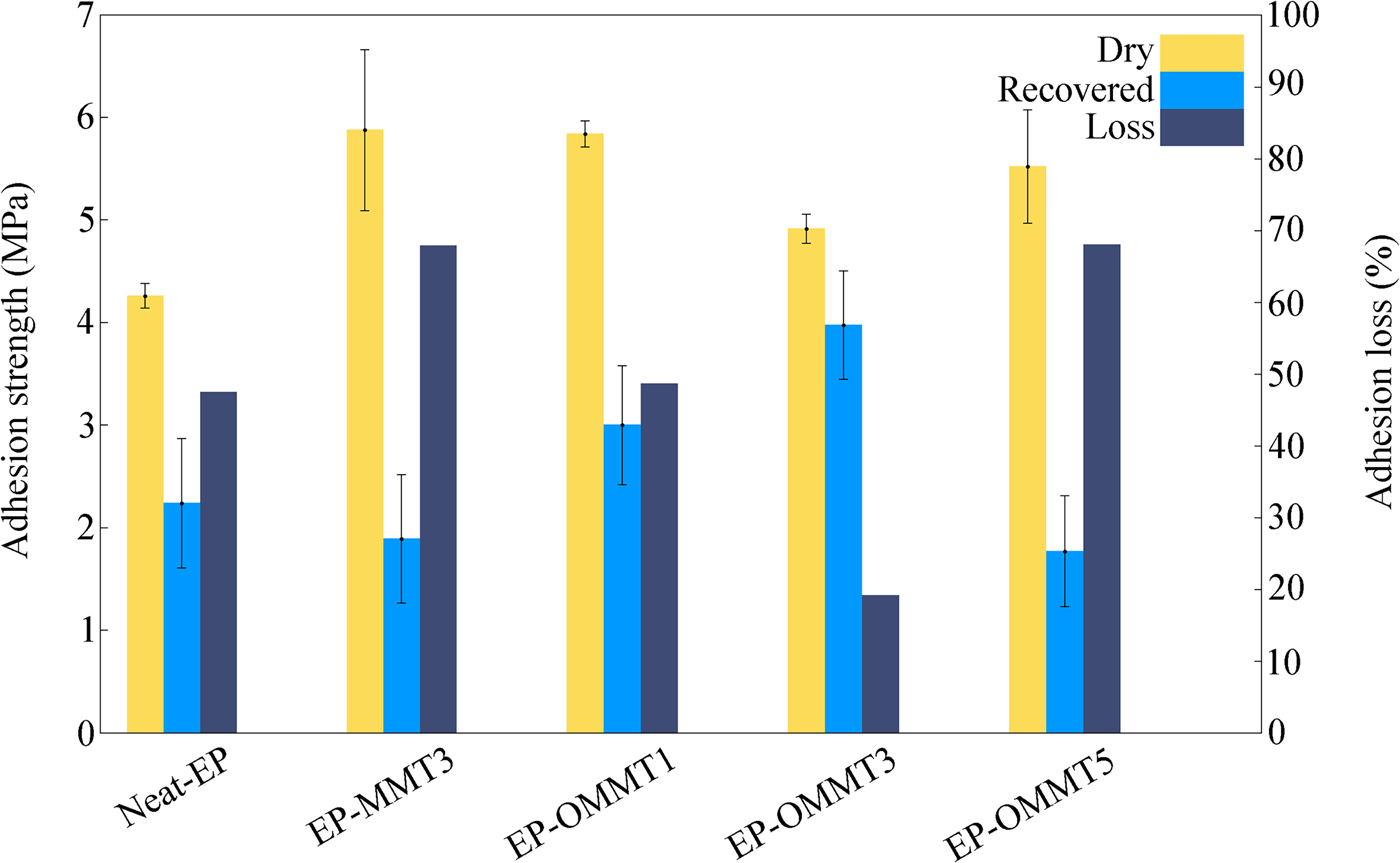
Fig. 14. The adhesion strengths and adhesion losses of the samples.
After 1 week of immersion of the samples in corrosive media, all samples lost their adhesion strength due to scission of interfacial bonding between the coating and steel substrate and construction of a weak boundary layer after recovery. The greatest adhesion losses were observed for the EP-MMT3 and EP-OMMT5 samples (>67%) and the smallest adhesion loss was observed for the EP-OMMT3 sample (<20%). These results correlate well with the results obtained from the EIS data. The smaller adhesion losses of the samples containing OMMT to steel substrate compared to the samples containing MMT were attributed to the modification of MMT with HDTB, which led to the better dispersion of clay particles in the epoxy matrices. In other words, a coating with a more exfoliated/intercalated structure offers greater barrier protection, which blocks electrolyte permeation through the bulk coating and prevents the access of corrosive species to the active sites of the steel surface. Again, possible re-aggregation of MMT layers in the EP-OMMT5 sample increased the probability of defects in the coating during film formation. Such a coating film would be more permeable to corrosive species. The greatest dry adhesion strengths belong to the EP-MMT3 and EP-OMMT1 samples.
Adhesion strength is a function of two major factors (Packham, Reference Packham2003):
– Physical, chemical or interlocking bonding strength between coating and substrate.
– Viscoelastic properties of the adhered phase.
Because substrate natures and surface preparations were similar for all samples, it may be assumed that the differences between the dry adhesion strengths of the samples are related to different viscoelastic properties of the coatings. At the pull-off temperature (25°C), due to the lower stiffness of the EP-MMT3 and EP-OMMT1 samples (i.e. greater tan δ values [i.e. damping factor] in the tan δ vs. temperature curves, which indicate lower stiffness at 25°C; cf. Fig. 9), a greater amount of energy was dissipated in their bulks. Thus, greater force was needed to separate the coating from the substrate (Ghodrati et al., Reference Ghodrati, Mohseni and Gorji Kandi2015). In contrast, in the EP-OMMT3 sample, due to its high level of stiffness (i.e. smaller tan δ value, which indicates greater stiffness at 25°C; cf. Fig. 9), energy was transferred through the bulk coating with lower dissipation. Consequently, the coating was separated from the substrate under lower applied force.
The predominant coating failure in the dry pull-off test was of the cohesive type for all samples (Fig. 15), suggesting that the coating was not separated from the substrate, but rather the bulk coating was torn off. On the other hand, in the recovered pull-off test, the predominant coating failure type was of the adhesive type for most samples, excluding EP-OMMT3 (Fig. 15), indicating separation of the coating from the substrate. In other words, the adhesion failure occurred at the substrate/coating interface, not in the bulk coating. These failure patterns represent the permeation of corrosive species and weakening of coating/substrate bonds after 1 week of immersion in corrosive media. However, for the EP-OMMT3 sample, the failure type was still cohesive after 1 week of immersion, which is in agreement with the EIS results (Table 4). Finally, the standard deviation values of repetition of the pull-off test for the EP-OMMT and EP-OMMT3 samples are remarkably small. This is due to the uniform distribution of MMT particles throughout the coating, which yields reproducible pull-off results on different parts of the coatings.
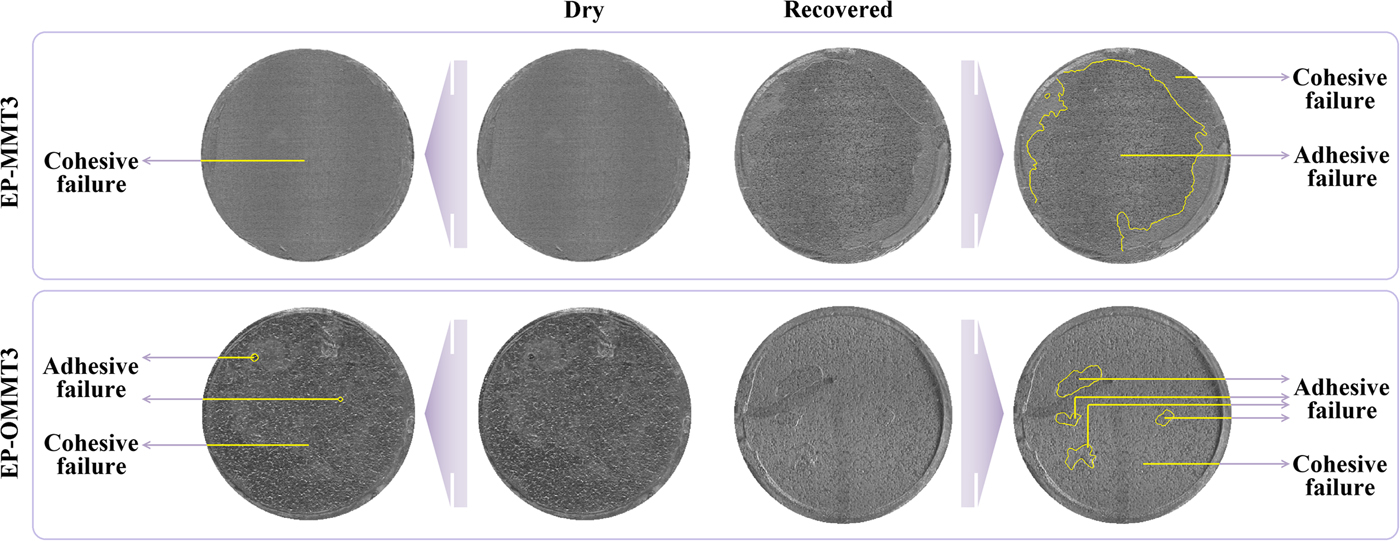
Fig. 15. EP-MMT3 and EP-OMMT3 coating failure types in the pull-off test before and after 1 week of immersion in 3.5 wt.% NaCl solution.
Salt spray
The digital images of samples after 1 day and 1 week of exposure to the salt spray test chamber are shown in Fig. 16. After 1 day of exposure, small amounts of corrosion products were observed near the incision for all samples and the resistance against corrosion was comparable among the samples. After 1 week of exposure, the difference in corrosion resistance among the samples was more obvious. The amounts of corrosion products, rust and possible blisters in the neat samples and the samples containing MMT were visually greater than for the samples containing OMMT. Smaller and more corroded areas were observed for EP-OMMT3 and EP-MMT3, respectively. Blisters were also observed around the scratches over the neat and EP-MMT3 samples.
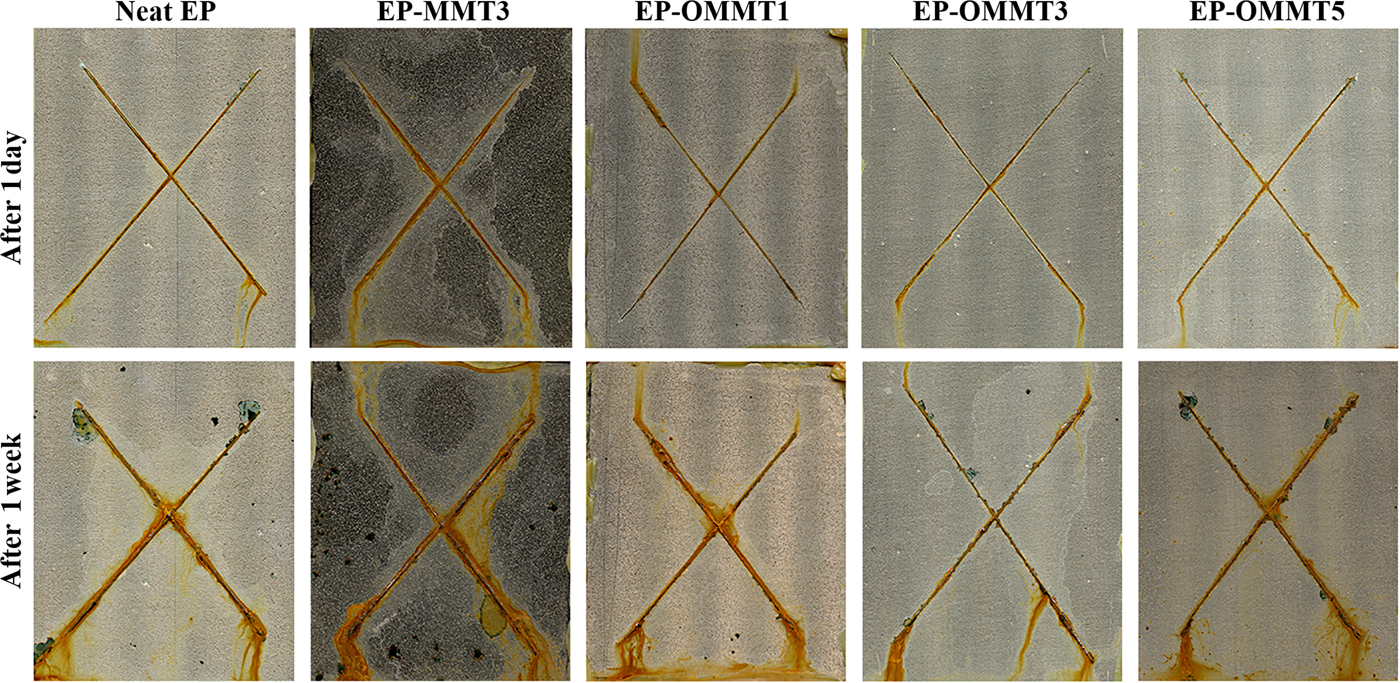
Fig. 16. Digital images of samples after 1 day and 1 week of salt-spray testing.
Quantitative evaluation of the corroded areas of samples was performed with the Canny edge detection image processing method. The image-processing procedure for the determination of EP-OMMT3 sample corroded areas after 24 and 168 h exposure is illustrated in Figs 17 and 18, respectively. After 24 h of exposure, the smallest corroded area was observed for the EP-OMMT3 sample (25,531 pixels) and the largest corroded area was for the EP-MMT3 sample (83,033 pixels). After 1 week of exposure, the smallest and the largest corroded areas were still observed for the EP-OMMT3 (69,879 pixels) and EP-MMT3 (227,990 pixels) samples, respectively. These results indicated that after 1 week of exposure, the sample with 3 wt.% of modified MMT (EP-OMMT3) displayed 70% better corrosion protection in comparison to the sample with 3 wt.% of unmodified MMT (EP-MMT3). The corrosion protection performance of the EP-OMMT3 sample is still 70% better than that of the EP-MMT3 sample after 1 week of exposure. These observations are attributed to weak dispersion of MMT layers in the EP-MMT3 sample, which deteriorated barrier protection of the coating and caused defects in the coating film.
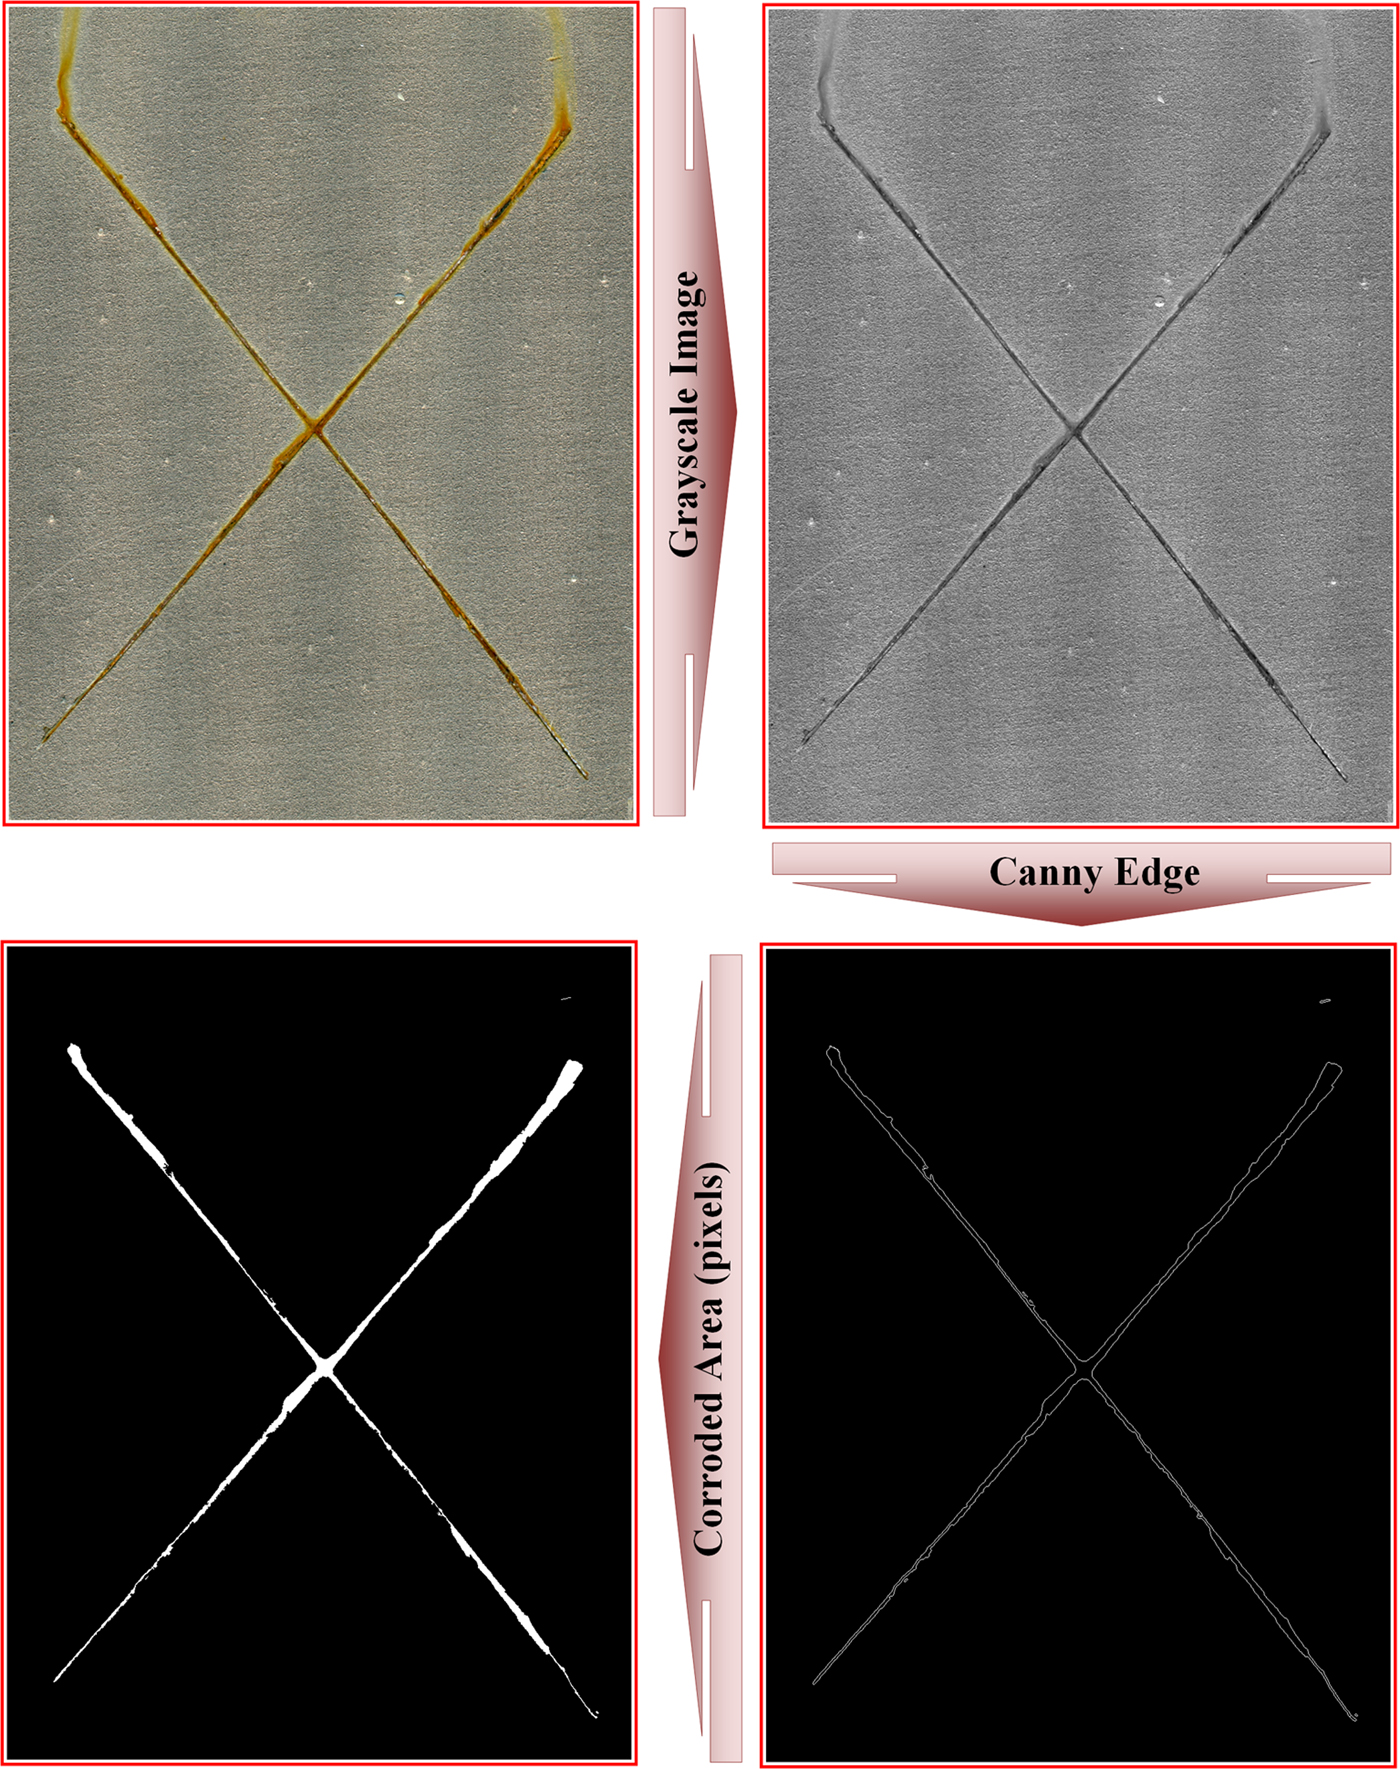
Fig. 17. Image-processing procedure for the determination of an EP-OMMT3 sample corroded area after 24 h of exposure.
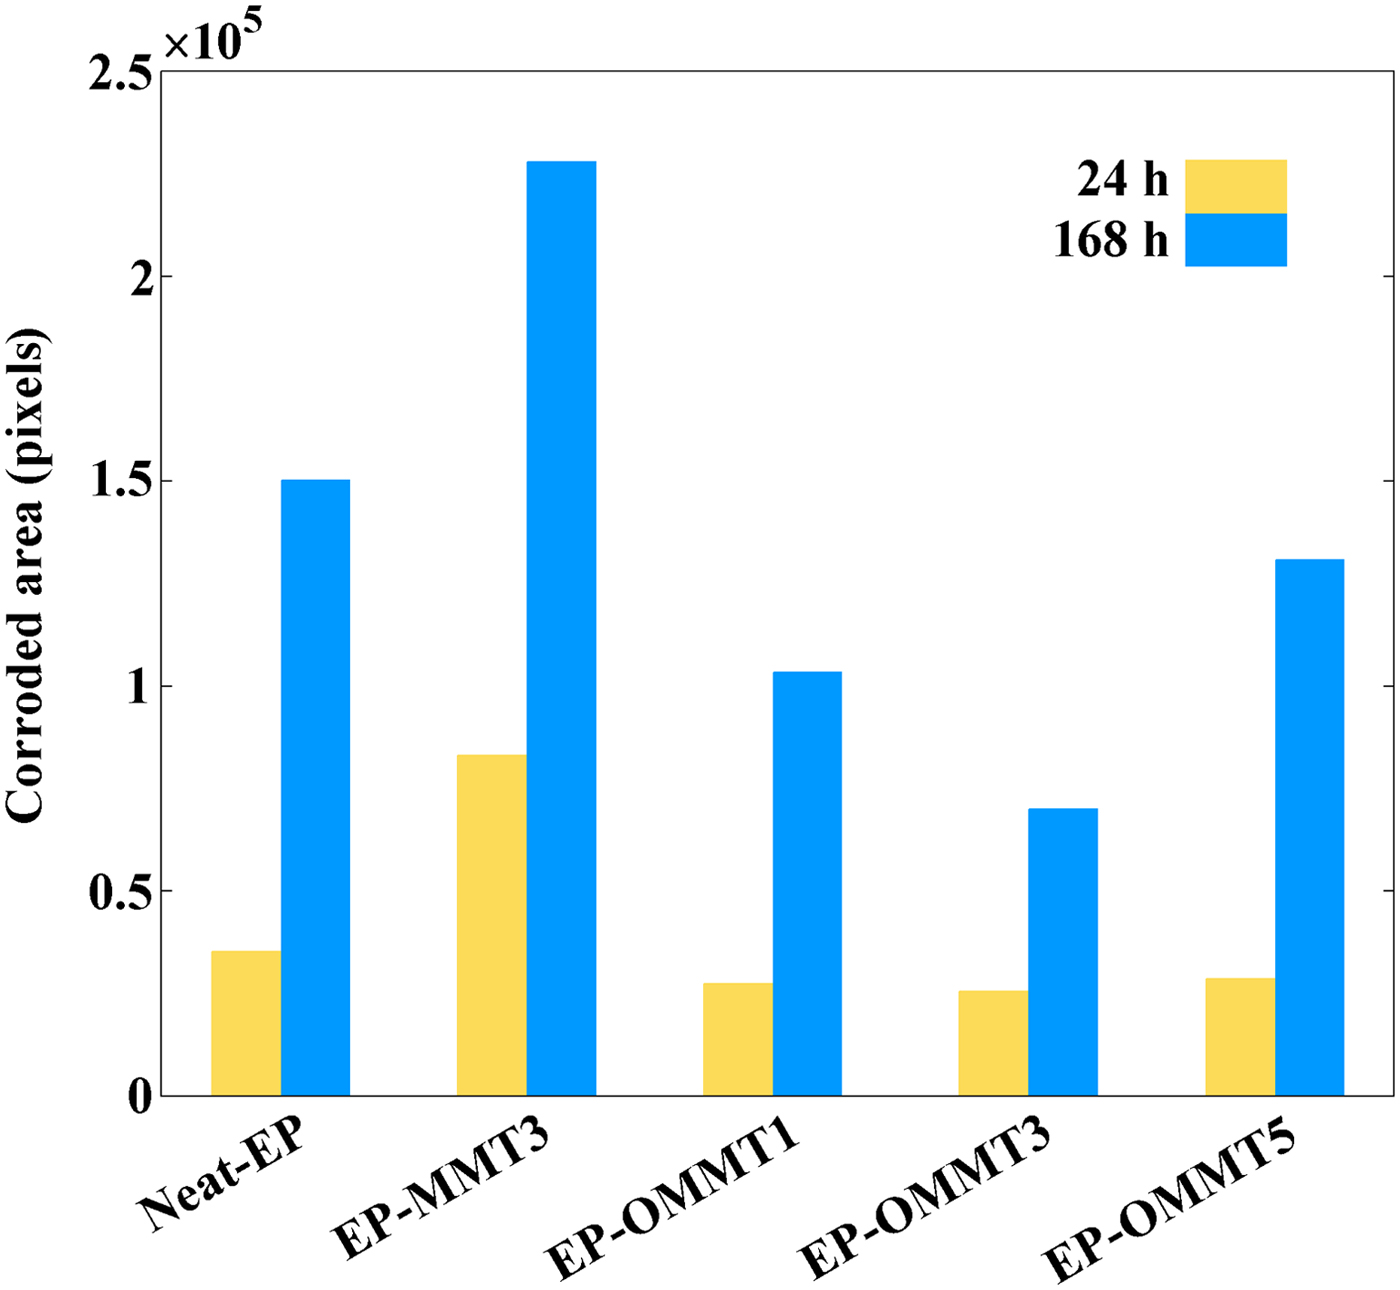
Fig. 18. Corroded area of each sample after 24 and 168 h of exposure to the salt-spray chamber in terms of pixels.
CONCLUSIONS
An OMMT was synthesized successfully through cation exchange between HDTB and an Iranian MMT and was applied in an epoxy coating formulation. The following conclusions can be drawn from this work:
1. The CER between HDTB and MMT was carried out in aqueous media at ambient conditions with a very high reaction yield (97%).
2. The dispersion state of OMMT, especially at lower concentrations, was significantly better than that of MMT in epoxy coating due to the greater compatibility of OMMT with epoxy coatings compared to MMT; the extent of intercalation/exfoliation for the epoxy/OMMT samples was greater in comparison with the epoxy/MMT sample.
3. Dynamic mechanical analysis revealed that the introduction of OMMT into the epoxy coating significantly increased its E′ and T g values by up to 54% and 21.5°C, respectively. The better dispersion state of OMMT in the epoxy coating compared to MMT resulted in better dynamic mechanical properties of the epoxy/OMMT composite in comparison with the epoxy/MMT composite.
4. The corrosion protection performance of the epoxy coating was significantly improved after the addition of OMMT at 1 and 3 wt.% due to the improvement of barrier properties of the epoxy coating by OMMT layers. The poor dispersion state of MMT and concentrated OMMT at high OMMT loading levels in the epoxy matrix reduced the anticorrosive and adhesion properties of the epoxy coating.
SUPPLEMENTARY MATERIAL
The supplementary material for this article can be found at https://doi.org/10.1180/clm.2018.41.