


Many industrial activities discharge significant amounts of pollutants such as dyes into water sources and cause various problems for humans and animals. Some dyes are toxic to living organisms; thus, the production of purified water has been an important issue in previous works (e.g. Vasques et al., Reference Vasques, Carpiné, Dagostin, Canteli, Igarashi-Mafra, Mafra and Scheer2014). Crystal violet (CV) is a toxic and carcinogenic cationic dye. It has many industrial applications and so its removal from wastewater is essential (Li, Reference Li2010). Several methods have been employed for the purification of contaminated water, and a straighforward and inexpensive technique is adsorption (García-Montaño et al., Reference García-Montaño, Pérez-Estrada, Oller, Maldonado, Torrades and Peral2008; Nezamzadeh-Ejhieh & Shahriari, Reference Nezamzadeh-Ejhieh and Shahriari2011). Several kinds of adsorbents are used in the removal of dyes from wastewater, e.g. clay minerals (Zhu et al., Reference Zhu, Chen, Liu, Ge, Zhu, Zhu and He2014; Sarabadan et al., Reference Sarabadan, Bashiri and Mousavi2019b), activated carbon (Chen et al., Reference Chen, Zhai, Liu, Song, An and Song2013), agricultural wastes (Subramaniam & Kumar Ponnusamy, Reference Subramaniam and Kumar Ponnusamy2015) and chitosan (Wang et al., Reference Wang, Zhang and Wang2008). Clay minerals are suitable adsorbents for this purpose because of their large specific surface area, non-toxic character, low cost and ample availability (Ali et al., Reference Ali, Asim and Khan2012; Chen et al., Reference Chen, Zhou, Fiore, Tong, Zhang, Li, Ji and Yu2016; Cohen et al., Reference Cohen, Joseph, Lapides and Yariv2018).
Among clay minerals, montmorillonite (Mnt) is suitable for the adsorption of dyes (Fahn & Fenderl, Reference Fahn and Fenderl1983). It is a 2:1 layer silicate consisting of one octahedral sheet placed between two tetrahedral sheets, forming layers with a negative charge (Atta et al., Reference Atta, Al-Lohedan, Alothman, Abdel-Khalek and Tawfeek2015; Sarabadan et al., Reference Sarabadan, Bashiri and Mousavi2019b). Adsorption of pollutants on Mnt is improved by replacing the interlayer cations (e.g. Na+ and Ca2+) with organic cations. The Mnt nanoparticles have a large specific surface area, which enhances their adsorption capacity. In this work, Mnt nanoparticles were used in an attempt to overcome some of the drawbacks of the dye-adsorption process, such as adsorbent separation from the whole solution. Separation of nanoparticles from the solution is a difficult task requiring centrifugation at high rotation speeds. Effective modification of the nanoparticles is required. Recently, we have used zeolite as a support for Mnt nanoparticles to facilitate separation (Sarabadan et al., Reference Sarabadan, Bashiri and Mousavi2019a). Often the pure Mnt is modified by surfactants (Zhang et al., Reference Zhang, Zhang, Liao and Xia2013; Acisli et al., Reference Acisli, Khataee, Karaca and Sheydaei2016; Nourmoradi et al., Reference Nourmoradi, Avazpour, Ghasemian, Heidari, Moradnejadi, Khodarahmi, Javaheri and Moghadam2016; Gamoudi & Srasra, Reference Gamoudi and Srasra2018). Previously, Wang et al. (Reference Wang, Wang, Sun, Zheng and Xi2017) investigated the effects of non-ionic surfactant-modified Mnt on methylene blue dye. Montmorillonite modified with cetyltrimethylammonium bromide was used for adsorption of a textile dye (Kıranşan et al., Reference Kıranşan, Soltani, Hassani, Karaca and Khataee2014) and Cu(II)-loaded Mnt was tested for CV removal from aqueous solution (Wang & Zhang, Reference Wang and Zhang2011). A maximum adsorption capacity for CV of 114.3 mg g–1 was obtained for Cu(II)-loaded Mnt. Monash & Pugazhenthi (Reference Monash and Pugazhenthi2009) used calcined and raw clays containing kaolin, ball clay, feldspar, pyrophyllite and quartz for the removal of CV from aqueous solution and reported a considerable increase in the dye adsorption capacity after calcination of an order of magnitude greater than that of the uncalcined mixed clay. Recently, zeolite-Mnt nanoadsorbents were used for the removal of CV from water, with a maximum removal efficiency of 99.9% (Sarabadan et al., Reference Sarabadan, Bashiri and Mousavi2019a).
In this study, the hyamine surfactant was used because it is a cationic and non-toxic surfactant with significant water solubility (due to its polar head). The particle size of Mnt nanoparticles is very small, and separation from solution is complex, even with high-speed centrifugation. Hyamine and sodium dodecyl sulfate (SDS) surfactants were used to modify Mnt nanoparticles. The modified Mnt can easily be separated from solution with filter paper, and there is no need for centrifugation. Therefore, they can be separated from aqueous solution more easily than can pure Mnt nanoparticles.
To increase the dye-removal efficiency, the controlling variables on dye removal should be optimized. Response surface methodology (RSM) is a common method used for experimental design to achieve optimal conditions with a minimal number of experiments (Mousavi et al., Reference Mousavi, Salari, Niaei, Panahi and Shafiei2014; Sarabadan et al., Reference Sarabadan, Bashiri and Mousavi2019a, Reference Sarabadan, Bashiri and Mousavi2019b). For example, Alipanahpour Dila et al. (Reference Alipanahpour Dila, Ghaedi, Ghaedi, Asfaram, Jamshidi and Purkait2016) modelled quaternary dye adsorption onto artificial neural networks using RSM. In addition, Rasouli et al. (Reference Rasouli, Aber, Salari and Khataee2014) optimized the removal of reactive navy blue by organic Mnt.
Mnt-hyamine and Mnt-hyamine-SDS nanocomposites were used here as effective adsorbents for CV removal. The effects of some essential variables on dye removal was tested using RSM, and equilibrium, kinetic and thermodynamic studies of adsorption were performed. The maximum adsorption capacities of Mnt nanoparticles and the adsorbents prepared here are compared with other adsorbents.
Experimental
Materials and methods
Montmorillonite nanoparticles (Cloisite-Na+®; of 99% purity) were purchased from Southern Clay Products, Inc. (Texas, USA). The specific gravity of Cloisite-Na+ is 0.7 g cm–3 with particle sizes of 10 nm–2 μm, and its cation-exchange capacity (CEC) is 48 meq 100 g–1. The chemical composition (wt.%) of the Mnt sample is: SiO2, 50.95; TiO2, 0.62; Al2O3, 19.60; Fe2O3, 5.62; MgO, 3.29; CaO, 1.97; Na2O, 0.98; and K2O, 0.86. Di-isobutyl phenoxy ethoxy ethyl or dimethyl benzyl ammonium chloride, benzethonium chloride and phemerol chloride, known as hyamine surfactant (C27H42ClNO2, molecular weight 448.08 g mol–1 and 99% purity), was procured from Merck (New Jersey, USA). Sodium dodecyl sulfate (NaC12H25SO4, molecular weight 283.38 g mol–1 and 85% purity) was also purchased from Merck. Supplementary Material Figure S1 shows the structure of the hyamine and SDS surfactants. Crystal violet (C25H30N3Cl) was also purchased from Merck. A total of 1.00 g of CV powder was dissolved in 1 L of deionized water to prepare a 1000 mg L–1 solution of dye.
Instrumentation
Chemical functional groups were identified by Fourier-transform infrared (FTIR) absorption spectroscopy using the KBr pellet technique (FTIR-Magna 550 Nicolet FTIR spectrometer). The mineralogy was investigated using powder X-ray diffraction (XRD) traces of the as-prepared samples, which were recorded with a Philips X'Pert Pro modular powder diffractometer using Cu-Kα radiation. The specific surface area was determined using a surface area analyser (BEL Sorb Gas Adsorption Analyzer). The morphology of the particles was investigated using field emission scanning electron microscopy (FE-SEM) with a MIRA3 TESCAN FE-SEM device. The absorbance spectra were obtained using a UV–Vis spectrophotometer at λ max = 588 nm (Shimadzu Model: T-80).
Preparation of the Mnt-hyamine and Mnt-hyamine-SDS nanocomposites
To obtain the purified Mnt, 20 g of nanoparticles was dispersed in 300 mL of deionized water. After stirring for 2 h at 1000 rpm, the suspension was centrifuged at 9000 rpm for 30 min and the precipitate was dried at 85°C for 10 h. To synthesize the Mnt-hyamine, 10 g of the purified Mnt was dispersed in 200 mL of deionized water and stirred for 10 h at 1000 rpm to achieve homogeneity. A desired amount of hyamine surfactant (20% of adsorbent weight) was added slowly and stirred for 2 h. The resulting solution was filtered and washed with deionized water. Finally, the sample was dried at 80°C for 12 h. To synthesize Mnt-hyamine-SDS, 10 g of the purified Mnt were dispersed in 300 mL of deionized water and stirred at 1000 rpm at 70°C for 1.5 h to achieve homogeneity. Then, 6 g of the hyamine surfactant was added slowly under continuous stirring at 2000 rpm at 70°C for 2 h. Subsequently, 2.4 g of SDS surfactant were added under stirring for 1.5 h. Finally, the mixture was filtered and washed thoroughly and dried at 100°C for 10 h.
Batch adsorption experiments
The equilibrium studies of CV adsorption on Mnt nanoparticles were carried out by adding 5 mg of Mnt to 50 mL of CV solution at various concentrations and placing the mixture in a shaker at 130 rpm for 24 h. The equilibrium experiment of CV adsorption on Mnt-hyamine was carried out by mixing 50 mg of modified Mnt with various CV concentrations (10–60 mg L–1). Finally, the equilibrium experiment of CV adsorption on Mnt-hyamine-SDS was carried out by mixing 57.5 mg of modified Mnt with varying concentrations of CV (10–90 mg L–1). The solutions were placed in a shaker at 130 rpm for 24 h.
To study the kinetics of CV adsorption on Mnt-hyamine nanocomposite, 0.05 g of modified Mnt was added to 50 mL of CV solutions with concentrations of 4, 6, 8 and 10 mg L–1. The kinetic study of CV adsorption on Mnt-hyamine-SDS nanocomposites was carried out by mixing 0.0575 g of modified Mnt with 50 mL of CV solutions with concentrations of 4, 6, 8 and 10 mg L–1 and placing the solutions in a shaker. A detailed description of the kinetic and equilibrium studies is given in Sarabadan et al. (Reference Sarabadan, Bashiri and Mousavi2019a).
Experimental design
The effects of four variables (pH, temperature, adsorbent dosage and initial dye concentration; cf. Table S1) on dye removal were investigated using central composite design (CCD). The Design-Expert software (version 8.0.7.1) was used in the experimental design. Thirty experimental runs for a four-factor CCD were performed. The dye-removal efficiencies obtained for the Mnt-hyamine and Mnt-hyamine-SDS nanocomposites were 90.45–99.95% and 91.00–99.90%, respectively. For Mnt nanoparticles, the dye-removal efficiencies obtained were 97.24–99.99% (Table S2).
Results and discussion
Characterization of the adsorbent
Figure 1 shows the FTIR spectra of Mnt nanoparticles, hyamine, SDS, Mnt-hyamine and Mnt-hyamine-SDS nanocomposites. In the FTIR spectra of Mnt nanoparticles, a broad band at ~3431 cm–1 is attributed to H2O adsorbed on the sample. A well-resolved band at 3622 cm−1 is assigned to stretching vibrations of structural hydroxyls (Gomez-Serrano et al., Reference Gomez-Serrano, Pastor-Villegas, Perez-Florindo, Duran-Valle and Valenzuela-Calahorro1996). These bands are also present in the FTIR spectra of Mnt-hyamine and Mnt-hyamine-SDS nanocomposites. In Mnt nanoparticles, the band at 1635 cm–1 is attributed to the O–H bending vibration of adsorbed water (Acisli et al., Reference Acisli, Khataee, Karaca and Sheydaei2016). This band shifts from 1635 cm–1 (Mnt nanoparticles) to 1611 cm–1 after modification with hyamine (Mnt-hyamine nanocomposite). The shift of the O–H bending band to a lower frequency in the Mnt-hyamine composite compared to its Mnt nanoparticle counterpart might indicate a weaker hydrogen bond between the Mnt nanoparticles and hyamine molecules. The Mnt-hyamine nanocomposite contains a strong band at 2954 cm–1 that is attributed to stretching vibrations of C–H groups, which is absent from the Mnt nanoparticles. In hyamine, this band occurs at 2953 cm–1 (Saka, Reference Saka2012). In addition, the sharp band at 1512 cm–1 in the Mnt-hyamine spectrum supports the intercalation of hyamine molecules. The bands in the region of 900–1100 cm–1 are attributed to the Si–O stretching vibrations (Chen et al., Reference Chen, Chen, Luan, Ji and Xia2011). Finally, the Mnt-hyamine-SDS nanocomposite contains intense bands at 2925, 2856 and 3450 cm–1 that are attributed to C–H stretching in hyamine and SDS molecules (Saka, Reference Saka2012).
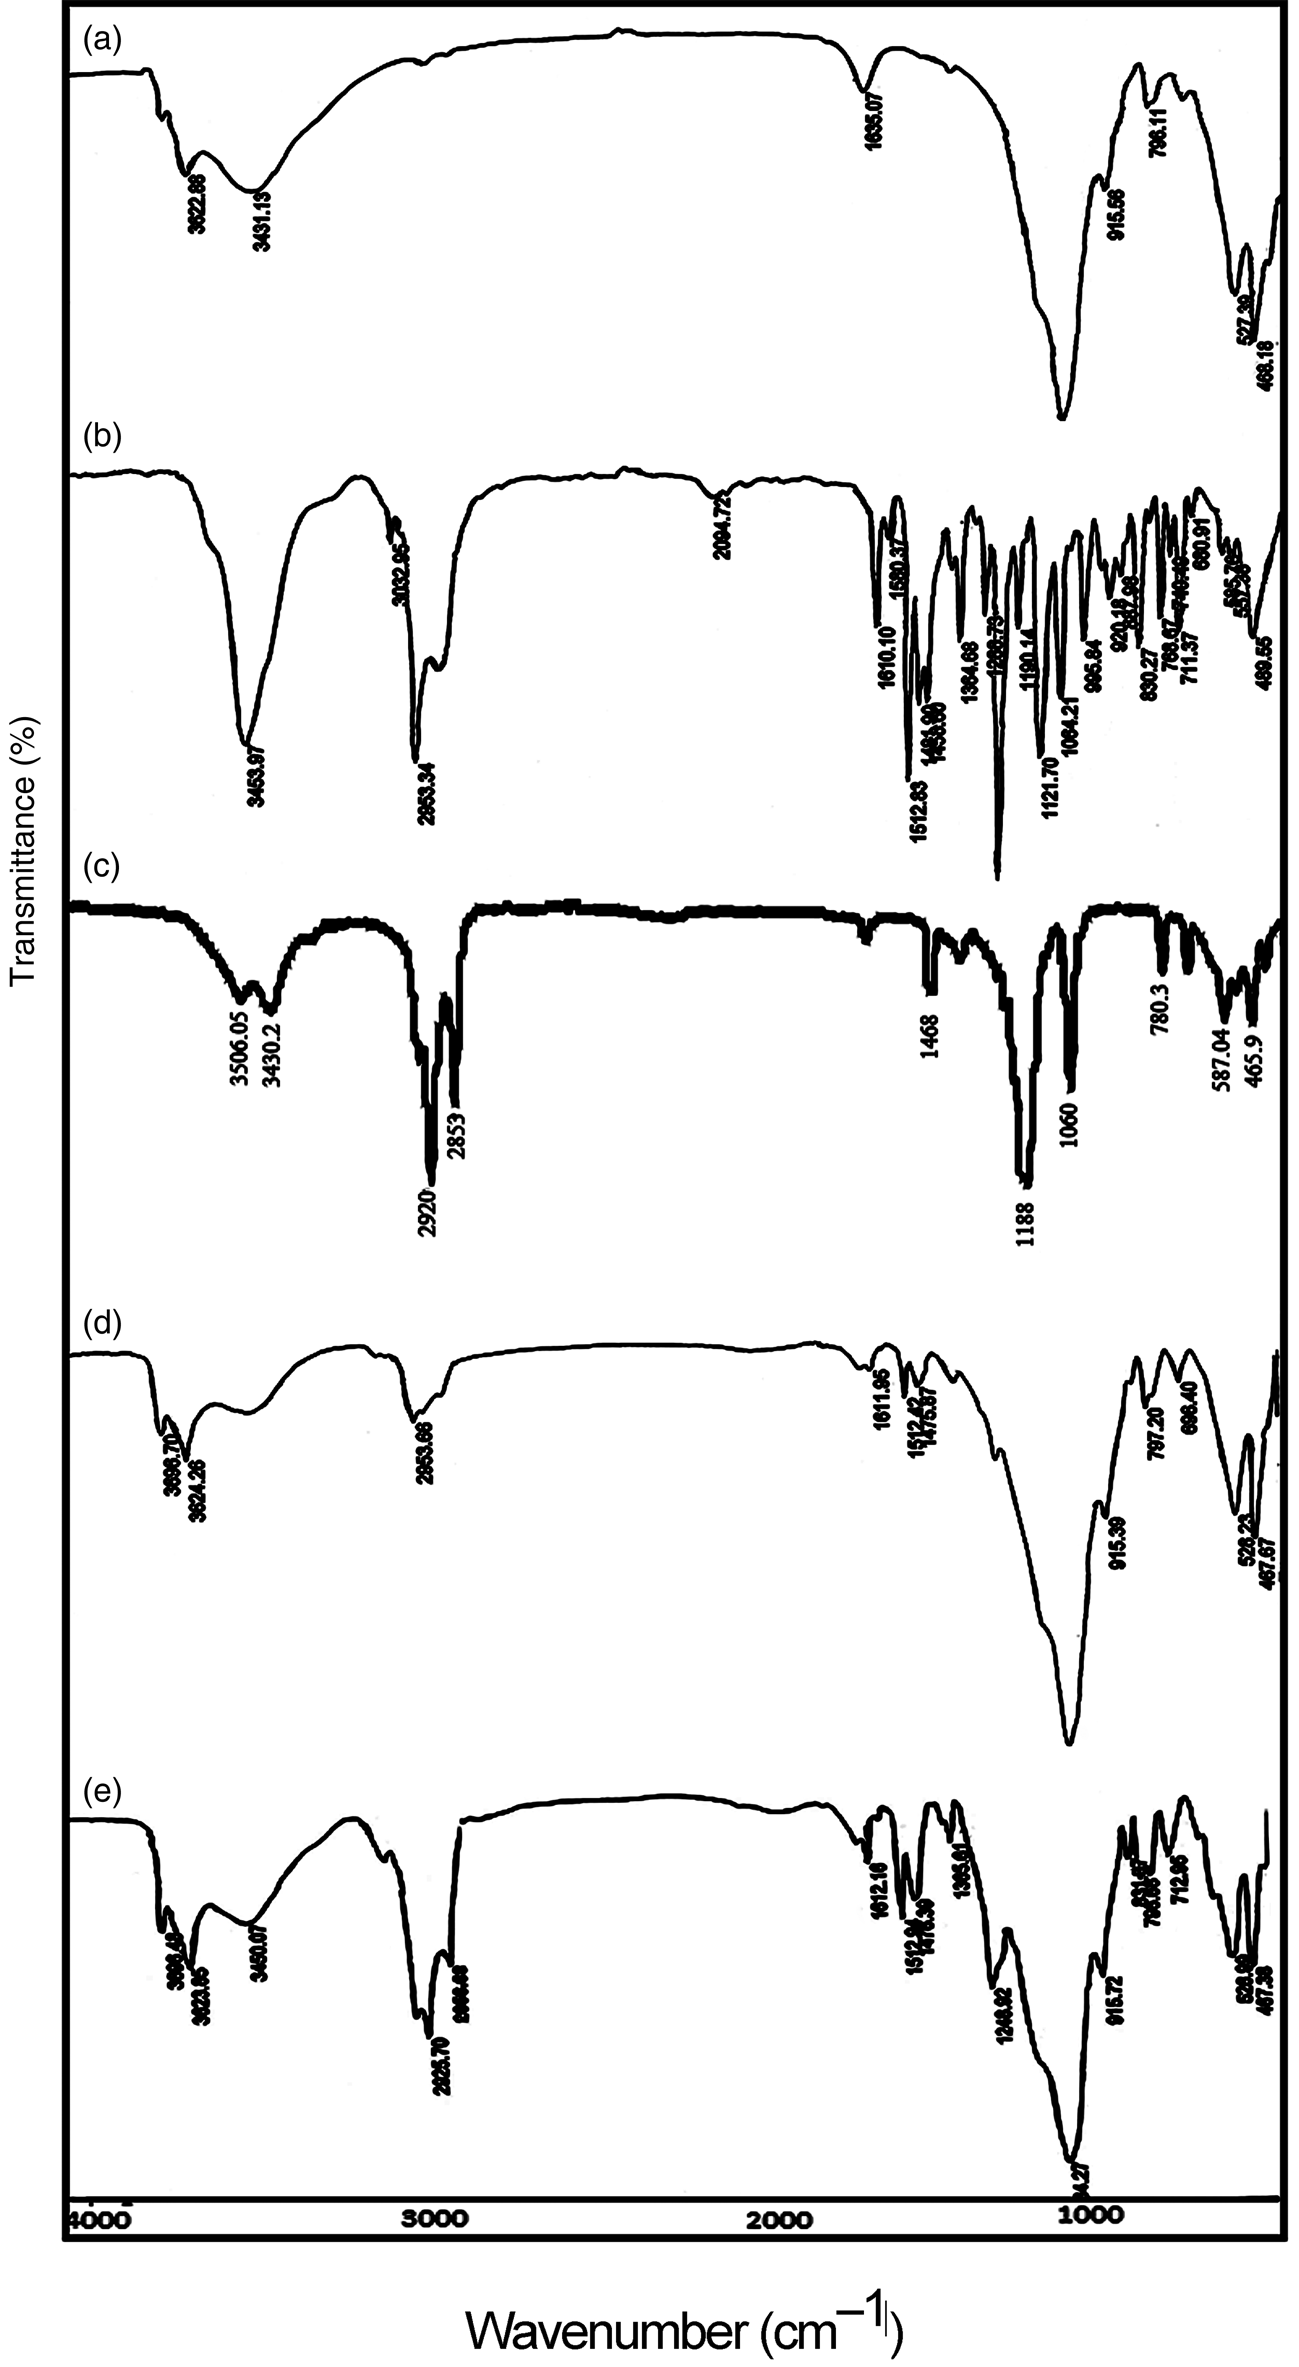
Fig. 1. FTIR spectra of (a) Mnt nanoparticles, (b) hyamine, (c) SDS, (d) Mnt-hyamine nanocomposites and (e) Mnt-hyamine-SDS nanocomposites.
The XRD traces of Mnt nanoparticles, Mnt-hyamine and Mnt-hyamine-SDS nanocomposites are shown in Fig. 2. The primary reflection of Mnt nanoparticles is observed in the XRD traces of the two modified Mnt nanocomposites. By adding hyamine and SDS surfactants, the intensity of the primary reflections of Mnt decreased in the XRD traces of the Mnt-hyamine and Mnt-hyamine-SDS nanocomposites. Except for the Mnt nanoparticles, the samples all contain quartz and feldspar.
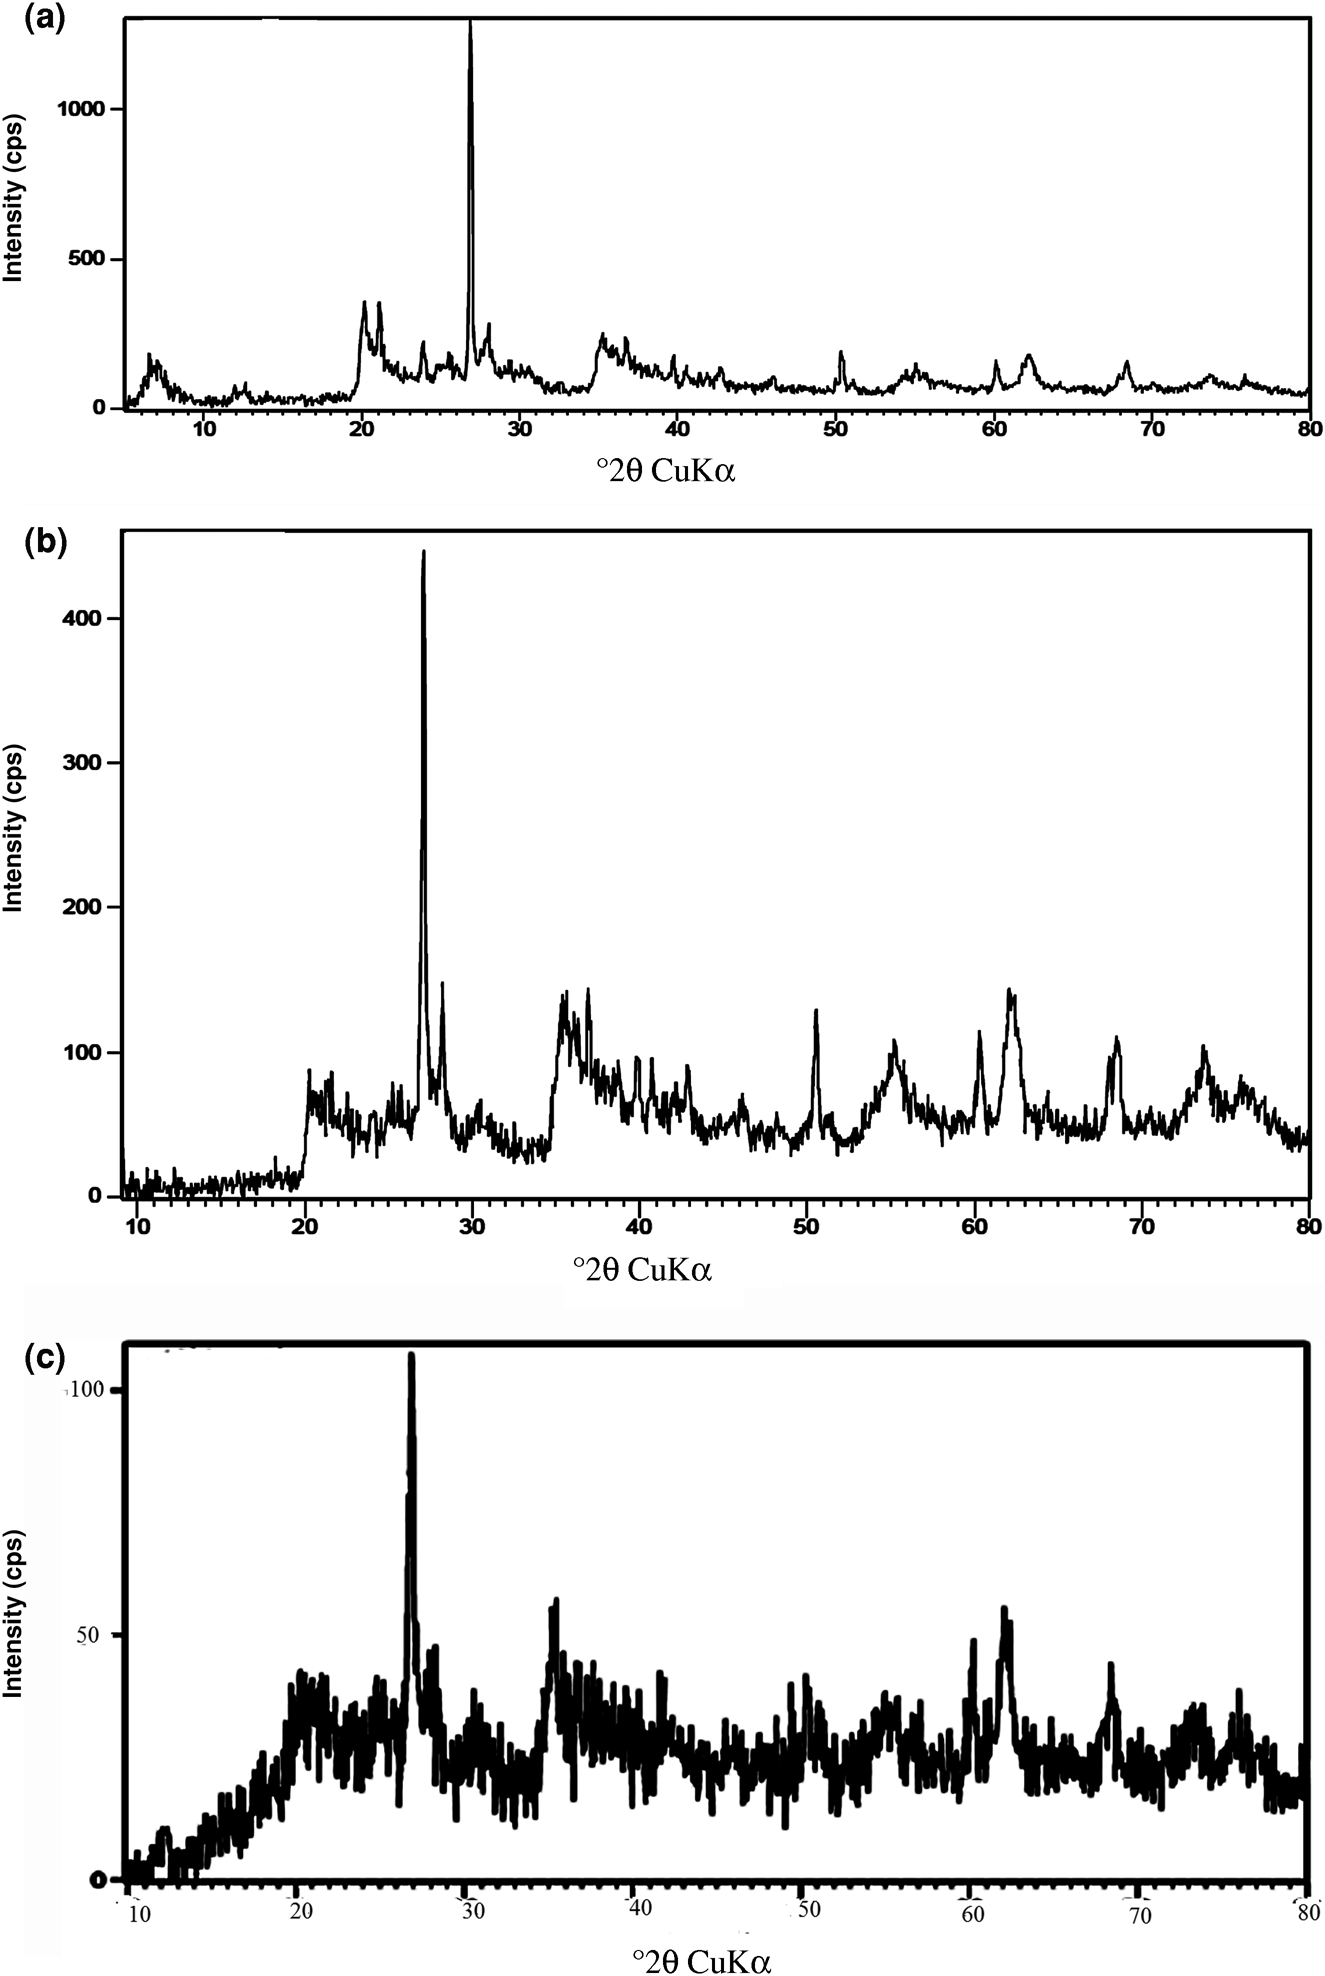
Fig. 2. XRD traces of (a) Mnt nanoparticles, (b) Mnt-hyamine nanocomposites and (c) Mnt-hyamine-SDS nanocomposites.
The results of the N2 adsorption–desorption analysis of the Mnt nanoparticles, Mnt-hyamine and Mnt-hyamine-SDS nanocomposites are shown in Table 1 and Fig. 2. To measure pore size through gas adsorption, N2 adsorption and desorption isotherms were recorded from low pressures to the saturation pressure. The specific surface areas (a s,BET) were calculated from the linear form of the Brunauer–Emmett–Teller (BET) equation, taking the cross-sectional area of the nitrogen molecule to be 16.2 × 10⁻²⁰ m2. The total pore volumes for the samples under study were determined from single-point adsorption at a relative pressure of 0.98 by converting the value of the adsorbed gas into the volume of the liquid adsorbate. The mean pore diameter was calculated by multiplying the total pore volume by 4 and then dividing this by a s,BET. With the addition of hyamine to Mnt nanoparticles, the separation from the solution was easy, but the pore volume and the specific surface area decreased and its mean pore diameter increased. The N2 adsorption–desorption isotherms of Mnt nanoparticles, Mnt-hyamine and Mnt-hyamine-SDS nanocomposites are indicative of mesoporous materials.
Table 1. The BET specific surface area and total pore volume of Mnt-hyamine and Mnt-hyamine-SDS nanocomposites and Mnt nanoparticles.

Figure 3 shows FE-SEM images of the Mnt nanoparticles, Mnt-hyamine and Mnt-hyamine-SDS nanocomposites. The Mnt particles have variable sizes and the hyamine molecules do not occupy the whole surface of the particles. The particle sizes in all of the samples are in the nanometre range. The energy-dispersive X-ray analysis (EDX) spectra of Mnt nanoparticles, Mnt-hyamine and Mnt-hyamine-SDS nanocomposites are shown in Fig. S3. Silicon is the main component the Mnt, while C predominates in the Mnt-hyamine and Mnt-hyamine-SDS nanocomposites. The Na content in Mnt nanoparticles is 0.8 wt.%, decreasing in Mnt-hyamine and Mnt-hyamine-SDS nanocomposites to 0.03 and 0.22 wt.%, respectively. This suggests surfactant intercalation in the Mnt nanoparticles proceeded via the replacement of the Na+ ions in the Mnt interlayer through a cation-exchange mechanism (Zhang et al., Reference Zhang, Zhang, Liao and Xia2013; Kıranşan et al., Reference Kıranşan, Soltani, Hassani, Karaca and Khataee2014).

Fig. 3. FE-SEM images of (a) Mnt nanoparticles, (b) Mnt-hyamine nanocomposites and (c) Mnt-hyamine-SDS nanocomposites. L1 and L2 refer to the thickness of the nanosheets.
Response surface modelling
Regression model equation
A quadratic model was generated for determining the correlation between the four variables, and the responses and the equations are shown below:


From these equations, it is suggested that the variables pH (A), temperature (B) and adsorbent dosage (C) have positive impacts on the response. At the same time, initial dye concentration (D) has a negative impact on the response, and adsorbent dosage (C) has the most significant impact on the response.
Analysis of variance
An analysis of variance (ANOVA) for CV adsorption was performed on the Mnt-hyamine and Mnt-hyamine-SDS nanocomposites. The large F-values for CV adsorption on Mnt-hyamine (16.60), Mnt-hyamine-SDS (14.43) and Mnt nanoparticles (13.86) and the very low p-values suggest that the model terms are significant. For the Mnt-hyamine nanocomposite A, B, C, D, BC, C 2 and B 2 are the significant model terms, for the Mnt-hyamine-SDS nanocomposite AC, D 2 and B 2 are the significant model terms and for the Mnt nanoparticles A, C, A 2, B 2, C 2 and D 2 are the significant model terms. The lack of fit for Mnt-hyamine (3.09), Mnt-hyamine-SDS (0.28) and Mnt nanoparticles (1.24) implies that there is no significant relationship with the pure error. Precision defined by the signal-to-noise ratios of 15.543, 14.430 and 11.711 for Mnt-hyamine, Mnt-hyamine-SDS and Mnt nanoparticles, respectively, indicates appropriate signals. The coefficients of variation for Mnt-hyamine (0.88%), Mnt-hyamine-SDS (1.02%) and Mnt nanoparticles (0.30%) suggest that the experiments are accurate. The predicted R 2 values for CV adsorption on Mnt-hyamine (0.69), Mnt-hyamine-SDS (0.67) and Mnt nanoparticles (0.68) were in reasonable agreement with their adjusted R 2 values (0.88, 0.87 and 0.86, respectively). The R 2 values for Mnt-hyamine, Mnt-hyamine-SDS and Mnt nanoparticles were 0.94, 0.93 and 0.93, respectively.
The Pareto analysis indicates the percentage impact of each variable on the dye-removal efficiency. The results of the Pareto analysis for CV adsorption on Mnt nanoparticles, Mnt-hyamine and Mnt-hyamine-SDS nanocomposites show that the adsorbent dosage is the most significant variable impacting the dye removal (Fig. 4). The actual values obtained from a specific run and the predicted values calculated using the Mnt-hyamine, Mnt-hyamine-SDS and Mnt nanoparticle models were well distributed along a straight line (Fig. S4), indicating agreement between the predicted and the observed values.

Fig. 4. Pareto graphic analysis of CV adsorption on (a) Mnt nanoparticles, (b) Mnt-hyamine nanocomposites and (c) Mnt-hyamine-SDS nanocomposites.
The effects of time and pH on CV removal by the adsorbents are shown in Fig. S5. With increasing pH, the dye removal increases. The experimental results and response surface modelling showed that pH is an essential parameter for adsorption, and at high pH values (9–11) maximum dye removal was observed.
Response surface plots
The perturbation plots for CV adsorption on the adsorbents show that the adsorbent dosage is the most significant variable impacting dye removal (Fig. S6). Figure 5 shows the response surface plots for dye adsorption on the adsorbents. Dye adsorption increases with increasing pH and temperature (Fig. 5a,d,g). With increasing pH, the number of negative sites of adsorbent increases, thereby favouring adsorption of the cationic dye by the adsorbent. Dye removal increases with adsorbent dosage because of the greater number of active sites (Fig. 5b,e,h). The removal of dye increases with decreasing initial dye concentration (Fig. 5c,f,i). The combined effect of adsorbent dosage and temperature reveals that these variables have the positive effects on dye removal (Fig. S7). The interactive effect of temperature and initial dye concentration on dye removal shows the negative correlation between initial dye concentration and the dye-removal percentage. In addition, the interactive effect of adsorbent dosage and initial dye concentration on dye removal shows the same result (Fig. S7). This is because when dye concentration increases at a constant adsorbent dosage, the adsorbent sites gradually decrease, so the dye-removal efficiency decreases. An elliptical or saddle-shaped nature of the contour plot demonstrates that the interaction between the variables is significant, whereas a circular contour plot indicates that the interaction between the variables is not significant. For CV adsorption on Mnt nanoparticles, the variable interaction between pH and initial dye concentration is not significant, whereas the variable interaction between pH and adsorbent dosage is significant. For CV adsorption on Mnt-hyamine and Mnt-hyamine-SDS nanocomposites, the contour plots are elliptical or saddle-shaped and thus the interactions between various variables are significant.

Fig. 5. Response surface and counter plots for Mnt nanoparticles (a, b, c), Mnt-hyamine nanocomposites (d, e, f) and Mnt-hyamine-SDS nanocomposites (g, h, i). R% = dye removal efficiency.
Optimization of adsorption conditions
The optimization process was performed to obtain the optimum values of the variables that maximize dye removal efficiency. For CV adsorption on Mnt nanoparticles, maximum (100%) removal of dye was observed at pH 9.40, adsorbent dosage 1.06 g L–1, temperature 27.28°C and initial dye concentration 99.44 mg L–1. For CV adsorption on Mnt-hyamine nanocomposites, a comparable maximum removal of dye (100%) was observed at pH 9.00, adsorbent dosage 1.00 g L–1, temperature 25.00°C and initial dye concentration 30.00 mg L–1. Finally, for CV adsorption on Mnt-hyamine-SDS nanocomposites, the same maximum removal of dye was observed at pH 10.41, adsorbent dosage 1.15 g L–1, temperature 29.97°C and initial dye concentration 98.74 mg L–1. The desirability lies between 0 and 1, and it represents the closeness of a response to its ideal value. If a response falls within unacceptable intervals, the desirability is 0, and if a response falls within ideal intervals or the response reaches its ideal value, the desirability is 1. The desirability value for Mnt-hyamine and Mnt-hyamine-SDS nanocomposites and Mnt nanoparticles was 1.00 at optimum conditions, indicating that the response was excellent.
Adsorption isotherms
The equilibrium experiments focusing on CV adsorption on adsorbents were carried out at optimum values of pH and temperature. Figure 6 shows the isotherms of CV adsorption on the adsorbents. The Langmuir (Langmuir, Reference Langmuir1916), Freundlich (Freundlich, Reference Freundlich1907), Temkin (Temkin & Pyzhev, Reference Temkin and Pyzhev1940), Redlich–Peterson (Redlich & Peterson, Reference Redlich and Peterson1959), Sips (Sips, Reference Sips1948) and Flory–Huggins (Bashiri & Eris, Reference Bashiri and Eris2016) isotherms were used to fit the results. The isotherm equations used are as follows:


All isotherm equations were fitted with experimental data, and the results of the fittings and the values of their corresponding coefficients of determination (R 2) are listed in Table 2. Based on the R 2 values obtained, the goodness of fit of experimental data to the isotherm models for CV adsorption follow the order Flory–Huggins > Temkin for Mnt-hyamine, Langmuir > Flory–Huggins for Mnt-hyamine-SDS and Temkin > Langmuir for Mnt nanoparticles. The adsorption of CV on Mnt-hyamine surfaces yields various adsorbate geometries and one molecule might have multisite occupancy on a homogeneous surface (Bashiri & Eris, Reference Bashiri and Eris2016). For Mnt-hyamine-SDS nanocomposites, the Langmuir isotherm was selected due to its best fit. Therefore, the adsorbate forms a monolayer on the adsorbent surface and displays a uniform distribution of adsorption heat and affinity over the homogeneous surface. In addition, the adsorption occurs at a finite number of definite sites (Foo & Hameed, Reference Foo and Hameed2010). For Mnt nanoparticles, the Temkin model states that the heat of adsorption of all molecules in the layer would decrease linearly rather than logarithmically with coverage due to adsorbate–adsorbent interactions (Bashiri & Eris, Reference Bashiri and Eris2016). The maximum adsorption capacities for CV of Mnt nanoparticles, Mnt-hyamine and Mnt-hyamine-SDS nanocomposites were 616.07, 299.99 and 690.69 mg g–1 according to the Langmuir, Flory–Huggins and Langmuir isotherms, respectively, at 25°C. Therefore, these materials are excellent adsorbents for CV removal. However, although the Mnt nanoparticles have a very large adsorption capacity, separation from solution requires high-speed centrifugation exceeding 12,000 rpm. The synthesized modified Mnt nanocomposites can be separated easily from solution by means of filtration, and so their separation from aqueous solution is easier than that of the Mnt nanoparticles.

Fig. 6. Adsorption isotherms of CV dye on (a) Mnt nanoparticles at pH 9.40, temperature 27.28°C, adsorbent dose 0.1 g L–1, initial dye concentration 5–45 mg L–1 and (b) Mnt-hyamine and Mnt-hyamine-SDS nanocomposites at optimum conditions.
Table 2. Isotherm parameters of CV adsorption on Mnt-hyamine and Mnt-hyamine-SDS nanocomposites and Mnt nanoparticles.

Adsorption kinetics
Kinetic studies of CV adsorption onto the Mnt-hyamine and Mnt-hyamine-SDS nanocomposites were carried out at initial concentrations of 4, 6, 8 and 10 mg L–1, adsorption times of 2–280 min and at the optimum values of pH, adsorbent dosages and temperatures. The results obtained are shown in Fig. 7. Pseudo-first order (Lagergren, Reference Lagergren1898), pseudo-second order (Ho & McKay, Reference Ho and McKay1999), Elovich (Zeldowitsch, Reference Zeldowitsch1934), modified pseudo-first order (MPFO) (Yang & Al-Duri, Reference Yang and Al-Duri2005; Azizian & Bashiri, Reference Azizian and Bashiri2008), intraparticle diffusion (Wu et al., Reference Wu, Tseng and Juang2009), integrated kinetic Langmuir (IKL) (Marczewski, Reference Marczewski2010) and fractal-like integrated kinetic Langmuir (FL-IKL) (Haerifar & Azizian, Reference Haerifar and Azizian2012) models were used to study the adsorption kinetics. The kinetic data were fitted using non-linear regression (Simonin, Reference Simonin2016).


where k 1, k 2, k m, k i, k L and k FL are the rate constants of the pseudo-first order, pseudo-second order, MPFO, intraparticle diffusion, IKL and FL-IKL models, respectively. In the Elovich equation, α is the adsorption rate an initial time and β is a constant. In the IKL and FL-IKL equations, a, n and f are constants.

Fig. 7. Adsorption kinetics of CV dye on (a) Mnt-hyamine nanocomposites (pH 9.00, temperature 25.00°C, adsorbent dose 1.00 g L–1, initial dye concentration 4, 6, 8 or 10 mg L–1) and (b) Mnt-hyamine-SDS nanocomposites (pH 10.41, temperature 29.97°C, adsorbent dose 1.15 g L–1, initial dye concentration 4, 6, 8 or 10 mg L–1).
The kinetic parameters and correlation coefficients obtained by fitting the kinetic data of CV adsorption on Mnt-hyamine and Mnt-hyamine-SDS nanocomposites are given in Tables S3 & S4. The FL-IKL model best fits the experimental kinetic data.
Thermodynamic studies
The thermodynamic parameters for CV adsorption on Mnt-hyamine and Mnt-hyamine-SDS nanocomposites were calculated from the plot of lnK C vs 1/T (Sarabadan et al., Reference Sarabadan, Bashiri and Mousavi2019a) and are presented Fig. S8. The results of thermodynamic parameters are summarized in Table S5. The positive ΔH° value of CV adsorption onto Mnt-hyamine and Mnt-hyamine-SDS nanocomposites indicates that adsorption is endothermic. This is supported by the increase of the amount of adsorbed CV with increasing temperature. The low values of ΔH° show the physical nature of CV adsorption onto the adsorbents. In addition, the positive ΔS° value of the adsorption indicates the increasing degrees of freedom with adsorption, suggesting an increase of randomness in the solution during the adsorption process. The entropy shows the changes in dye hydration that occur during adsorption. Finally, ΔG° is negative for adsorption onto the Mnt-hyamine and Mnt-hyamine-SDS nanocomposites, which reflects the spontaneity of the process.
Comparison with other adsorbents
Table 3 presents the comparison between the maximum values of the CV adsorption capacities of Mnt nanoparticles, Mnt-hyamine and Mnt-hyamine-SDS nanocomposites and some adsorbents (Senthilkumaar et al., Reference Senthilkumaar, Kalaamani and Subburaam2006; Bertolini et al., Reference Bertolini, Izidoro, Magdalena and Fungaro2013; Satapathy & Das, Reference Satapathy and Das2014; Amodu et al., Reference Amodu, Ojumu, Ntwampe and Ayanda2015; Alipanahpour Dila et al., Reference Alipanahpour Dila, Ghaedi, Ghaedi, Asfaram, Jamshidi and Purkait2016; Ishaq et al., Reference Ishaq, Javed, Amad, Ullah, Hadi and Sultan2016; Sarabadan et al., Reference Sarabadan, Bashiri and Mousavi2019a, Reference Sarabadan, Bashiri and Mousavi2019b). The maximum adsorption capacity of the Mnt-hyamine-SDS nanocomposite (690.69 mg g–1) is greater than that of the Mnt nanoparticles (616.07 mg g–1) and the Mnt-hyamine nanocomposite (299.99 mg g–1). In addition, the maximum adsorption capacity of Mnt-hyamine-SDS nanocomposites is greater than that of other reported adsorbents in Table 3. Hence, the adsorption capacity for CV is reduced when the interlayer Na+ of Mnt nanoparticles was replaced by hyamine. Although the Mnt nanoparticles have a large adsorption capacity, separating them from solution is difficult without high-speed centrifugation. In contrast, the Mnt-hyamine and Mnt-hyamine-SDS nanocomposites can be separated easily from solution. In our previous study, zeolite was used as a support for Mnt nanoparticles (Sarabadan et al., Reference Sarabadan, Bashiri and Mousavi2019a). Zeolite–Mnt adsorbents were also separated easily from solution. The zeolite–Mnt adsorbents have a lower adsorption capacity (150.5 mg g–1), and less expensive than Mnt-hyamine and Mnt-hyamine-SDS nanocomposites.
Table 3. Comparison of the maximum adsorption capacities of CV with those of various other adsorbents.

The Mnt-hyamine composite has a larger Brunauer–Emmett–Teller (BET) specific surface area than that of the Mnt-hyamine-SDS nanocomposite. The Mnt-hyamine-SDS nanocomposite also has a large adsorption capacity for CV dye. CV is a cationic dye and as such it can be attached to the surface through linkages with anionic acid groups on the SDS. The presence of a sulfate group in the SDS structure increases the adsorption affinity due to the increased electrostatic attraction between the negatively charged surface and the cationic dye.
The mechanism of dye removal
The mechanisms for the removal of CV include mainly surface adsorption, ion exchange and surface precipitation. ‘Surface adsorption’ refers to the concentration of contaminants on or near the surface or pores of an adsorbent, which includes physical adsorption (driven by London–van der Waals forces) and chemisorption (involving the formation of chemical bonds). Adsorption of CV onto activated carbon and zeolites is a typical physical adsorption process, while adsorption of CV onto metal oxides always involves chemisorption. Ion exchange is another type of physical adsorption process (Zhu et al., Reference Zhu, Chen, Zhou, Xi, Zhu and He2016). Electrostatic interaction is the dominant interaction force between the adsorbed ions and the adsorbent, and adsorption of CV cations by Mnt is primarily an ion exchange-controlled process. An analogous adsorption process to ion exchange is ligand exchange, in which the contaminants exchange the ligands on the adsorbents during adsorption. However, a ligand may be an ion or a molecule binding to a metal ion on the adsorbent, and this adsorption process always involves highly specific chemisorption.
The cation-exchange process is proposed as the primary mechanism for the uptake of cationic dyes on Mnt, although other mechanisms have been proposed as well. For example, the terminal -OH groups and the acidic sites (of both Brönsted and Lewis type) of Mnt have specific interactions with dye cations; at relatively high solution concentrations, pH dye cations may form surface precipitates.
Conclusions
The adsorption of CV dye onto Mnt-hyamine and Mnt-hyamine-SDS nanocomposites and Mnt nanoparticles was investigated and the following conclusions were drawn:
(1) The optimum conditions for CV adsorption on Mnt-hyamine and Mnt-hyamine-SDS nanocomposites and Mnt nanoparticles are: temperature 25.0, 30.0 and 27.3°C, respectively; pH 9.00, 10.41 and 9.40, respectively; adsorbent dosages 1.00, 1.15 and 1.06 g L–1, respectively; and initial dye concentrations 30.00, 98.74 and 99.44 mg L–1, respectively.
(2) Compared to the others, the adsorbent dosage is the most effective variable.
(3) pH is an essential parameter for CV removal by the adsorbents studied.
(4) The equilibrium adsorption data for CV adsorption offer a good fit for the Flory–Huggins, Langmuir and Temkin models on Mnt-hyamine and Mnt-hyamine-SDS nanocomposites and Mnt nanoparticles, respectively.
(5) The FL-IKL model is the most appropriate model to describe the kinetics of CV adsorption on the adsorbents studied.
(6) The thermodynamic parameters for the two modified Mnt nanocomposites showed that the adsorption is endothermic and spontaneous. The low values of ΔH° demonstrate the physical nature of CV adsorption on these adsorbents.
(7) Mnt-hyamine and Mnt-hyamine-SDS nanocomposites and Mnt nanoparticles showed large adsorption capacities (299.99, 690.69 and 616.07 mg g–1, respectively) for CV removal from solution.
(8) Mnt-hyamine can be separated easily from solution without high-speed centrifugation.
(9) Using both the anionic and cationic surfactants SDS and hyamine for modification of Mnt nanoparticles yields a highly effective adsorbent that can be separated easily from solution and has a greater adsorption capacity than unaltered Mnt nanoparticles.
Financial support
The authors are grateful to the University of Kashan for supporting this work (grant no. 985862/3).
Supplementary material
To view supplementary material for this article, please visit https://doi.org/10.1180/clm.2021.9


