


In 2015, Brazil was the world's seventh leading producer of kaolin, at 1.8 Mt (Campos et al., Reference Campos, Monteiro, Costa and Silva2016). Approximately 90% of the nation's production comes from the secondary deposits in the Brazilian Amazon region, from the Rio Jari and Rio Capim deposits (Montes et al., Reference Montes, Melfi, Carvalho, Vieira Coelho and Formoso2002; Wilson et al., Reference Wilson, Santos and Santos2006; Sousa et al., Reference Sousa, Varajão, Yvon and Da Costa2007). Moreover, important primary deposits are also hosted in pegmatites, such as in Borborema Pegmatite Province (BPP), which produces ~120 ktpa of kaolin (Leite et al., Reference Leite, Araújo and Tavares2014).
The kaolin occurrences in pegmatites might originate from weathering (kaolinization) of microcline by meteoric waters or from hydrothermal activity when brines percolate through fractures and weak parts of the rock. The BPP kaolin deposits might have formed from weathering (Gopinath & Souza, Reference Gopinath and Muniz e Silva1990) or from hydrothermal origin during a prior hypogene event (Wilson et al., Reference Wilson, Santos and Santos2006). Other kaolin deposits hosted in pegmatites also occur in Oriental Pegmatitic Province (Brazil), and these are markedly different from the BPP deposits because of their abundant halloysite content (Wilson et al., Reference Wilson, Santos and Santos2006), the Bombowha deposits (Ethiopia), which are important for the ceramics industry (Fentaw & Mengistu, Reference Fentaw and Mengistu1998), the Hagendorf-Pleystein Pegmatite Province (Germany), mainly in the Kreuzberg Quartz Pegmatite deposit at Pleystein (Dill et al., Reference Dill, Dohrmann, Kaufhold and Balaban2015), the Swat deposits (Pakistan) (Saddiqui & Ahmed, Reference Saddiqui and Ahmed2005) and the Spruce Pine deposit in the USA, with estimated resources of 7 Mt (Parker III, Reference Parker1946), among others.
The industrial treatment of kaolin generally involves wet granulometric classification by sieves or cyclones for separation of the material that is <44 μm (industrial fraction). This is followed by high-field magnetic separation and chemical bleaching to remove iron hydroxides and improve the technological properties of the ore, mainly the optical properties (Table 1) (Prasad et al., Reference Prasad, Reid and Murray1991; Leite et al., Reference Leite, Veras, Santos, Lima, Paulo and Pinheiro2007). However, because of the mineralogical and technological differences between distinct kaolin deposits, some beneficiation techniques may not be necessary, resulting in lower processing costs (Campos et al., Reference Campos, Bertolino and Alves2017).
Table 1. Mineralogical, chemical and physical characteristics of kaolin for use in papermaking as a filler and coating and in ceramics industries (modified from Prasad et al., Reference Prasad, Reid and Murray1991).

The BPP kaolin deposits are primary kaolinitic with quartz, muscovite and microcline impurities (Madeiros Lima et al., Reference Madeiros Lima, Wanderley, Vieira, Medina, Barbosa, Vasconcelos, Amaral, Sato, Silva, Leite, Moraes, Ribeiro, Nesi, Angelim and Calheiros1980; Silva et al., Reference Silva, Da Luz, Sampaio, Bertolino, Scorzelli, Duttine and Da Silva2009). However, additional mineralogical and technological information about the BPP kaolin deposits is still needed in order to improve exploitation of the mineral. In this context, this study presents the mineralogical and chemical characterization of two kaolin deposits from BPP and their beneficiation, with an emphasis on the improvement of the technological properties.
Geological context
The BPP is located in the Seridó Belt, which is in the Borborema Province, Transversal Domain (Scorza, Reference Scorza1944; Almeida et al., Reference Almeida, Hasui, Brito Neves and Fuck1981; Brito Neves, Reference Brito Neves1983). It has dimensions of 150 km × 75 km and is composed of 750 pegmatite bodies, mineralized in kaolin or other ores (Fig. 1) (Beurlen et al., Reference Beurlen, Barreto, Martin, Melgarejo Draper, Da Silva and Souza Neto2009).
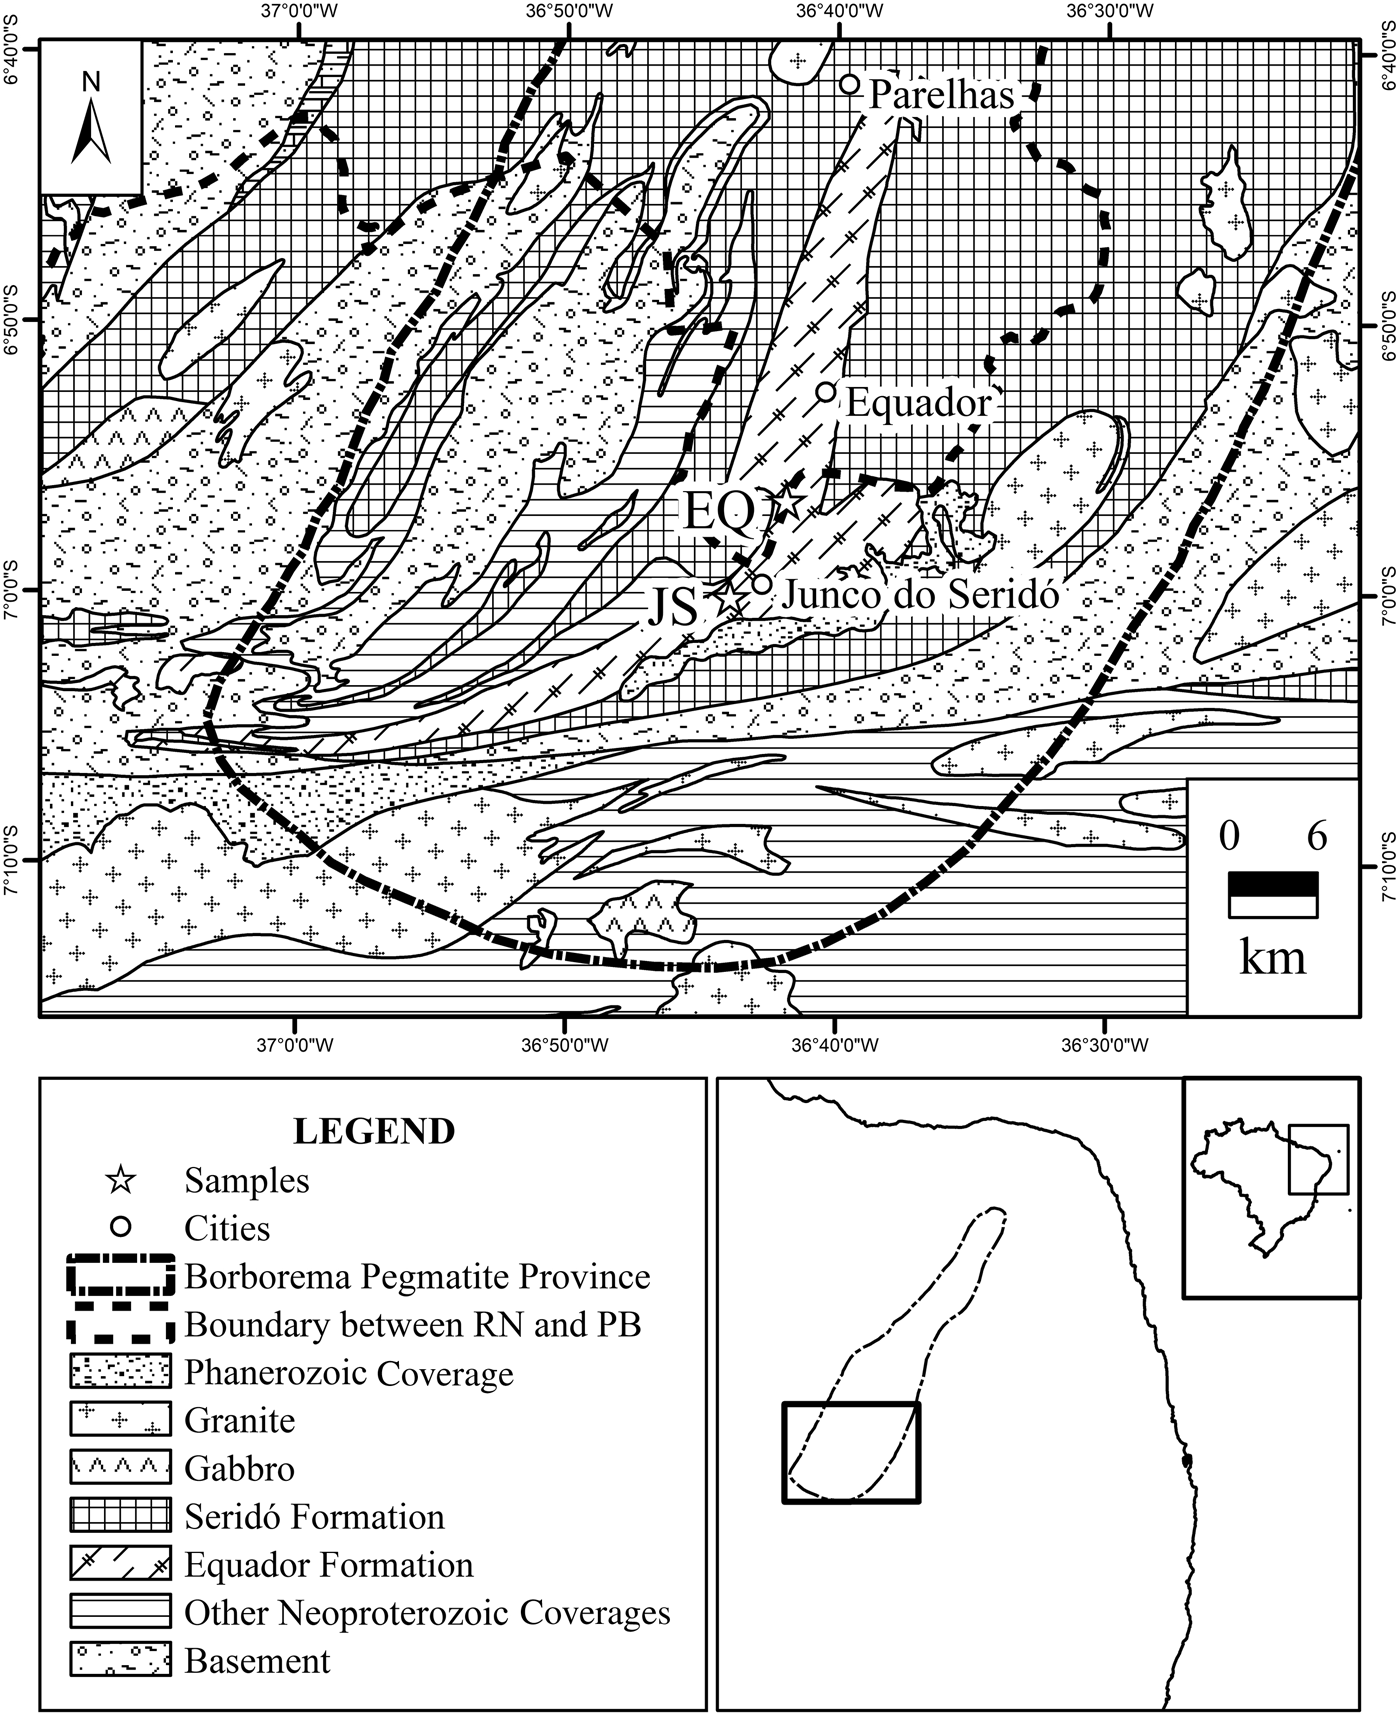
Fig. 1. Geological map of the Borborema Pegmatite Province with sampling locations (adapted from Angelim et al., Reference Angelim, Vasconcelos, Gomes, Wanderley, Fordiarini and Medeiros2004; Beurlen et al., Reference Beurlen, Da Silva, Thomas, Soares and Olivier2008; Legrand et al., Reference Legrand, Martins Sá, Neves Maia and De Souza2009). EQ samples (6°94′29″S; 36°69′80″W) and JS-1 samples (7°00′25″S; 36°73′26″W). PB = Paraíba; RN = Rio Grande do Norte.
The BPP is hosted by gneisses of the Jucurutu Formation, quartzite of the Equador Formation and schists of the Seridó Formation (Jardim de Sá & Salim, Reference Jardim de Sá and Salim1980; Archanjo & Salim, Reference Archanjo and Salim1986; Dardenne & Schobbenhaus, Reference Dardenne and Schobbenhaus2001). Approximately 80% of the occurrences and kaolin mines are associated within the Equador Formation in the southern BPP, with 17% in the Seridó Formation and the other 3% distributed in other lithostratigraphic units (Legrand et al., Reference Legrand, Martins Sá, Neves Maia and De Souza2009).
The kaolin bodies have dimensions of ~300 m × 20 m, and mine pits indicate kaolinization depths of at least 20 m. A rocky overburden with an average thickness of 2 m occurs above the kaolin, and the contact between country rocks and pegmatites is abrupt. The alteration of microcline into kaolinite is not complete, and the presence of unaltered microcline crystals is common (Gopinath & Souza, Reference Gopinath and Muniz e Silva1990).
The pegmatites are classified as homogeneous, heterogeneous and mixed, with the heterogeneous ones being the most widespread of the pegmatites mineralized in kaolin. They show lenticular, rounded and disc geometry and their dimensions are generally ~700 m × 200 m (Johnston, Reference Johnston1945; Silva & Dantas, Reference Silva and Dantas1997).
The pegmatites are mineralogically zoned into four parts (Fig. 2). From the outer to inner part, zone I is composed of a 1 cm-thick muscovite, followed by zone II, which represents the largest part of the pegmatite and is composed of quartz, muscovite and microcline. Zone III consists mainly of crystals of microcline with metric dimensions and perthitic texture. Finally, zone IV is composed of a quartz nucleus. The kaolin-mineralized zones are zones II and III, and because of the greater presence of microcline, the greatest yields are encountered in the latter zone (Johnston, Reference Johnston1945; Rolff, Reference Rolff1945; Roy et al., Reference Roy, Dottin and Madon1964).

Fig. 2. Zoning pattern of a pegmatite hosting a kaolin deposit (adapted from Silva & Dantas, Reference Silva and Dantas1997). Felds = feldspar; Kln = kaolinite; Mc = microcline; Qtz = quartz.
Materials and methods
The study was performed with seven kaolin samples weighing ~20 kg each, of which six samples were from a pegmatite deposit near to the municipality of Equador Rio Grande do Norte state (samples EQ-1, EQ-2, EQ-3, EQ-4A, EQ-4B and EQ-5) and the last sample was from a pegmatite deposit near the municipality of Junco do Seridó (sample JS-1), Paraíba state (Fig. 1). Samples EQ-4A and EQ-4B were collected in a trench profile, in which the first sample was located above the second. Samples EQ-1, EQ-2 and JS-1 were collected from stockpiles extracted from a depth of 10 m, while samples EQ-3, EQ-4A and EQ-4B were collected from a trench that was 1.5 m deep. Finally, sample EQ-5 was donated and came from a region called Alto do Gis. Samples EQ-1, EQ-2, EQ-3, EQ-4A and EQ-4B were collected from zone II of the pegmatite deposit, while sample JS-1 was collected from zone III.
During beneficiation, the samples were subjected to wet granulometric classification in a 44 μm vibratory sieve before treatment via two different beneficiation routes. In the first route, the samples were submitted to wet magnetic separation at 14,000 Gauss and chemical bleaching. In the second route, the samples were subjected only to chemical bleaching. For clay-size fraction (<2 μm) studies, the samples were subjected to wet granulometric classification in a 20 μm vibratory sieve followed by ultrasound and classification by sedimentation according to Stokes’ law.
The chemical bleaching was performed at pH 3–4 in 1 M sulfuric acid with 20% solid slurry by electric agitation (180–220 rpm). Sodium dithionite (Na2S2O4) (Isofar/P.A.) was used as a reduction agent at a concentration of 4 kg t–1 and sodium hexametaphosphate (NaPO3) (Vetec/P.A.) was used as a dispersant at a concentration of 3 kg t–1. Processing was conducted for 120 min with aliquot removals every 30 min to obtain four fractions from each sample (Silva et al., Reference Silva, Da Luz, Sampaio, Bertolino, Scorzelli, Duttine and Da Silva2009).
The X-ray diffraction (XRD) analyses were carried out in a Bruker D4 Endeavor apparatus with Co-Kα radiation (λ = 0.179021 nm) operating at 40 kV and 40 mA with a scan step of 0.02°2θ and a scan rate of 0.5 s in the range 4–80°2θ. The XRD patterns from the EQ-5 fractions were obtained in a Bruker D8 Endeavor apparatus with Cu-Kα radiation operating at 40 kV and 40 mA. The clay-size fractions were oriented, treated with ethylene-glycol, dried at standard pressure and temperature conditions and heated at 350°C and 550°C for 2 h (Moore & Reynolds, Reference Moore and Reynolds1989).
The chemical compositions of the samples were determined with a PANalytical Axios mAX X-ray fluorescence (XRF) spectrometer. The samples were prepared in a press with 20 mm diameter using 20 t of pressure for 30 s, utilizing boric acid (H3BO3) (Merck/P.A.) as binder in proportions of 1.0:0.6 (sample:binder).
The kaolinite structural formulae were determined from XRF chemical analyses of the clay-size fractions. The structural formulae were determined on the basis of O10(OH)8, in which the tetrahedral sites were filled with Si4+ and Al3+ to make a total of four. The remaining Al3+ was allocated in octahedral sites, which were filled by Fe3+ and Mg2+. The octahedral site occupancy was normalized to four atoms (Moore & Reynolds, Reference Moore and Reynolds1989).
The scanning electron microscopy (SEM) study of the bulk samples and the <44 μm fractions was performed with a Hitachi TM3030Plus and FEI Quanta 400 SEM, both operating under high vacuum and with an acceleration voltage of 20 kV. The samples were sputter coated with gold. The kaolin images were described based on Keller (Reference Keller1978).
The particle-size analyses were performed with a Malvern Mastersizer 2000 on slurries prepared with 0.5 g of kaolin dispersed in 30 mL of distilled water. The fractions were disaggregated with sodium dithionite as a dispersant agent in proportions of 3 kg t–1 and by ultrasonic vibration for 10 min in conditions of 5 min of pulse and 60 μm of amplitude.
The optical properties, including the brightness index (ISO) and colour parameters (redness, yellowness and lightness), were identified with a Technidyne Color Touch 2 instrument.
The electron paramagnetic resonance (EPR) spectra were obtained with a Bruker ESP300E EPR spectrometer at a frequency of 9.75 GHz (X-band) at the Brazilian Center for Physics Research (CBPF). The semi-quantitative analyses were carried out by determining the percentage of the absolute area of the signal between 200 and 400 mT in relation to the area between 100 and 500 mT of the respective spectrum. Meads & Malden (Reference Meads and Malden1975) applied the concept of calculating the percentage of the absolute area to the signal at 155 mT regarding the whole EPR spectrum, and Campos et al. (Reference Campos, Bertolino and Alves2017) used the same construction for the region between 200 and 400 mT to calculate the variation of iron hydroxides during beneficiation.
Results and discussion
Yield
The particle size-distribution results are reported in Table 2. The difference in the yield values between the samples from Equador (~20%) and Junco do Seridó (61.3%) are related to the larger microcline abundance in zone III than in zone II of the pegmatite, which allows for subsequent kaolinization processes and higher yields in zone III.
Table 2. Mass balance after granulometric classification at 44 μm and magnetic separation at 14,000 Gauss.

Particle-size analysis
The particle-size analysis results are shown in Fig. 3. After the granulometric classification at 44 μm, particle sizes >44 μm would not be expected. This could be related to the agglomeration of kaolinite particles or to inefficiencies in the granulometric classification at 44 μm. Neither of the samples shows a particle-size distribution that is suitable for industrial uses (Table 1), suggesting the need for additional particle-size classification processes in addition to the traditional beneficiation of kaolin.

Fig. 3. Particle-size distribution of the <44 μm fractions in accumulated volume (%).
X-ray diffraction
Kaolinite was identified by the presence of the basal reflections at 7.16 Å (001) and 3.58 Å (002) and by the triplets 4.45–4.35–4.17 and 2.56–2.53–2.49 Å, muscovite by the basal reflections at 9.98 Å (001) and 4.98 Å (002), quartz by the diffraction maximum at 3.3 Å (011) and microcline by the diffraction maximum at 3.25 Å (002) (Fig. 4).

Fig. 4. XRD traces of the bulk samples and the <44 μm fractions. The XRD patterns of samples EQ-1, EQ-2 and JS-1 are from Campos et al. (Reference Campos, Bertolino and Alves2017). Ill = illite; Kln = kaolinite; Mc = microcline; Ms = muscovite; Qtz = quartz.
In the <2 μm oriented fractions, the basal reflections of kaolinite were not affected by ethylene-glycol treatment, but they decreased and collapsed after heating at 350°C and 550°C, respectively (Fig. 5). Illite was determined in some of the <2 μm fractions, and the (001) basal reflection was not affected by ethylene-glycol treatment after heating at 350°C and 550°C (Brindley, Reference Brindley, Brindley and Brown1980).
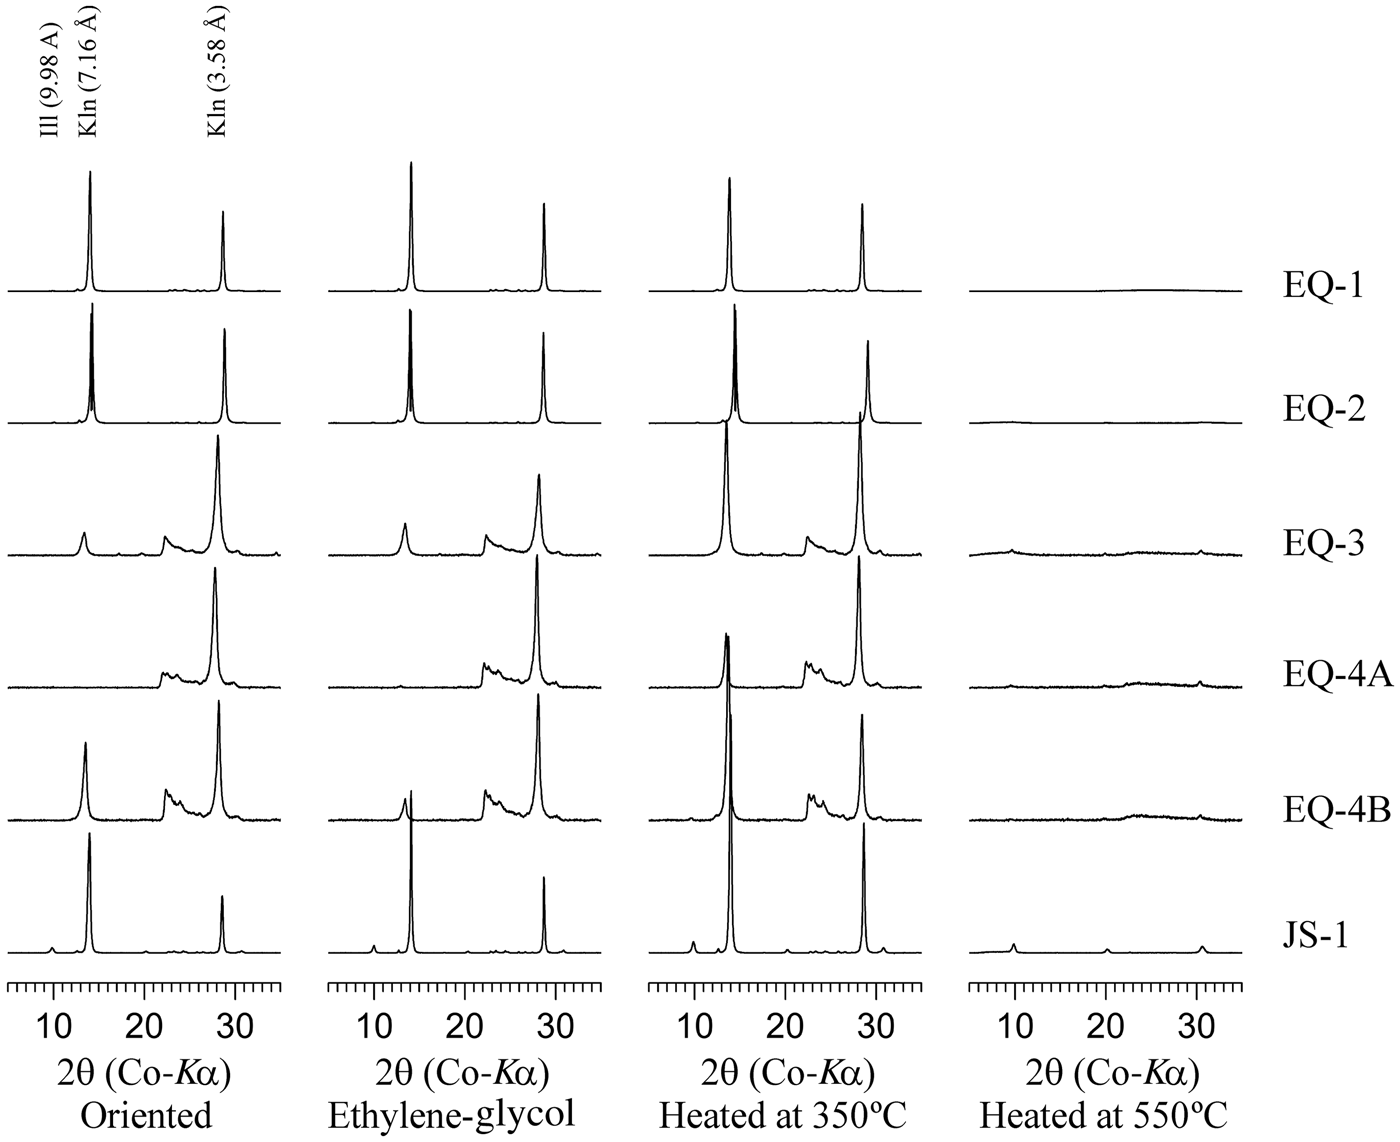
Fig. 5. XRD traces of the <2 μm oriented fractions treated with ethylene-glycol and heated at 350°C and 550°C. Ill = illite; Kln = kaolinite.
The 001 and 002 kaolinite basal reflections of the <2 μm fractions of the EQ-3, EQ-4A and EQ-4B samples were inconsistent in relation to those described in the literature (Brindley, Reference Brindley, Brindley and Brown1980). These samples were collected from shallower depths than the EQ-1, EQ-2 and JS-1 samples, and they might indicate poorly crystalized kaolinite. However, kaolinite was identified in the XRD traces of the <44 μm fractions (Fig. 4); therefore, these inconsistencies did not affect the interpretations.
XRF analysis
The chemical analysis results are listed in Table 3. The reduction in SiO2 and the increase in Al2O3 and loss on ignition (LOI) indicate partial removal of muscovite, quartz and microcline and an increase in the kaolinite content. This is in accord with the particle-size analysis results and the theoretical kaolinite chemical composition (Murray & Keller, Reference Murray, Keller, Murray, Bundy and Harvey1993) after particle-size classification at 44 μm.
Table 3. Chemical analyses of bulk samples and the <44 μm fractions (wt.%). The chemical analyses of the <44 μm fractions of the EQ-1, EQ-2 and JS-1 samples are from Campos et al. (Reference Campos, Bertolino and Alves2017).

The SiO2 contents of all of the fractions were within the specifications for the paper and ceramics industries, while the Al2O3 contents were greater than expected. This was not considered a disadvantage for industrial applications because the XRD traces did not show the presence of Al2O3-rich minerals other than kaolinite. The Fe2O3 and TiO2 contents and LOI were also within the specifications for most industrial uses. The small Fe2O3 and TiO2 contents are in accordance with the low abundance of impurities, and the LOI values suggest that the kaolins are suitable as paper fillers and in ceramics.
Chemistry of kaolinite
The average kaolinite structural formula determined from the chemical analyses performed on the <2 μm fractions (Table 4) was (Al4.031Fe0.039Mg0.016)(Si3.757Al0.243)O10(OH)8.
Table 4. Chemical composition (wt.%) and structural formula of kaolinite based on <2 μm fractions.

The XRD traces of the <2 μm fractions indicate that kaolinite is the predominant phase present, with traces of illite. The high values of Al2O3 are related to the replacement of Si4+ by Al3+ in tetrahedral sites, and the low values of Fe2O3 indicate limited replacement of Al3+ by Fe3+ in octahedral sites in comparison with other studies (Kadir & Akbulut, Reference Kadir and Akbulut2009; Erkoyun & Kadir, Reference Erkoyun and Kadir2011). The Na+ and P5+ detected (Table 4) are attributed to the sodium hexametaphosphate used as a deflocculant during separation of the <2 μm fraction, while K+ is attributed to trace illite.
Scanning electron microscopy
Kaolinite was identified as the only kaolin mineral present in the samples. Morphologically, the crystals are subhedral and occur as booklets built of well-defined platelets. The kaolinite size varies between 1 and ~40 μm (Fig. 6a–f). Microcline crystals are ~100 μm, quartz crystals are ~40 μm and muscovite crystals are ~20 μm in size (Fig. 6g–i).

Fig. 6. SEM images of the kaolin samples. (a,b,c) Kaolinite dispersed and aggregated in the fractions <2 μm. (d) Kaolinite booklet in the fraction <44 μm. (e) Palettes of kaolinite dispersed and muscovite crystals in the fraction <44 μm. (f) Kaolinite agglomerates in the fraction <44 μm. (g,h,i) Muscovite, microcline and quartz crystals in bulk fraction, respectively. The image in (g) of the <44 μm fraction of the JS-1 sample is from Campos et al. (Reference Campos, Bertolino and Alves2017). Kln = kaolinite; Mc = microcline; Ms = muscovite; Qtz = quartz.
Electron paramagnetic resonance spectroscopy
The EPR spectra of the <44 μm fractions show resonance signals at 74 mT and a triplet at 135, 156 and 182 mT, indicating that Fe3+ is octahedral, replacing Al3+ in the kaolinite structure (Meads & Malden, Reference Meads and Malden1975). The signal between 200 and 400 mT indicates the presence of free Fe-oxyhydroxides (Fig. 7) (Meads & Malden, Reference Meads and Malden1975; Scorzelli et al., Reference Scorzelli, Bertolino, Da Luz, Duttine, Silva and Munayco2008). The kaolinite phase containing octahedral Fe3+ was not affected by the beneficiation process, unlike the Fe-oxyhydroxides. The sextet between 300 and 400 mT indicates the presence of Mn2+, and the resonance signals at 350 mT are associated with the induced radiation effect (Clozel et al., Reference Clozel, Allard and Muller1994). In the EQ-5 sample, the Fe-oxyhydroxide resonance signals overlap with the resonance signals of octahedral Fe3+ due to the greater Fe-oxyhydroxide content, in accordance with the greater Fe2O3 content detected during the chemical analysis (Table 3).

Fig. 7. EPR spectra of the <44 μm fractions. The spectra of samples EQ-1, EQ-2 and JS-1 are from Campos et al. (Reference Campos, Bertolino and Alves2017).
Optical properties and semi-quantitative analyses of EPR
The semi-quantitative optical and quantitative EPR analyses were used to monitor the variation of brightness index (% ISO) during the two beneficiation routes, mainly during chemical bleaching. These values and the optical property values are depicted in Fig. 8. After an initial 30 min of chemical bleaching in both beneficiation routes, significant increases in the brightness index and lightness and significant decreases of redness and yellowness were observed. These indicate that the chemical treatment is efficient and should be the main process for impurity removal. The magnetic separation caused small changes in the optical properties which did not result in improvements in technological properties. The processing period lasting between 60 and 120 min did not cause significant changes in the optical properties of the kaolin. The results from both beneficiation routes based on the industrial parameters in Table 1 indicate that sample EQ-1 is suitable for paper (coating), sample EQ-2 is suitable for paper (filling) and ceramics and the remaining samples are suitable for ceramics.

Fig. 8. Optical properties and quantitative EPR analyses during the beneficiation routes with and without magnetic separation. The values after magnetic separation and chemical bleaching of fractions EQ-1, EQ-2 and JS-1 are from Campos et al. (Reference Campos, Bertolino and Alves2017). a.m.s. = after magnetic separation; 30, 60, 90 and 120 min = time of chemical bleaching.
Magnetic separation was responsible for small decreases in the area of the signal between 200 and 400 mT, while the initial 30 min of chemical bleaching were sufficient to cause the maximum decrease of this area, and consequently to reduce the Fe-oxyhydroxide contents. Chemical bleaching for >30 min was not sufficient to decrease the signal area between 200 and 400 mT. Chemical bleaching for 90–120 min might have caused re-precipitation of iron phases (Bertolino et al., Reference Bertolino, Rossi, Scorzelli and Torem2010). These phases did not influence the colour properties of the kaolin samples.
Conclusions
The BPP kaolin contains subhedral kaolinite with pseudo-hexagonal morphology, forming booklets with high tetrahedral replacement of Si4+ by Al3+ in tetrahedral sites and low replacement of Al3+ by Fe3+ in octahedral sites. Quartz, muscovite, microcline and a smaller amount of illite were identified as impurities.
Magnetic separation did not improve significantly the colour properties of the kaolin samples, in contrast to chemical bleaching which significantly enhanced these properties. However, chemical bleaching was not effective at durations >30 min, indicating that a longer chemical bleaching process is not necessary.
Based on the chemical composition, particle size and physical properties, the ore after beneficiation is mostly suitable for the ceramics industry. However, it would be necessary to introduce additional processes of classification in order to render the particle-size distribution adequate, and it would be necessary to conduct tests of fired bodies in order to assess ceramic properties such as linear shrinkage and water absorption.
Acknowledgements
The authors thank the Center for Mineral Technology (CETEM), Brazilian Center for Research in Physics (CBPF), Rio de Janeiro State Research Foundation (FAPERJ) and Rio de Janeiro State University (UERJ) for their support, as well as the reviewers for their critical assessment of this paper, which helped to improve it. This study was also funded by the Institutional Scientific Initiation Scholarship Program (PIBIC) of the Brazilian National Council for Scientific and Technological Development (CNPq) (grant numbers 167939/2014-9; 126802/2016-5; 122013/2017-4).


