


Major faults in sedimentary basins modify significantly the potential for fluid migration, mineralization and hydrocarbon production. During the formation, infill and evolution of sedimentary basins, faults adopt burial, pre-, syn- and post-kinematic deformation patterns that reflect the structural setting and ambient stress field. Consequently, their hydrological and mechanical behaviours change over time. The evolution of faults, and also of sedimentary basins, may be approached by analysis of their physicochemical properties in order to quantify the evolution of thermo-barometric markers. One of these thermo-barometric markers is the ‘crystallinity’ of clay minerals (e.g. illite and chlorite). The present study is based on illite ‘crystallinity’ (IC). The IC or Kübler index (KI; referring to the pioneering study of Kübler, Reference Kübler1964) is defined as the full width at half maximum (FWHM) of the first illite basal reflection at 10 Å in X-ray diffraction (XRD) patterns, expressed in ∆°2θ (Frey, Reference Frey1987; Guggenheim et al., Reference Guggenheim, Bain, Bergaya, Brigatti, Drits, Eberl, Formoso, Galán, Merriman, Peacor, Stanjek and Watanabe2002). Guggenheim et al. (Reference Guggenheim, Bain, Bergaya, Brigatti, Drits, Eberl, Formoso, Galán, Merriman, Peacor, Stanjek and Watanabe2002) recommended that the use of the term ‘crystallinity index’ should be avoided, although it may be placed within quotation marks when referring to previously referenced work. By combining the study of clay minerals (reaction series of phyllosilicates) and organic matter (vitrinite and solid bitumen reflectance) researchers aim to characterize basin thermal evolution, burial depth, subsidence history, eroded load and the role of clays in fault zones.
The occurrence of major fluid migrations along decollements in subduction wedges is well known and well documented (Le Pichon et al., Reference Le Pichon, Henry and Lallemand1990; Moore et al., Reference Moore, Shipley, Stoffa, Karig, Taira, Kuramoto, Tokuyama and Suyehiro1990, Reference Moore, Moore, Cochrane and Tobin1995; Moore & Vrolijk, Reference Moore and Vrolijk1992; Lewis & Marshall, Reference Lewis and Marshall1996; Bangs et al., Reference Bangs, Shipley, Moore and Moore1999; Bruhn et al., Reference Bruhn, Parry and Bunds2000; Henry et al., Reference Henry, Lallemant, Nakamura, Tsunogai, Mazzotti and Kobayashi2002; Sibson & Rowland, Reference Sibson and Rowland2003; Barnes et al., Reference Barnes, Lamarche, Bialas, Henrys, Pecher, Netzeband, Greinert, Mountjoy, Pedley and Crutchley2010). However, the history of fluid–rock interaction, the composition of migrating fluids and the pathways of fluid circulation are less well understood. Orogenic prisms with active fluid systems are often offshore, and thus models of fluid migration along faults are generally based on marine seismic studies of present-day systems (for the New Zealand eastern margin, see Henrys et al., Reference Henrys, Woodward and Pecher2009; Barnes et al., Reference Barnes, Lamarche, Bialas, Henrys, Pecher, Netzeband, Greinert, Mountjoy, Pedley and Crutchley2010; Crutchley et al., Reference Crutchley, Pecher, Gorman, Henrys and Greinert2010; Pecher et al., Reference Pecher, Henrys, Wood, Kukowski, Crutchley, Fohrmann, Kilner, Senger, Gorman and Coffin2010; Plaza-Faverola et al., Reference Plaza-Faverola, Klaeschen, Barnes, Pecher, Henrys and Mountjoy2012, Reference Plaza-Faverola, Pecher, Crutchley, Barnes, Bünz, Golding, Klaeschen, Papenberg and Bialas2014). Fault zones have more recently been the focus of significant interest, as shown in a number of recently published studies (e.g. Buatier et al., Reference Buatier, Chauvet, Kanitpanyacharoen, Wenk, Ritz and Jolivet2012, Reference Buatier, Cavailhes, Charpentier, Lerat, Sizun, Labaume and Gout2015; Lacroix et al., Reference Lacroix, Charpentier, Buatier, Vennemann, Labaume, Adatte, Travé and Dubois2012; Trincal et al., Reference Trincal, Charpentier, Buatier, Grobety, Lacroix, Labaume and Sizun2014; Schleicher et al., Reference Schleicher, Sutherland, Townend, Toy and van der Pluijm2015; Abd Elmola et al., Reference Abd Elmola, Charpentier, Buatier, Lanari and Monié2017) combining structural geology, petrology, clay mineralogy and geochemistry.
The aim of the present study is to determine the conditions for allochemical or isochemical formation of clay minerals in two thrust zones. Because it was not possible to distinguish the fault core from the damage zone without detailed fracture mapping in the study area, the term ‘fault zone’ was used to describe the structures investigated in this study. Both tectonic structures affect well-lithified sandstones and mudstones in a low-grade diagenetic setting. The thrusts studied are the Whakataki and Adams-Tinui faults located within the Hikurangi subduction wedge, onshore from the Wairarapa Coast, eastern North Island of New Zealand (Fig. 1). The onshore locations of the faults allow the study of the mineralogical and chemical compositions of samples in the fault zones and the determination of the maximum temperature conditions experienced. These results allow discrimination of the various origins of fault gouge clays by: (1) metasomatism from migrating fluids; (2) in situ diagenetic formation (precipitation); and (3) physical grinding during tectonic activity and subsequent diagenetic neoformation by deformation catalysis. X-ray diffraction also allows the determination of the swelling or non-swelling potential of clays as well as the clay mineral species and polytypism. This helps us to understand the various permeability and rheology conditions in faults at similar strain and stress geometries and strain rates. Moreover, grade of metamorphism may be evaluated by the determination of IC (via KI) and chlorite ‘crystallinity’ (via Árkaï index [AI]), as well as with the use of a chlorite geothermometer (e.g. Bourdelle et al., Reference Bourdelle, Parra, Chopin and Beyssac2013), because the chemical composition of chlorite is sensitive to pressure and temperature. These various methods will be combined on the same sample mineral and also combined with optical methods on organic matter reflectance to allow reconstruction of the pressure and temperature evolution of the fault zones. Due to varying reaction kinetics, different clay mineral indicators for determining metamorphism may display different steps of a pressure (P)–temperature (T)–time (t) path (Abad et al., Reference Abad, Nieto and Gutiérrez-Alonso2003b). For example, studies involving chlorite and illite ‘crystallinities’ have shown various evolution pathways as a function of the cation activity of essential cations such as K+, Mg2+ and Fe2+ in pore fluids (Warr & Cox, Reference Warr and Cox2016). A multi-method investigation of clay minerals and organic matter, combined with maturity modelling where possible, is recommended for determining the pressure- and temperature-dependent alteration histories of faults within tectonically active basins (Allen & Allen, Reference Allen and Allen2005; Ferreiro Mählmann et al., Reference Ferreiro Mählmann, Botzkaya, Potel, Le Bayon, Šegvić and Nieto García2012). In this study, temperatures obtained with the chlorite geothermometer are compared to those obtained with organic-matter reflectance.
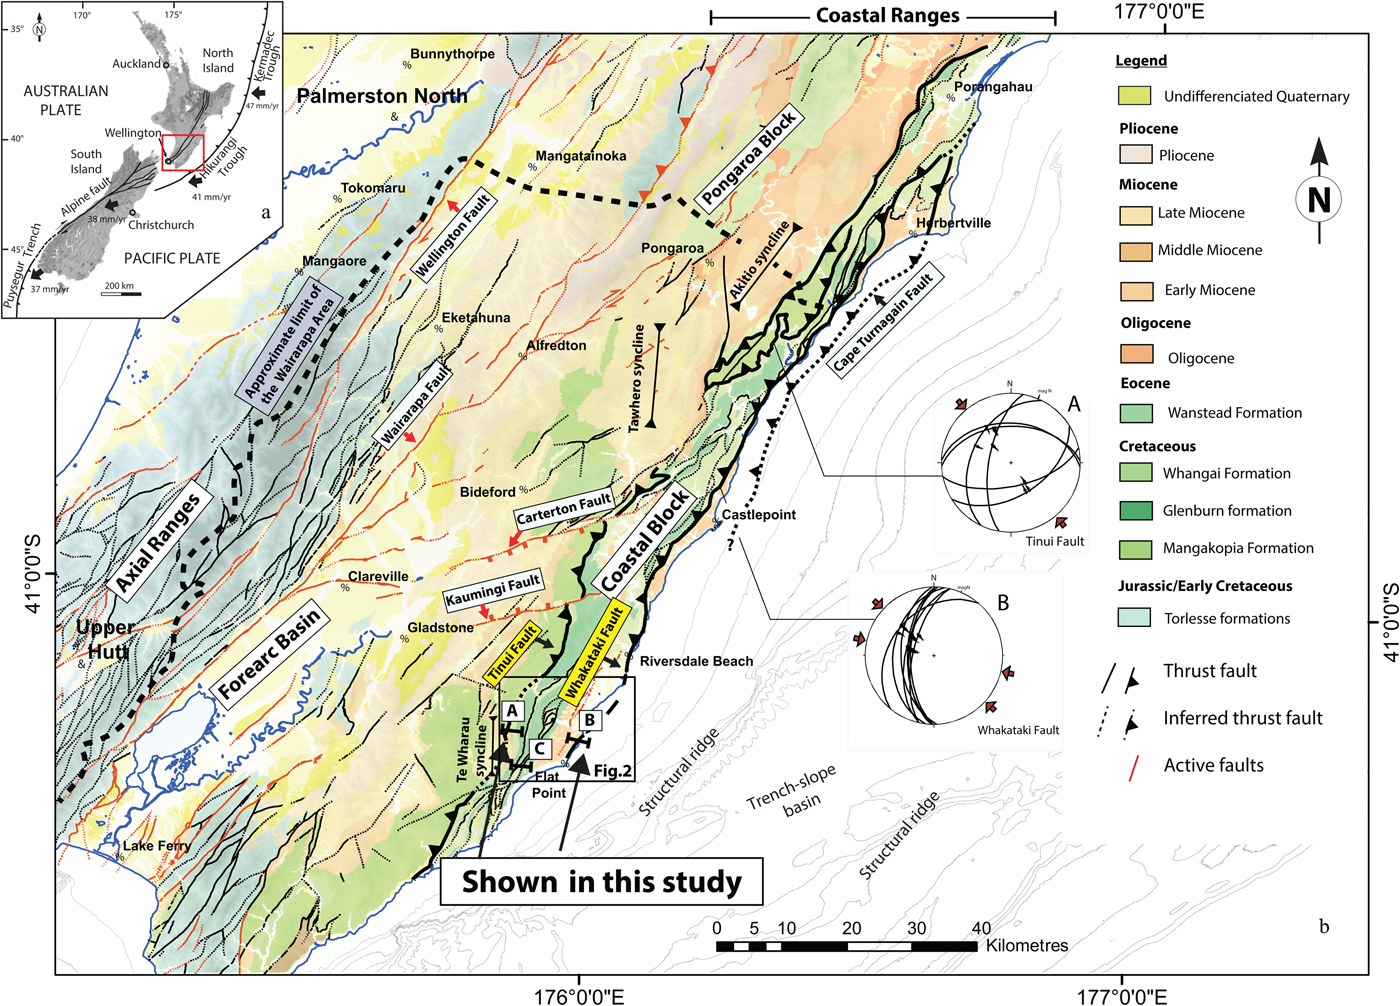
Fig. 1. (a) Plate tectonic setting of New Zealand showing the location of the study area. (b) Simplified structural map of the Wairarapa area (modified from Chanier et al., Reference Chanier, Ferrière and Angelier1999; Lee & Begg, Reference Lee and Begg2002) and stress tensor analysis (Schmidt net, lower hemisphere) showing the main directions of principal horizontal shortening (red arrows) attributed to Plio-Quaternary deformation for the Adams-Tinui and Whakataki faults (from Bailleul et al., Reference Bailleul, Chanier, Ferrière, Robin, Nicol, Mahieux, Gorini and Caron2013). The map shows the location of the two studied thrusts: the Whakataki and the Adams-Tinui faults. See cross-sections A, B and C in Fig. 3 and text for explanations.
GEOLOGICAL SETTING
General overview
The East Coast Basin (ECB) is located on the Hikurangi active margin, where the Pacific Plate is subducted below the Australian Plate (Fig. 1). The Hikurangi subduction wedge is composed of deformed Jurassic to Palaeogene sedimentary rocks, overlaid by the less deformed Neogene syn-subduction marine rocks of the ECB (Lewis & Pettinga, Reference Lewis and Pettinga1993). Onshore, in the Coastal Ranges of the eastern North Island of New Zealand, Neogene rocks form a succession of elongated synclines, separated by structural ridges, parallel to the subduction front (e.g. Lewis & Pettinga, Reference Lewis and Pettinga1993; Nicol et al., Reference Nicol, Mazengarb, Chanier, Rait, Uruski and Wallace2007; Bailleul et al., Reference Bailleul, Chanier, Ferrière, Robin, Nicol, Mahieux, Gorini and Caron2013).
Tectonic history
Since the onset of subduction (ca. 25 Ma ago), poly-phase deformation has been responsible for the development of the Coastal Ranges with their complex stratigraphy disrupted by multiple structures. Three main phases of Neogene deformation have been reported:
(1) An Early Miocene to early Middle Miocene (ca. 17.5–15.0 Ma) compressional phase. This tectonic episode began in the southern part of the Coastal Ranges with the seaward emplacement of thrust-sheets (ca. 25–18 Ma) followed by E–W contraction responsible for extensive reverse faulting, folding and development of trench-slope basins bound by structural highs (Chanier & Ferrière, Reference Chanier and Ferrière1989, Reference Chanier1991; Rait et al., Reference Rait, Chanier and Waters1991; Bailleul et al., Reference Bailleul, Chanier, Ferrière, Robin, Nicol, Mahieux, Gorini and Caron2013).
(2) A Middle–Late Miocene period (ca. 15.0–6.5 Ma) of widespread subsidence (e.g. Chanier et al., Reference Chanier, Ferrière and Angelier1992, Reference Chanier, Ferrière and Angelier1999; Bailleul et al., Reference Bailleul, Chanier, Ferrière, Robin, Nicol, Mahieux, Gorini and Caron2013). This phase was coeval with normal faulting and syn-sedimentary gravitational collapse and was attributed to a 5–10-Myr period of tectonic erosion over the whole subduction margin (Chanier et al., Reference Chanier, Ferrière and Angelier1992, Reference Chanier, Ferrière and Angelier1999). The extensional deformation appears to have occurred mainly upslope of the margin and contemporaneously with the downslope development of a frontal imbricated thrust wedge (Bailleul et al., Reference Bailleul, Chanier, Ferrière, Robin, Nicol, Mahieux, Gorini and Caron2013).
(3) A tectonic inversion during a renewed compressional phase from 6.5 Ma to present day (e.g. Bailleul et al., Reference Bailleul, Chanier, Ferrière, Robin, Nicol, Mahieux, Gorini and Caron2013). During this late Neogene to present-day contractional period (Chanier, Reference Chanier1991; Nicol et al., Reference Nicol, Van Dissen, Vella, Alloway and Melhuish2002, Reference Nicol, Mazengarb, Chanier, Rait, Uruski and Wallace2007; Nicol & Beavan, Reference Nicol and Beavan2003), margin deformation was dominated by regional folding and mainly landward-dipping reverse faulting (Fig. 1). This led to the uplift and emergence of the Coastal Ranges, including the Wairarapa Region where the study area is located (Nicol et al., Reference Nicol, Van Dissen, Vella, Alloway and Melhuish2002, Reference Nicol, Mazengarb, Chanier, Rait, Uruski and Wallace2007; Bailleul et al., Reference Bailleul, Chanier, Ferrière, Robin, Nicol, Mahieux, Gorini and Caron2013).
The Adams-Tinui and Whakataki faults
In the study area, the main structures are sub-parallel to the subduction front, typically oriented NNE–SSW. Miocene marine strata are generally exposed within elongated wide synclines bounded by highly deformed basement (lithified rocks older than Late Cretaceous) structural highs affected by reverse faults, mainly dipping to the WNW. One of the structural highs, the Coastal Block, shows two regional NNE–SSW fault zones: the Adams-Tinui fault and the Whakataki fault (e.g. Lee & Begg, Reference Lee and Begg2002).
The Adams-Tinui fault was responsible for eastward thrusting of Early Cretaceous rocks over Late Cretaceous–Paleogene strata, and the Whakataki fault was responsible for seaward thrusting of Late Cretaceous and Eocene rocks over Early Miocene flysch deposits (Chanier, Reference Chanier1991). The Whakataki fault acts as the eastern boundary of the Coastal Block (Moore, Reference Moore1988). The Whakataki fault and possibly the Adams-Tinui fault appear to have accommodated Quaternary displacement. Approximately 10 km north of Castlepoint, the Whakataki fault displaces Quaternary marine terrace deposits (Bailleul et al., Reference Bailleul, Chanier, Ferrière, Robin, Nicol, Mahieux, Gorini and Caron2013). The most recent striations on the Adams-Tinui and Whakataki faults indicate mainly dip-slip motion and reveal a SE–NW trend of principal shortening direction (stereoplots A and B in Fig. 1). This shortening direction is similar to the main directions of post-Pliocene shortening over the whole area (Bailleul et al., Reference Bailleul, Chanier, Ferrière, Robin, Nicol, Mahieux, Gorini and Caron2013). Earlier deformations along these fault zones are expressed in deformation patterns in fault crush zones that correspond to the soles of major nappes from the Coastal Ranges. They indicate a N–S to NW–SE direction of thrusting that is attributed to the earliest Miocene deformation in the Flat Point area (Chanier, Reference Chanier1991; Chanier & Ferrière, Reference Chanier and Ferrière1991), such as in the Akitio area (Delteil, Reference Delteil, Morgans, Raine, Field and Cutten1996). These major faults from the inner subduction wedge have undergone a complex polyphase evolution with several steps of compression and seaward thrusting.
Stratigraphy
The Jurassic to Early Cretaceous Torlesse formation (C1 in Fig. 2) is composed of metasedimentary rocks deposited in an accretionary prism setting during earlier subduction processes (George, Reference George1990, Reference George1992). It consists of a well-indurated rock suite of predominantly sandstones and mudstones with some interbedded layers of spilitic basalt, tuff, chert and very rare limestones (Suneson, Reference Suneson1993). The Late Cretaceous to early Palaeocene section is a stratiform succession of Glenburn (C2 + C3) and Whangai (C4) Formations (Fig. 2). The Glenburn formation (C2 + C3) consists of dominantly alternating conglomerates, with sandstones and siltstones representing coarse-grained turbidite deposits. The total thickness of the Glenburn formation has been estimated locally to be >1000 m. The Whangai formation (C4 in Fig. 2) is a massive micaceous siltstone/shale formation with occasional glauconite sandstone beds and magmatic dykes. The formation, which is up to ~1000 m thick, is mostly siliceous at its base (Campanian–Maestrichtian times) and becomes calcareous towards the top of the series, which is dated Palaeocene in age. The Palaeocene, and the Late Maestrichtian, show locally, some pelagic limestones alternating with beds of glauconite sandstones (Chanier et al., Reference Chanier1990). In the most distal tectonic units, the Palaeocene is characterized by the development of organic-rich shales (Waipawa Black Shale), which are known to be the main source rock within the ECB (e.g. Field et al., Reference Field and Uruski1997; Lee & Begg, Reference Lee and Begg2002; Hollis et al., Reference Hollis, Tayler, Andrew, Taylor, Lurcock, Bul and Kulhanek2014). The Waipawa formation ranges from a few metres to ~50 m in thickness and is typically composed of non-calcareous to weakly calcareous dark chocolate-brown micaceous and sulfurous mudrocks with fine organic material scattered throughout. The Waipawa Black Shale is characterized by a high total organic carbon content and a high hydrogen index (Hollis et al., Reference Hollis, Tayler, Andrew, Taylor, Lurcock, Bul and Kulhanek2014). During the Eocene–Oligocene period, the sedimentation was dominantly hemipelagic to pelagic, with notable deposition of marls and pelagic limestones. The Eocene Wanstead Formation comprises mainly smectite-rich calcareous mudstones with locally interbedded glauconite sandstones (e.g. Chanier & Ferrière, Reference Chanier and Ferrière1991; Field et al., Reference Field and Uruski1997; Lee & Begg, Reference Lee and Begg2002).
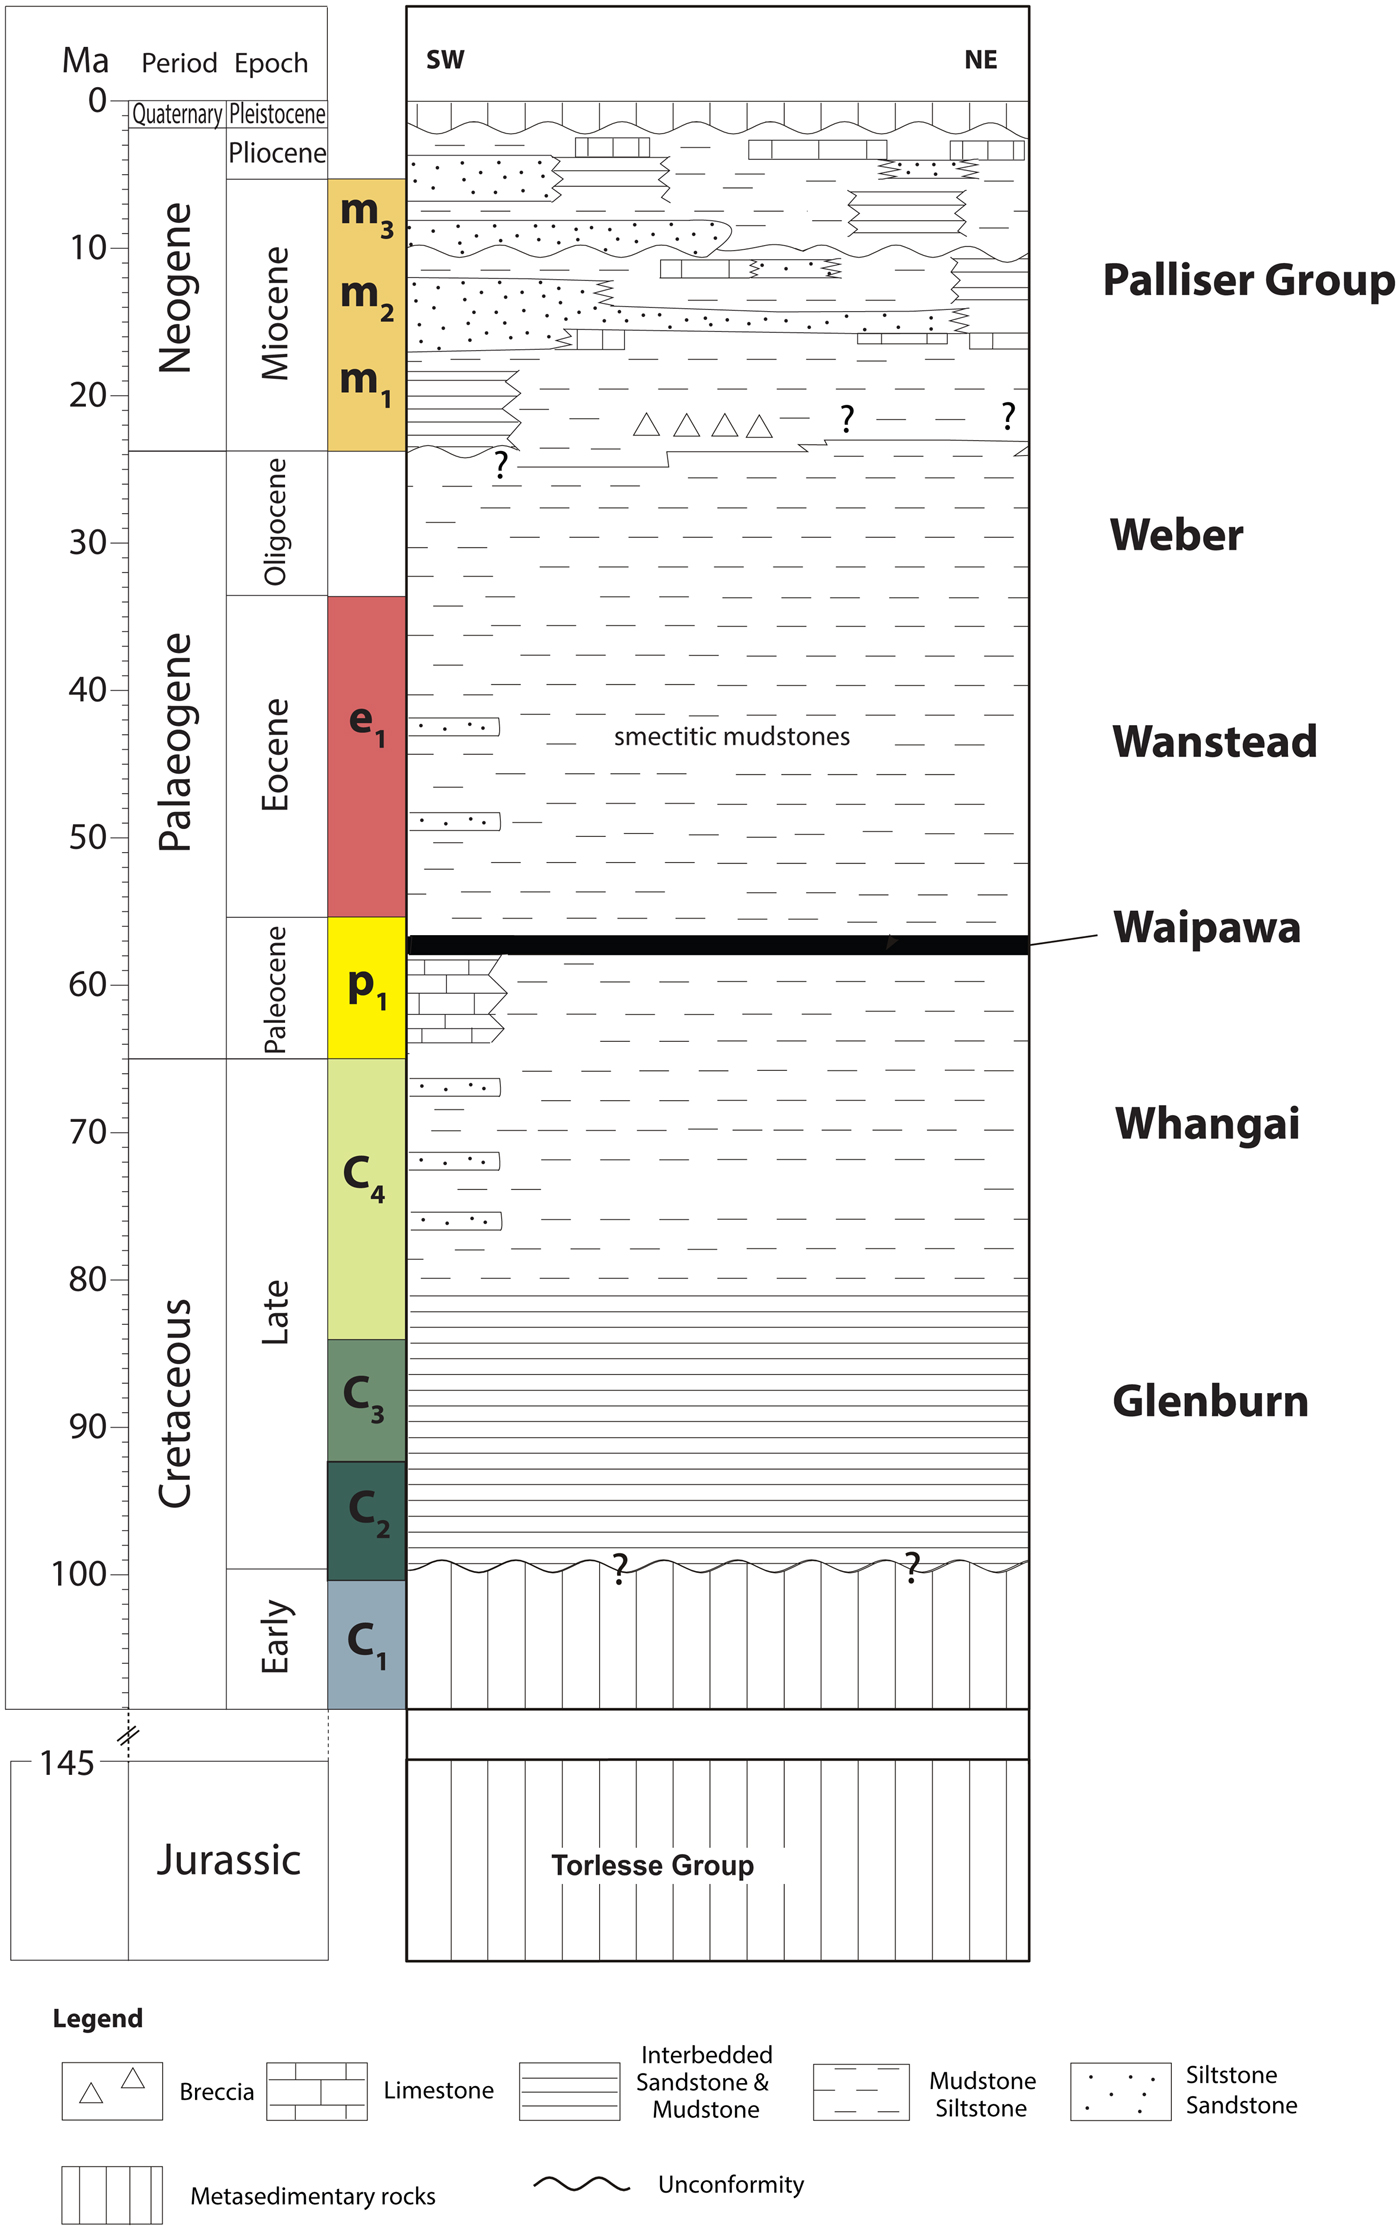
Fig. 2. Regional chronostratigraphic chart of the Wairarapa area (based on Field et al., Reference Field and Uruski1997).
Sampling sites
The sampling sites where the Adams-Tinui and the Whakataki faults crop out are located to the south of the Te Wharau area and to the north of the Flat Point area, respectively (Fig. 3).
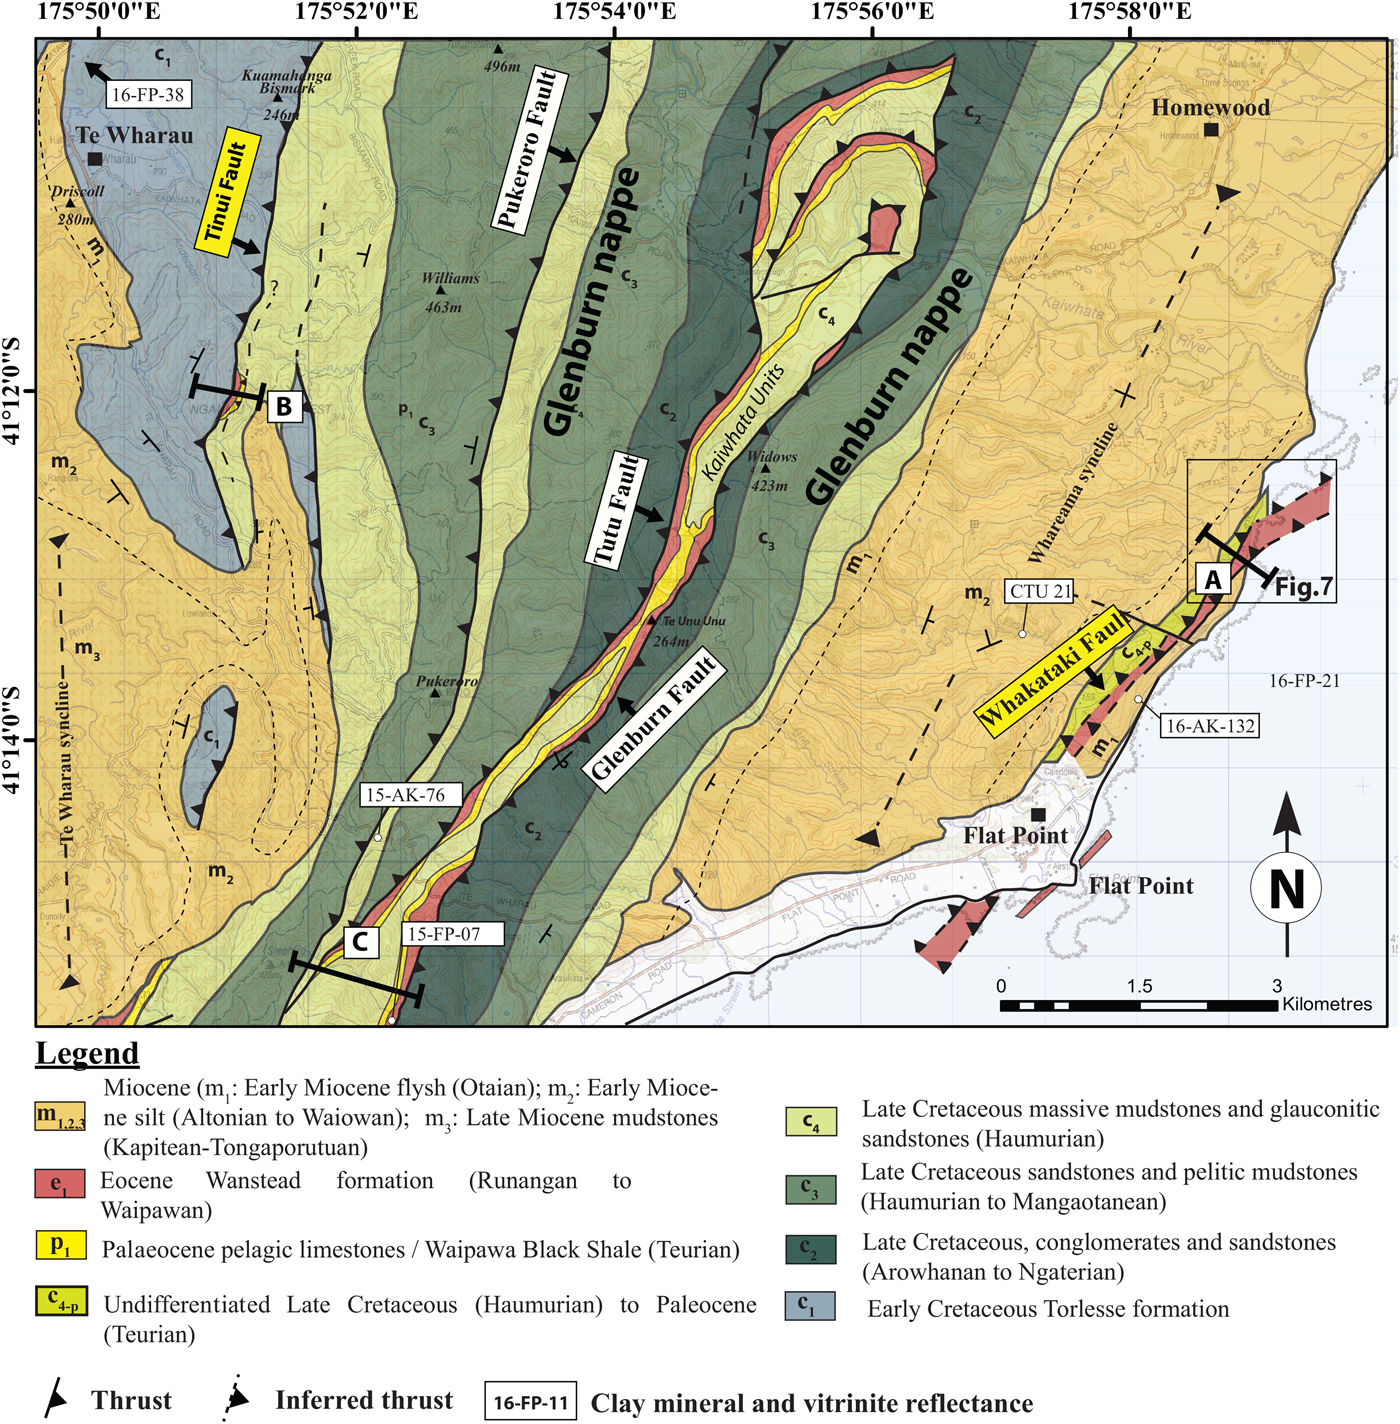
Fig. 3. Onshore geological map (from Chanier, Reference Chanier1991).
The Whakataki fault in the Flat Point area
In the Flat Point area (Fig. 3), undifferentiated Late Cretaceous to Palaeocene formations, dipping to the northwest, have been thrusted over the Early Miocene (Waitakian–Otaian NZ stage) turbiditic formation of the Flat Point Flysch (Chanier & Ferrière, Reference Chanier and Ferrière1991), which is equivalent in age and facies to the Whakataki formation further north. This thrust zone has been named locally as the Flat Point fault (Chanier & Ferrière, Reference Chanier and Ferrière1989; Chanier, Reference Chanier1991) and is considered to be the southern prolongation of the Whakataki fault, which is one of the major thrust faults of the Wairarapa Coastal Ranges (Chanier & Ferrière, Reference Chanier and Ferrière1991). This thrust fault is N025°E directed and is presently dipping about 75° towards the northeast. It corresponds to one of the main thrusts associated with the onset of subduction in the earliest Miocene (Chanier & Ferrière, Reference Chanier and Ferrière1991; Rait et al., Reference Rait, Chanier and Waters1991) which were later steepened on the limb of regional folds developed during Pliocene to Quaternary times (Chanier, Reference Chanier1991). This fault zone has therefore been regarded as a thick palaeo-decollement zone that participated in the tectonic stacking of kilometre-thick margin units. The decollement is composed of Eocene smectite clays with a scaly fabric containing blocks of glauconite sandstones that were originally interbedded with the clays of the Wanstead formation (Figs 3, 4).
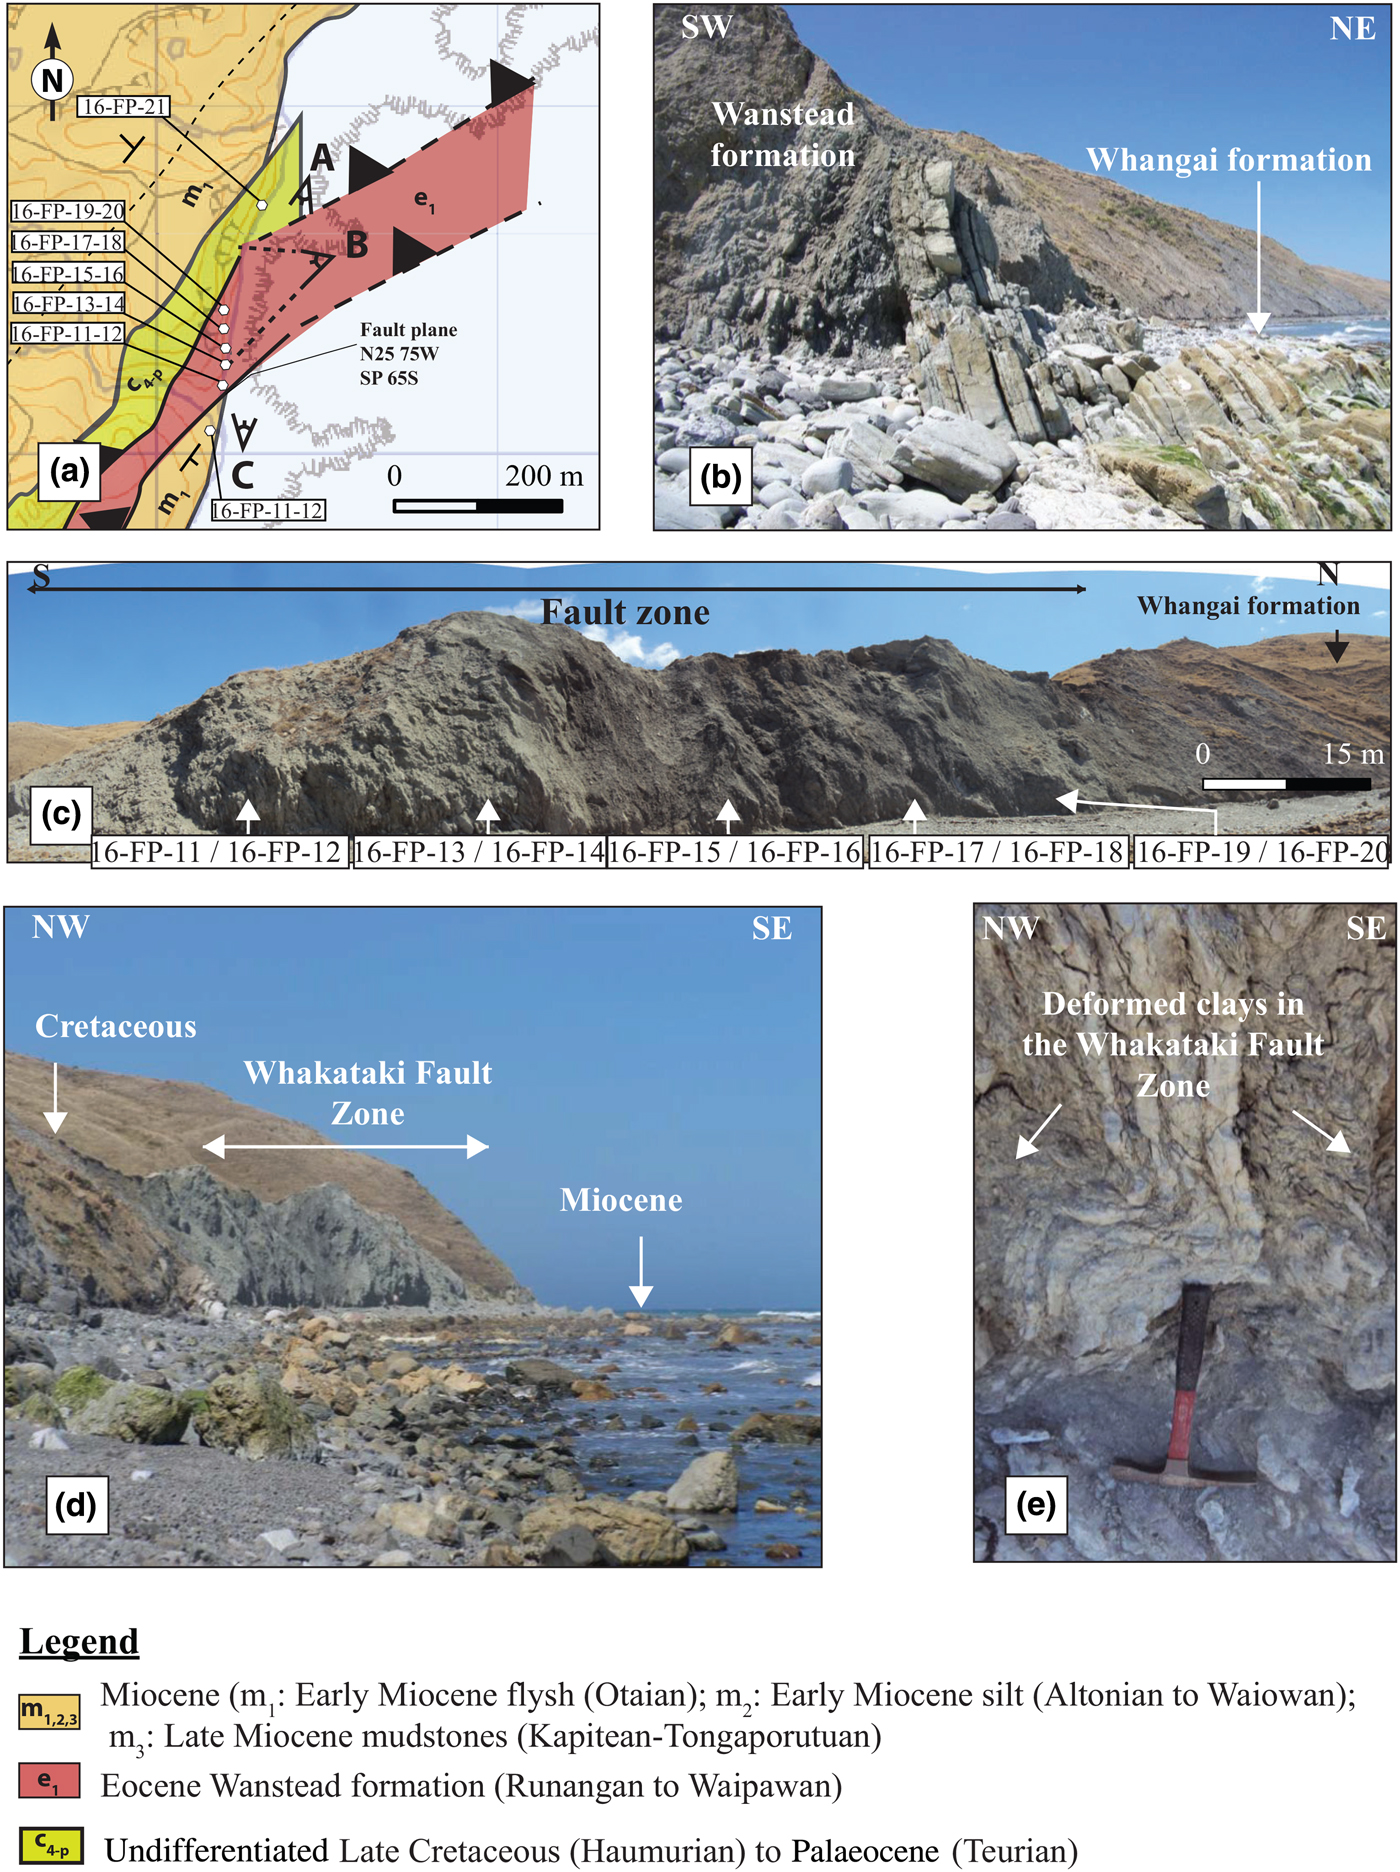
Fig. 4. (a) Detailed geological map of the Whakataki fault in the Flat Point area and location of the studied samples. (b) Field photograph of a faulted contact between the Eocene Wanstead Formation and the Late Cretaceous Whangai formation. (c) Panoramic view of the Eocene Wanstead formation in the Whakataki fault and location of samples 16-FP-11 to 16-FP-20. (d) Panoramic view of the fault zone, where the Cretaceous formation is thrusted over the Early Miocene formations. (e) Zoomed-in view of the folding and deformation in the Eocene Wanstead formations in the Whakataki fault zone.
The Adams-Tinui fault in the Te Wharau area
In the Te Wharau area, the Adams-Tinui fault crops out 3 km to the southeast of the Te Wharau settlement. The Early Cretaceous Torlesse Formation thrusts eastward on Late Cretaceous to Palaeocene rocks (Figs 3, 5a,b). The Early Cretaceous Torlesse formation is composed of metasedimentary rocks, predominantly greywackes and red mudrocks. The underlying Late Cretaceous Whangai units on the footwall are composed of massive deformed mudstones and sandstones. The deformation zone is composed of the Eocene smectite clays and glauconite sandstones of the Wanstead Formation, which has also been described for the Whakataki fault. A slaty cleavage (Fig. 5c) is visible in the outcrop with the presence of layers rich in phyllosilicates and an elongated fabric of phyllosilicate grains in the finer-grained components.
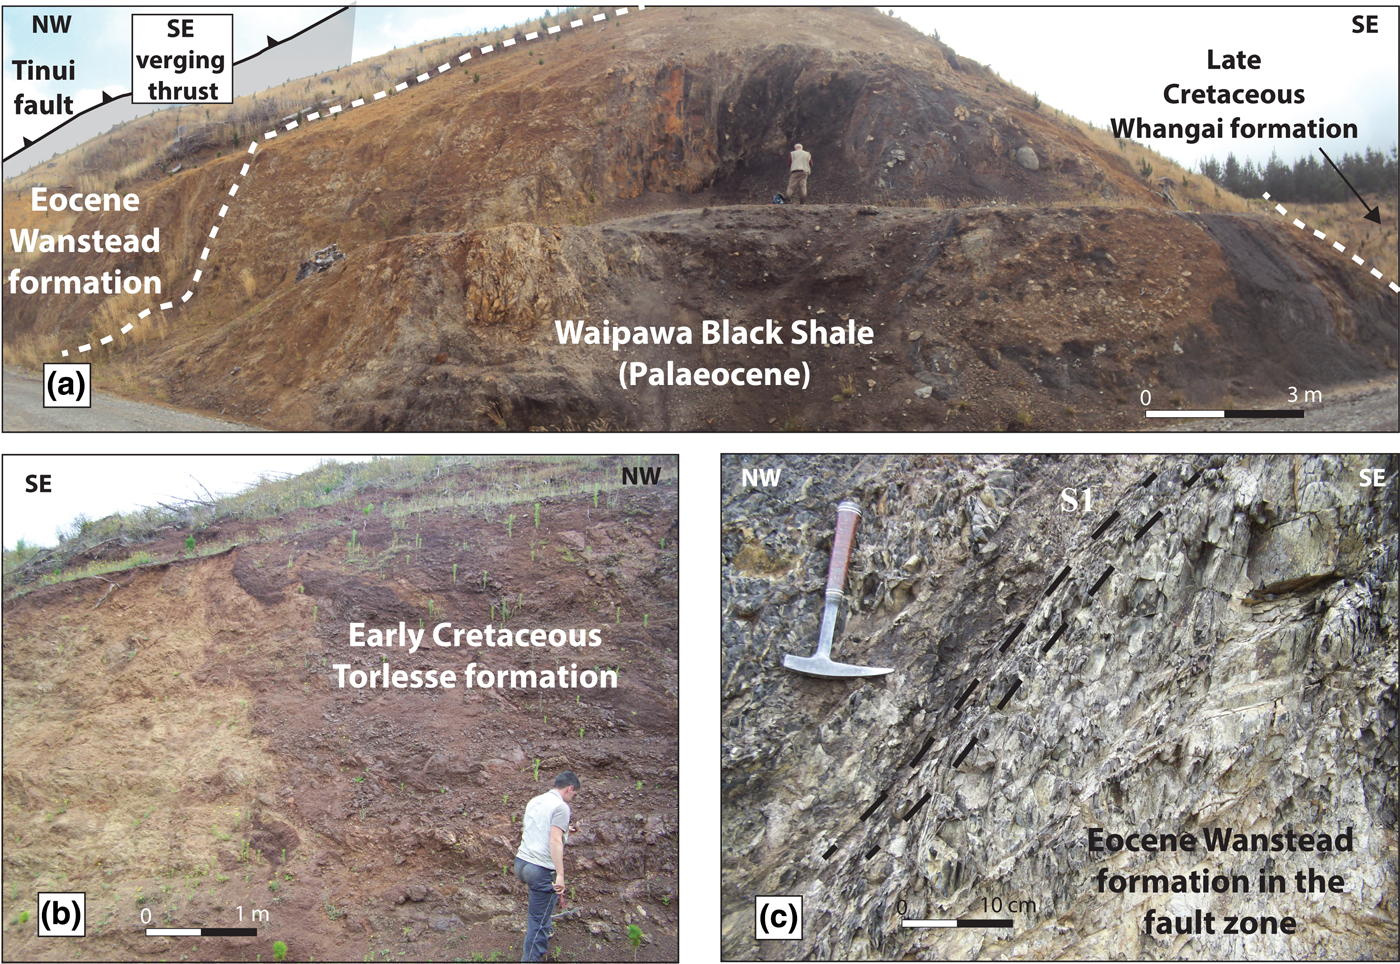
Fig. 5. (a) Panoramic view of the Adams-Tinui fault zone. (b) Early Cretaceous Torlesse Formation outcropping in the Adams-Tinui fault zone. (c) Field photograph of the deformed Eocene Wanstead Formation in the damage zone of the Adams-Tinui fault. See the pervasive, parallel layering of the finer-grained minerals (slaty cleavage) in a NE–SW direction.
To the east of the fault zone, the Palaeocene corresponds to the organic-rich Waipawa Formation. The core zone of the Adams-Tinui fault comprises deformed mudstones with slaty cleavage and is 2 m wide. The fault zone in the footwall is 50 m wide and is formed by a clayey matrix containing slightly deformed sandstones and mudstones (Fig. 5a,c).
MATERIALS AND METHODS
In the Whakataki fault, ten samples were collected in the footwall, hanging wall (fault zone) and core zone (fault gouge) of the fault (Fig. 4a). This enabled the characterization of clay minerals from representative mudstones and sandstones all along the fault zone, reflecting various degrees of deformation. In the fault zone, the sampling was undertaken every 15 m. We also added two samples from the thrusted Early Miocene (Otaian) Whakataki formation and from the Eocene Wanstead formation for vitrinite and solid bitumen reflectance studies.
In the Adams-Tinui fault, ten samples were collected in the footwall, hanging wall (fault zone) and core zone of the fault, enabling the same characterization of clay minerals as at the Whakataki fault. We sampled in the fault zone (more than 10 m away from the core zone) every 15 m. We also included three samples from the organic-rich Waipawa formation, one from the Late Cretaceous Whangai formation and one from the Eocene Wanstead formation for vitrinite and solid bitumen reflectance studies.
X-ray diffraction
In pelitic rocks and coarser siliciclastic rocks (except greywacke), diagnostic minerals and mineral assemblages of the very-low-grade metamorphic facies zone are scarce and only found in rocks with a very specific geochemical composition (Frey, Reference Frey1987). In these rocks, the transitions from non-metamorphic to low-grade (referring to the term ‘greenschist facies’ of Winkler, Reference Winkler1979) and from the very-low-grade (‘chlorite zone’ of Tilley, Reference Tilley1925) to low-grade metamorphic zone (‘biotite zone’ of Barrow, Reference Barrow1893) take place through the diagenetic zone, the anchizone and the epizone (cf., Kisch, Reference Kisch and Frey1987), with each zone being characterized by specific KI values (Kisch, Reference Kisch and Frey1987; Árkai et al., Reference Árkai, Faryad, Vidal and Balogh2003, Reference Árkai, Sassi, Desmons, Fettes and Desmons2007). The upper limit of the anchizone is defined in many metapelites by the occurrence of chloritoid, an index mineral of the greenschist facies (Kübler et al., Reference Kübler, Betrixe and Monnier1979). The anchizone is most correlated with the sub-greenschist and sub-blueschist facies vs. anthracite coal rank, as shown by Ferreiro Mählmann & Le Bayon (Reference Ferreiro Mählmann and Le Bayon2016; see also Kisch, Reference Kisch and Frey1987). In the present study, the 10 Å FWHM values refer to the IC of raw data, whereas KI corresponds to the values after calibration against Kübler’s scale (Kübler, Reference Kübler1967). We refer to the chlorite ‘crystallinity’ data in the same way, using the raw data for the 7-Å FWHM and the AI (Árkai, Reference Árkai1991) as measured after calibration.
Illite and chlorite ‘crystallinities’ are considered to be functions of crystallite thickness, the number of lattice defects (Merriman et al., Reference Merriman, Roberts and Peacor1990) and the peak interference, if any, with discrete smectite or illite-smectite mixed-layer compositions (Ferreiro Mählmann et al., Reference Ferreiro Mählmann, Botzkaya, Potel, Le Bayon, Šegvić and Nieto García2012). Temperature is thought to be the main factor controlling IC, but other parameters such as lithology, time, tectonic stress and fluid:rock ratio probably have important effects (see Frey, Reference Frey1987; Árkai et al., Reference Árkai, Ferreiro Mählmann, Suchy, Balogh, Sýkorová and Frey2002, Mullis et al., Reference Mullis, Ferreiro Mählmann and Wolf2017). A recent study from Warr & Cox (Reference Warr and Cox2016) has confirmed that clay ‘crystallinity’ (for illite and chlorite) provides a useful method for characterizing regional grades of low-temperature metamorphism (Árkai et al., Reference Árkai, Sassi and Sassi1995): illite and chlorite ‘crystallinities’ can be related with a nonlinear regression curve. This nonlinearity is presumed to be due to the presence of diagenetic 001 illite reflections in illite-smectite phases. For higher grades, the relation between illite and chlorite ‘crystallinities’ is more linear (Potel et al., Reference Potel, Ferreiro Mählmann, Stern, Mullis and Frey2006).
Experimental conditions
X-ray diffraction analysis was performed using a D8-Advance Bruker-AXS (Siemens) diffractometer, Ni-filtered Cu-Kα radiation at 40 kV and 40 mA, a primary soller slit of 2.5°, a divergence slit of 0.6 mm and a secondary soller slit of 2.5°, with a detector slit of 0.1 mm and an antiscattering slit of 0.6 mm. Samples were crushed with an agate pestle and mortar. Clay mineral separation was conducted using the techniques described by Potel et al. (Reference Potel, Maison, Maillet, Sarr, Doublier, Trullenque and Ferreiro Mählmann2016). To minimize the effect of possible detrital clay minerals, we avoided long grinding processes (<30 s) and repeated the settling procedure for the ≤2 μm fraction twice. Quantitative phase analysis based on reference intensity ratio values were performed on randomly oriented whole-rock powders with a step length of 0.5° and a scan speed of 0.014°/s over the range 3–70°2θ for whole-rock compositions. The uncertainty is estimated to be ~5%.
Illite and chlorite indices
Ten samples were collected in the Whakataki fault zone and ten samples were collected in the Adams-Tinui fault zone (Figs 4, 5). Clay mineral separation was conducted using the techniques described by Schmidt et al. (Reference Schmidt, Schmidt, Mullis, Ferreiro Mählmann and Frey1997), following the recommendations of Kisch (Reference Kisch1991), and according to the standard techniques suggested by Ferreiro Mählmann & Frey (Reference Ferreiro Mählmann and Frey2012). For the XRD analyses of the ≤2.0 μm fractions, oriented specimens were prepared and then examined in an air-dried state after solvation with ethylene glycol and after heating (550°C). For air-dried, ethylene glycol-solvated and heated samples, measurements were performed with a scanning step of 0.5° and a speed of 0.01°/s per step over the range 3–35°2θ. The IC was calculated using the software DIFFRACPlus EVAL v. 12.0 (by Bruker AXS). The IC values were standardized using the crystallinity index-standard (CIS) samples of Warr & Rice (Reference Warr and Rice1994) (KICIS = 2.5734 × ICULS – 0.1348). The ICULS is the FWHM value measured at UniLaSalle Beauvais (ULS). The KI is used to define the limits of metamorphic zones, following the recommendations for KI calibration of Ferreiro Mählmann & Frey (Reference Ferreiro Mählmann and Frey2012) and the CIS–KI transformation formalism of Warr & Ferreiro Mählmann (Reference Warr and Ferreiro Mählmann2015). The zone boundary values were chosen as follows: KI = 0.25∆°2θ for the epizone to high anchizone boundary, KI = 0.30∆°2θ for the high to low anchizone boundary and KI = 0.42∆°2θ for the low anchizone to diagenetic zone boundary (Table 1). The same experimental conditions were used to determine chlorite ‘crystallinity’ on the (002) peak, where (ChC(002)) corresponds to the FWHM intensity values of the second (7-Å) basal reflection of chlorite. The ChC(002) measurements were also standardized with the CIS sample set of Warr & Rice (Reference Warr and Rice1994) and expressed as the AI according to the formalism proposed by Guggenheim et al. (Reference Guggenheim, Bain, Bergaya, Brigatti, Drits, Eberl, Formoso, Galán, Merriman, Peacor, Stanjek and Watanabe2002): AI = 1.621 × ChC(002) + 0.006. The anchizone boundaries for the AI were defined by correlation with the KI at 0.30∆°2θ for the epizone to anchizone boundary and 0.35∆°2θ for the anchizone to diagenetic zone boundary. The smallest FWHM possible to measure is 0.08∆°2θ.
Table 1. Metapelitic zone boundaries (after Merriman & Frey, Reference Merriman, Frey, Frey and Robinson1999) for KI and AI values after Warr & Ferreiro Mählmann (Reference Warr and Ferreiro Mählmann2015).

The kaolinite ‘crystallinity’ was measured as the FWHM on the 001 kaolinite peak in the absence of chlorite, following the recommendation of Aparicio and Galán (Reference Aparicio and Galán1999).
Scanning electron microscopy with energy-dispersive X-ray spectroscopy
Chemical compositions of chlorites were analysed and used for chlorite geothermometric determinations. The compositions were determined with an energy-dispersive X-ray (EDX) scanning electron microscope (SEM) (Hitachi S3400N SEM equipped with a Thermo Ultradry EDX probe at ULS). A ZAF-type correction procedure was used for all data reduction and all Fe was assumed to be ferrous. Carbon-coated, polished, thin sections were analysed using a 60-nA beam current, an accelerating voltage of 15 kV, an acquisition time of 30 s and an EDX activation volume of 5 μm3 relative to an average clay size of 10 µm in width.
Chlorite geothermometer
The chlorite geothermometry was carried out using the geothermometer of Bourdelle et al. (Reference Bourdelle, Parra, Chopin and Beyssac2013). This geothermometer is applicable to all low-temperature chlorite compositions (T <350°C; P <4 kbar), but specifically for Si-rich compositions that characterize the diagenetic chlorites encountered in the studied area. To ensure the appropriate composition of chlorites, the chlorite chemistry was determined with the EDX-SEM device using polished, thin sections. From these results, the cationic repartition in the structure is defined, assuming an ordered distribution on the crystal sites, thus determining the ideal activities of end-members. The semi-empirical T = f(log K) geothermometer is formulated as a function of K, the equilibrium constant of the end-member-component reaction describing the chlorite + quartz equilibrium (function as activity) according to Bourdelle et al. (Reference Bourdelle, Parra, Chopin and Beyssac2013; see equation 1):
 $$T(^\circ {\rm C}) = \displaystyle{{9400} \over {23.40{\rm -}\log x}}{\rm -}273$$
 $${\rm where}\quad x = \displaystyle {\lpar {a_{Mg{\hbox -}Am}^3}\rpar \over {\lpar {a_{Mg{\hbox -}ChlS}} \rpar \lpar {a_{Mg{\hbox -}Sud}^3} \rpar }}$$
and Mg-Am = Mg-amesite, Mg-ChlS = Mg-chlorite semi-ordered and Mg-Sud = Mg-sudoite.
Vitrinite reflectance
The chemical kinetics that governs maturation is still thought to be strongly temperature dependent (e.g. Taylor et al., Reference Taylor, Teichmüller, Davies, Diessel, Littke and Robert1998; Polissar et al., Reference Polissar, Savage and Brodsky2011). In addition to vitrinite reflectance (VR) (Le Bayon et al., Reference Le Bayon, Brey, Ernst and Ferreiro Mählmann2011), other optical properties of organic matter are pressure dependent (as for vitrinite; see e.g. Chandra, Reference Chandra1965; Dalla Torre et al., Reference Dalla Torre, Ferreiro Mählmann and Ernst1997). The recognition of characteristic optical changes has been used recently to predict various pressure conditions (Ferreiro Mählmann & Le Bayon, Reference Ferreiro Mählmann and Le Bayon2016). The VR determinations were made on a Leitz microscope (Ortholux 2 POL BK) with a 125× oil-immersion objective (10× oculars) using monochromatic polarized light (546 nm) and a Leitz MPV photomultiplier at the Technische Universität Darmstadt. In all cases, the minimum reflectance (R min%) and maximum reflectance (R max%) of vitrinite were determined if bireflectance was observed. In most cases, bireflectance was not developed and thus random reflectance (R r%) was used. Different temperature–pressure–thermal gradient conditions can be recognized using the first appearance of bireflectance with increasing maturity (Ferreiro Mählmann & Le Bayon, Reference Ferreiro Mählmann and Le Bayon2016). The photomultiplier is used to measure the reflectance intensity, which is determined through comparison with standards of known reflectance (yttrium aluminium garnet single crystal for the range of VR = 0.2–2.0%; gallium gadolinium garnet single crystal for the range of VR = 1.0–3.0%).
RESULTS
The mineralogy of the samples studied is given in Table 2. Mineral abbreviations follow Kretz (Reference Kretz1983). The Whakataki samples consist of quartz (Qtz) and feldspar (Fsp) and/or calcite (Cal) and clay minerals. In the <2 μm size fractions, illite-muscovite predominates in association with montmorillonite (Mt) and/or kaolinite (Kln) and/or vermiculite (V). The Adams-Tinui samples consist of quartz (Qtz) with clay minerals and/or feldspar (Fsp) with calcite (Cal) and gypsum (Gp) and sporadic chabazite, especially in sample 16-FP-35 from near the western fault plane. In the <2 μm grain fraction, illite-muscovite predominates in association with kaolinite (Kln) and/or montmorillonite (Mt) and/or vermiculite (V) and/or chlorite (Chl) (Fig. 6). Chlorite is present in the Eocene and Torlesse rocks (Early Cretaceous).
Fig. 6. SEM images of the phyllosilicates: (a) neoformed K-white micas (sample 16-FP-13); (b) detrital K-white micas (sample 16-FP-18); (c) chlorite (sample 16-FP-37).
Table 2. Clay mineralogy and clay mineral index data of studied samples from the Whakataki and Adams-Tinui faults (expressed in percentages) and the FWHM of the (001) illite/muscovite reflection and (002) chlorite reflection and their values after calibration in KI and AI, respectively. For the locations of the samples, see Fig. 3.
Key to the abbreviations (from Kretz, Reference Kretz1983): Qtz = quartz; Fsp = feldspar; Cal = calcite; Gp = gypsum; Cbz = chabazite; Mt = montmorillonite; V = vermiculite; Kln = kaolinite; I = illite; Ms = muscovite; Chl = chlorite; Eo = Eocene; EMio = Early Miocene; LCr = Late Cretaceous (Whangai); ECr = Early Cretaceous (Torlesse).
FWHM characteristics of the phyllosilicates
The KI and AI were calculated from the FWHM of illite-muscovite and chlorite peaks on the air-dried XRD traces, respectively. The KI and AI values are listed in Table 2 and the spatial distributions of samples are shown in Fig. 3.
In the Whakataki fault, KI values range from 0.68Δ°2θ to 0.39Δ°2θ, corresponding to diagenesis to lower anchizone. In the Adams-Tinui fault, the KI shows a broader range of values between 0.92Δ°2θ and 0.40Δ°2θ, indicative of diagenesis to lower anchizone. Due to the broadening of the peak and the overlapping with other phases, the KI was not calculated for samples 16-FP-11 and 16-FP-16. The KI values are higher in older formations (Early Cretaceous) than in younger formations (Early Miocene, Eocene and Late Cretaceous).
AI values were only determined for samples 16-FP-36, 16-FP-37 and 16-FP-38, where the chlorite content and peak allowed the calculation of this parameter. AI values in the Adams-Tinui fault had an average of 0.45Δ°2θ, corresponding to diagenesis.
Kaolinite ‘crystallinity’ was determined from the air-dried diffractogram (Table 2, Fig. 7), with values ranging from 0.26 and 0.51Δ°2θ.
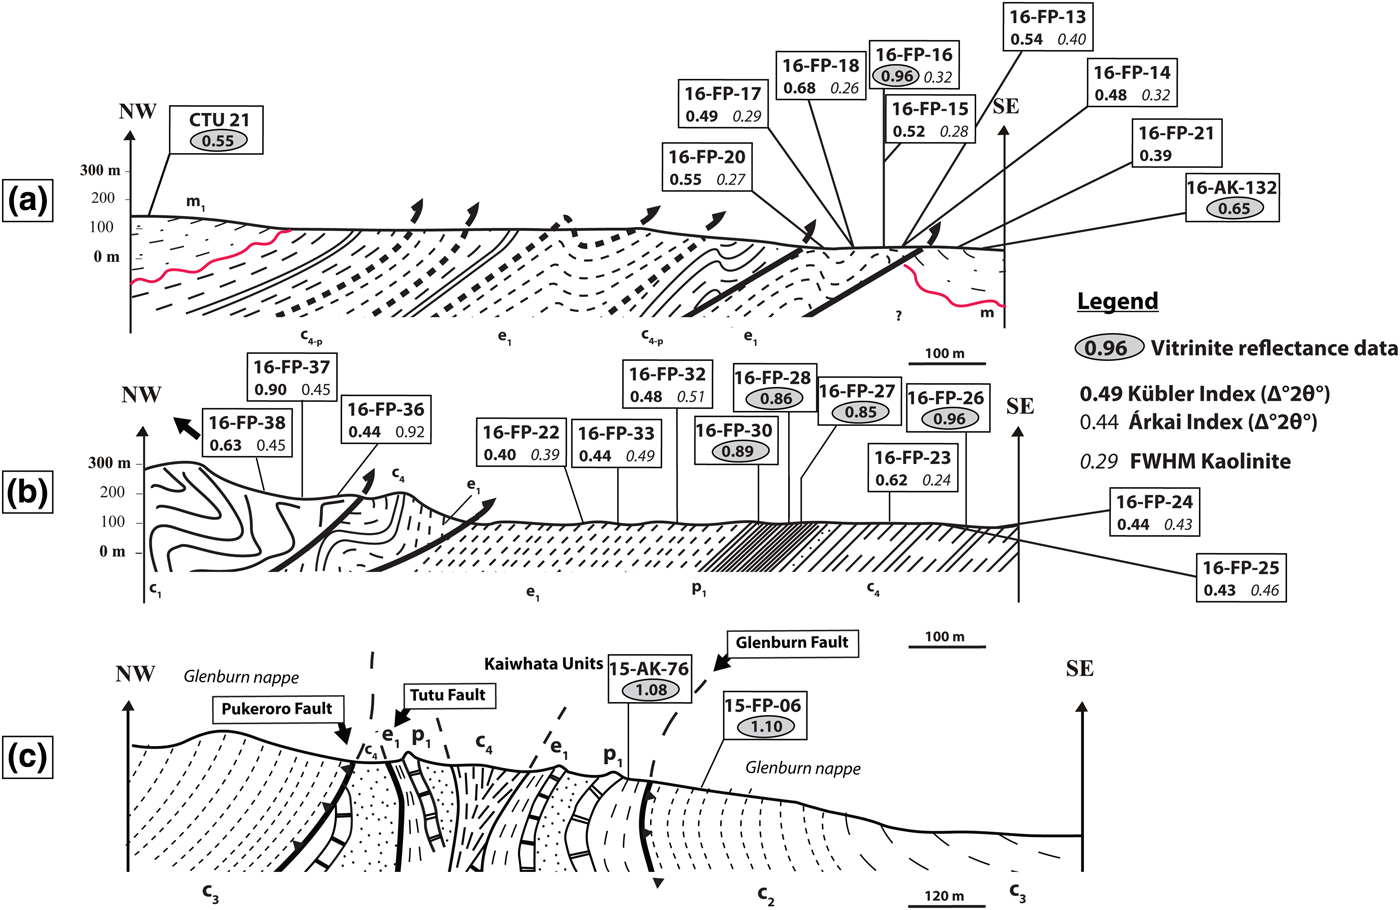
Fig. 7. Locations of the samples used in this study and the cross-sections. (a) Cross-section of the Whakataki fault in the Flat Point area. (b) Cross-section of the Adams-Tinui fault in the Te Wharau area. (c) Cross-section through the Kaiwhata units (Chanier & Ferrière, Reference Chanier and Ferrière1989) showing the structural complexity of this area.
Phyllosilicate chemistry
Due to the small grain size of the phyllosilicates (<10 µm), special care was taken to differentiate between detrital and newly formed metamorphic grains to avoid minerals of uncertain origin. Neoformed K-white mica may be observed as fine-grained laths (<1 µm wide) (Fig. 6a), whereas detrital K-white micas (not measured) are observed as coarser and kinked grains (between 5 and 10 µm wide) (Fig. 6b). Chlorite grains are present as aggregates of fibrous chlorite, with no evidence of detrital flakes (Fig. 6c).
Representative compositions of K-white mica are listed in Table 3. In a Si–Altot diagram (Fig. 8a), the analyses show a significant deviation from the Tschermak exchange line, with a large Si content. In addition to the Tschermak substitution (substitution of Si by Al), other substitutions or contaminations can be assumed. In Fig. 8b, on the basis of model calculations assuming various mixtures, a contamination of the analyses of mica by quartz can be assumed in certain samples, probably due to the small grain size (<10 µm) and the instability of the mica under the electron beam.

Fig. 8. (a–c) Compositional relationships of metamorphic dioctahedral white micas. Cation numbers and ratios were calculated from EDX analyses.
Table 3. Representative chemical analyses of K-white micas based on 11 oxygen atoms.

Calculations are based on 11 oxygen atoms (anhydrous basis).
b 0 values calculated after Guidotti et al. (Reference Guidotti, Sassi and Blencoe1989).
t.i.c. = total interlayer cations (Ca + Na + K).
In Fig. 8c, the K-white mica analyses fall in a cluster between the muscovite–phengite and the muscovite–illite lines, indicating a small deficit in total interlayer cations (values range between 0.60 and 0.98 per formula unit [p.f.u.]; Table 3).
Minor chlorite was detected and analysed in samples 16FP17, 16FP32 and 16FP33, although it was not identified in XRD analyses, probably due to the detection limit of the technique. Compositions of chlorite (Table 4) fulfil the criterion of non-contamination (∑Ca + Na + K < 0.2; Dalla Torre et al., Reference Dalla Torre, Livi and Frey1996). Using the classification of Zane & Weiss (Reference Zane and Weiss1998), chlorites in the studied samples are mostly trioctahedral type I, where X Mg + X Fe ≥ X Al + X vacancy. The AlVI–Fe–(Mg + Mn) diagram revealed intermediate compositions between chamosite clinochlore and sudoite (Fig. 9a). X Mg varies between 0.25 and 0.70.
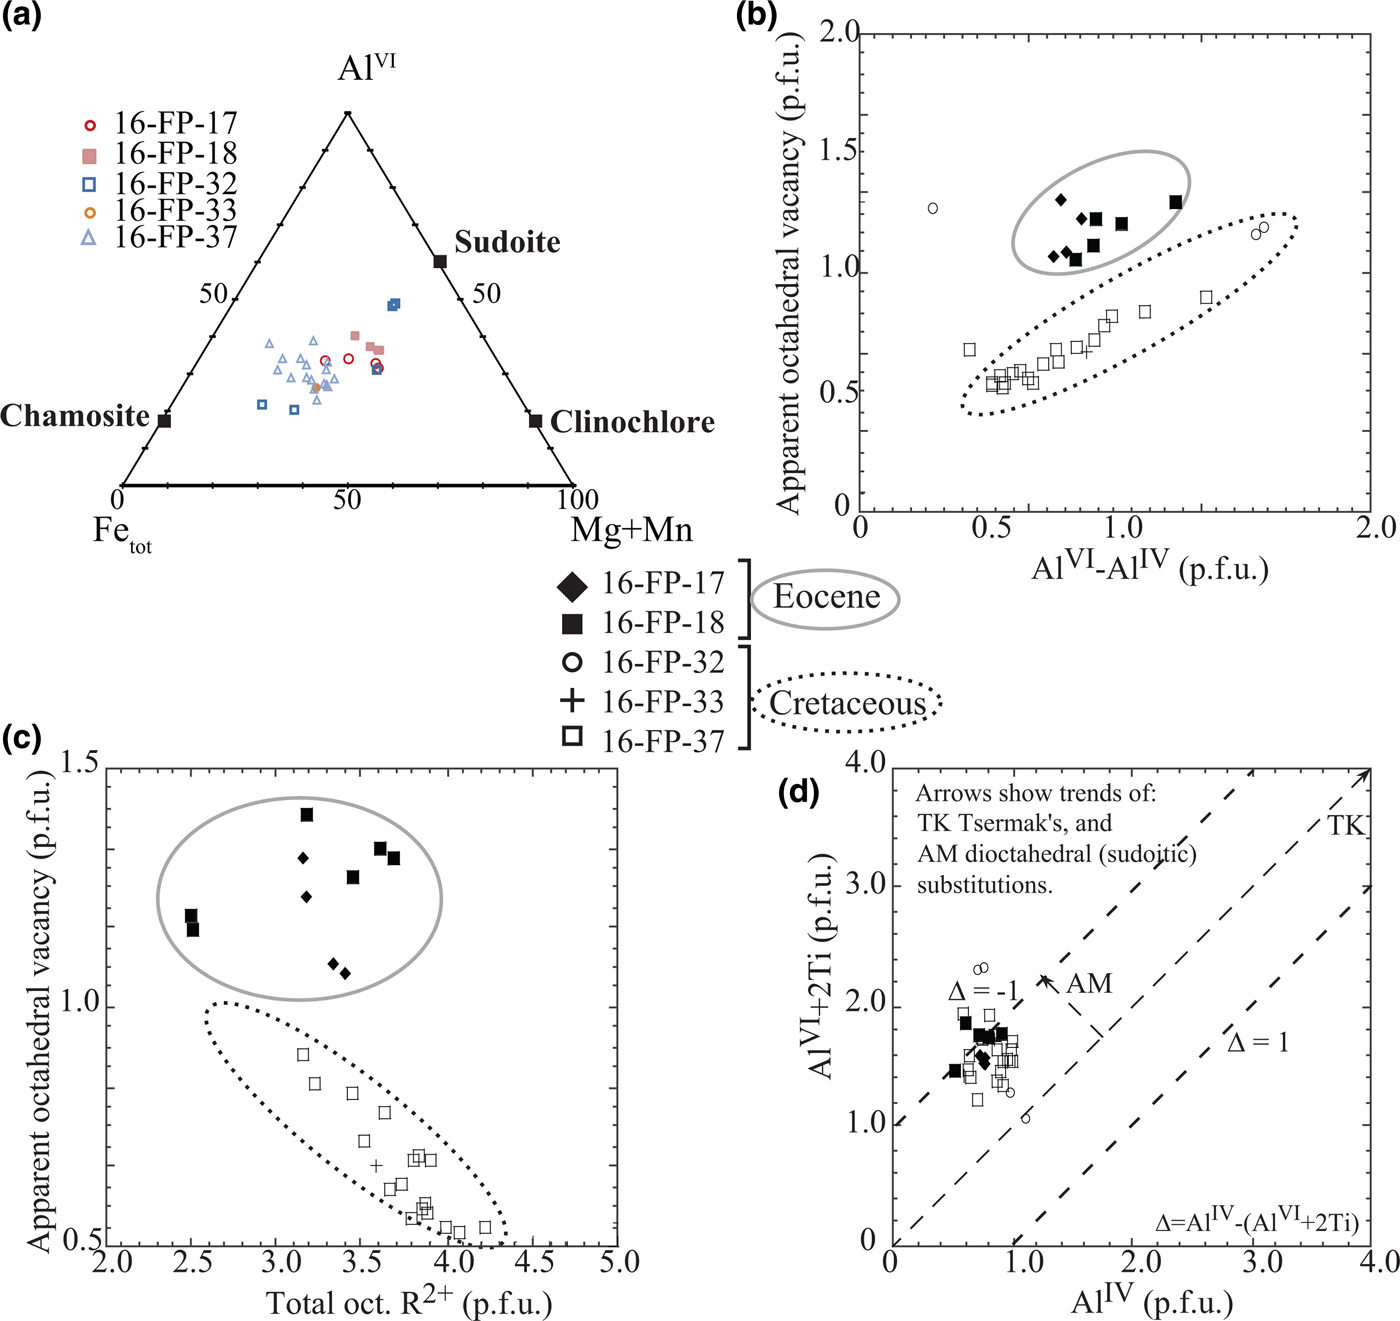
Fig. 9. Compositional variation of chlorite. Cation numbers and ratios are calculated from EDX analyses. (a) Fetot–(Mg + Mn)–AlVI diagram of chlorite; the end-members chamosite, clinochlore and sudoite are indicated. (b) Apparent octahedral vacancy (= 10−∑octahedral cations p.f.u.) vs. AlVI – AlIV. (c) Apparent octahedral vacancy vs. total octahedral. R2+ (= Fe2+ + Mg2+). (d) AlVI + 2Ti vs. AlIV. Arrows show trends of Tschermak (TK) and dioctahedral (AM) substitutions, where ∆ = AlIV – (AlVI + 2Ti).
Table 4. Representative structural formulae of chlorite based on 14 oxygen atoms.

Calculations are based on 14 oxygen atoms (anhydrous basis).
aTemperatures are calculated using the geothermometer from Bourdelle et al. (Reference Bourdelle, Parra, Chopin and Beyssac2013).
The low total interlayer charge of the chlorite (<0.2 p.f.u.) indicates that smectite or illite impurities are negligible. The increase of (AlVI – AlIV) might be attributed to increasing sudoitic substitution (di-trioctahedral) (Árkai et al., Reference Árkai, Faryad, Vidal and Balogh2003), as is also indicated by the trend of the chlorite composition in Fig. 8a towards a sudoitic composition. Correlations observed for apparent octahedral vacancies with (AlVI – AlIV) (Fig. 9b) and apparent octahedral vacancies with the sum of octahedral divalent cations (Fig. 9c) prove the presence of sudoitic substitution in the analysed chlorites. In Fig. 9b,c, two groups of chlorites can be distinguished as a function of sample age (Cretaceous and Eocene). Fig. 9d demonstrates that, in addition to the Tschermak substitution, the di-trioctahedral substitution plays an important role in chlorites.
Vitrinite reflectance
The VR data from the Whakataki and Adams-Tinui faults are listed in Table 5. The VR obtained in the Whakataki fault (in Eocene sample 16-FP-16) shows a mean value of 0.96 R r%. However, both samples (CTU21 in the Whareama syncline and 16-AK-132) coming from Miocene formations show smaller values (VR = 0.55 R r% for CTU21 and VR = 0.65 R r% for 16-AK-132). The VR obtained in the Adams-Tinui fault shows a value of 0.96 R r% for the Late Cretaceous (Whangai) and a mean value of 0.87 R r% for the Palaeocene formation. However, in the Glenburn nappe (VR = 1.08 R r% for 15-AK-76 and VR = 1.1 R r% for 15-FP-06) and in the Kaiwhata unit (VR = 1.3 R r% for 15-FP-07), the values are higher than in the fault zone. All of the samples analysed in this study do not show bireflectance due to low maturity.
Table 5. VR data for samples inside and outside of the fault zones. Columns 1 and 2: Sample number and ages. Column 3: VR = mean vitrinite reflectance value Rr%. Column 4: n = number of measured vitrinite particles. Row 5: standard deviation.

DISCUSSION
For both the Whakataki and the Adams-Tinui fault zones, there is no relationship between stratigraphic age and KI value (Table 2, Fig. 10a). However, the highest diagenetic grade interpreted by KI value (AI values are only sporadically present) are observed in the older formation (Early Cretaceous) affected by the Adams-Tinui fault (Table 2). The KI values are not related directly to the sample location in the fault zone (Fig. 4). In contrast, a trend may be observed in the kaolinite ‘crystallinity’ values in the Adams-Tinui and Whakataki faults (Fig. 7). In the Whakataki fault, the values increase towards the fault, varying from 0.27 to 0.40Δ°2θ close to the fault. Previous work has shown that the increase in deformation close to the fault, where tectonic strain proceeds faster than recrystallization, favours a reduction in phyllosilicate crystal size (Giorgetti et al., Reference Giorgetti, Memmi and Peacor2000; Abad et al., Reference Abad, Gutiérrez-Alonso, Nieto, Gertner, Becker and Cabero2003a). Hence, the kaolinite ‘crystallinity’ values follow this trend. In this study, most of the KI values are typical of the diagenetic zone, except for the KI values from the Early Miocene sample of the Whakataki fault zone (16-FP-21) and the Eocene sample (16-FP-22) of the Adams-Tinui fault sharing anchizone values. The presence of chabazite in sample 16-FP-35, the existence of kaolinite (Kln), montmorillonite (Mt), vermiculite (V) and illite-smectite (I-Sm) and the occurrence of microscopic glauconite in many samples confirm the low diagenetic grade, although the KI was not measured in the samples from the Whakataki fault zone. Chabazite crystallizes at 50–100°C (Deer et al., Reference Deer, Howie and Zussman2013), which corresponds to the temperature range of diagenesis (0–230 ± 30°C; Ferreiro Mählmann & Le Bayon, Reference Ferreiro Mählmann and Le Bayon2016; Mullis et al., Reference Mullis, Ferreiro Mählmann and Wolf2017).
Fig. 10. (a) Correlation between KI values and stratigraphic ages. (b) Correlation between KI values and temperature determined in the same samples using the chlorite geothermometer of Bourdelle et al. (Reference Bourdelle, Parra, Chopin and Beyssac2013).
Although the KI is a useful index for showing gradual changes in grade of metamorphism, it should not be used as a precise geothermometer, as it provides temperature ranges (Frey, Reference Frey1987; Doublier et al., Reference Doublier, Roache, Potel and Laukamp2012). The temperature estimates for the KI diagenesis–anchizone transition, based on comparison with other geothermometers, range between 180°C and 250°C (Merriman & Frey, Reference Merriman, Frey, Frey and Robinson1999; Potel et al., Reference Potel, Ferreiro Mählmann, Stern, Mullis and Frey2006). The VR results (Table 5) and the occurrence of chabazite (Table 2) suggest temperatures below 180°C and 250°C due to the KI values (Table 2).
To better constrain the diagenetic grade, we calculated additional temperatures in the samples using the chlorite geothermometric method of Bourdelle et al. (Reference Bourdelle, Parra, Chopin and Beyssac2013). Samples analysed are from the Eocene of the Whakataki fault and from the Cretaceous of the Adams-Tinui fault. The chlorites analysed were selected as neoformed minerals according to their crystal habit. Taking into account the range of standard deviation, including the simplification of assuming Fe to be ferrous (Bourdelle et al., Reference Bourdelle, Parra, Chopin and Beyssac2013), the estimated temperature was in the range of 80–120°C. These results are compatible with grade of maturity of the organic matter (Table 5) and the temperature stability range of chabazite. Those calculated temperatures show a positive correlation with the KI values of the same samples (Fig. 10b). This pattern seems to reflect a lack of equilibrium of illite-muscovite with chlorite.
Vitrinite reflectance values <1.3 R r% (±0.15 R r%) correspond to temperatures of <100°C with a mean temperature uncertainty of ±30°C for various geothermal gradients (Ferreiro Mählmann & Le Bayon, Reference Ferreiro Mählmann and Le Bayon2016). The VR results of this study vary between 0.85 and 0.96 R r% for the Adams-Tinui fault and between 0.65 and 0.96 R r% for the Whakataki fault and reveal low-grade diagenetic zone conditions. Therefore, temperatures might be <100°C in both faults. Temperature estimation using the equation of Bourdelle et al. (Reference Bourdelle, Parra, Chopin and Beyssac2013) yielded temperatures between 98°C (±2°C) and 57°C (±17°C). Using the basin maturity chart given by Merriman & Frey (Reference Merriman, Frey, Frey and Robinson1999) or by Ferreiro Mählmann et al. (Reference Ferreiro Mählmann, Botzkaya, Potel, Le Bayon, Šegvić and Nieto García2012), such values should correlate with KI values >0.60Δ°2θ. Nevertheless, the calculated KI values are <0.60Δ°2θ, except for Early Cretaceous samples of the Adams-Tinui fault (Table 2).
Although all data indicate diagenesis conditions, some differences may be noticed between the various methods. A correlation appears between the temperatures calculated with chlorite geothermometry and the VR values (Fig. 9). However, the KI values do not follow the expected trend. As mentioned before, the KI values are too low, indicating higher temperatures compared to the other analytical methods. In addition, a positive correlation is observed between clay mineral paragenesis, calculated temperature and KI values. Furthermore, the correlation between KI and VR should be negative (see Ferreiro Mählmann et al., Reference Ferreiro Mählmann, Botzkaya, Potel, Le Bayon, Šegvić and Nieto García2012, and references therein). Here, the positive slope is the opposite of the relation proposed by Ferreiro Mählmann et al. (Reference Ferreiro Mählmann, Botzkaya, Potel, Le Bayon, Šegvić and Nieto García2012) and Ferreiro Mählmann & Le Bayon (Reference Ferreiro Mählmann and Le Bayon2016) depending on the P–T–t–D (pressure–temperature–time–deformation) history and fluid activity. Only samples from the Early Cretaceous show coherent results for all the indicators used. Various relations correlate with KI indicating higher-grade diagenesis with immature VR and bituminite reflectance (BR) and low temperatures. Using the KI/VR plot of Ferreiro Mählmann & Giger (Reference Ferreiro Mählmann and Giger2012), the KI values 0.39–0.55Δ°2θ of the Whakataki fault (Table 2) fall in the data triangle of correlation values controlled by detrital mica. The presence of detrital minerals was confirmed in thin sections, where sericitic and hydro-biotite detrital flakes, rounded detrital feldspar and some opaque minerals were observed. The <2 μm fraction of samples in formations younger than the Early Cretaceous contain detrital components that are not re-equilibrated (i.e. contaminated by detrital clay minerals). Therefore, detailed clay mineralogical work based on the study of variously sized fractions would enable the distinction between detrital components (usually the coarser-grained fraction) and authigenic components (the finest-grained fraction). The neoformation of clay minerals is a slower process than the grain size reduction associated with deformation in the fault zone, causing a reduction in clay ‘crystallinity’ values (Giorgetti et al., Reference Giorgetti, Memmi and Peacor2000; Abad et al., Reference Abad, Nieto and Gutiérrez-Alonso2003b). Only in the Early Cretaceous samples has sufficient time elapsed to allow almost complete recrystallization of clay minerals and the establishment of an equilibrium with neoformed minerals. In contrast, the temperature obtained for chlorite is interpreted as resulting from neoformed chlorite in Eocene and Torlesse formations (Early Cretaceous), and is thus contemporaneous to the maturation rank of organic matter. Warr & Cox (Reference Warr and Cox2016) outlined that the evolution of clay ‘crystallinity’ is a function of the activities of K+, Fe2+ and Mg2+ in the metamorphic pore fluid. The illitization and eventual muscovite formation are reactions influenced by the reactivity of K+ (Huang et al., Reference Huang, Longo and Pevear1993), whereas the chloritization process is more dependent on the reactivity of Mg2+ and Fe2+ (Jahren & Aagaard, Reference Jahren and Aagaard1989). In the studied area, the activity of K+ should be low compared with the activities of Mg2+ and Fe2+, favouring the formation and growth of neoformed chlorite, whereas growth of illite is slower, enabling the alteration of KI values due to detrital illite.
The KI values are broader than those expected according to the other methods used. The KI measured from most samples might not be related to increasing diagenetic grade. In samples from low-grade diagenetic zones, detrital illite predominates and has influenced the mean of the bulk population measured using the KI. Recrystallization of detrital mica and neoformation of illite are slow and in competition with tectonic strain.
The relationship between KI and VR seems to establish coherently the same diagenetic grade only in the Early Cretaceous samples. These samples experienced long-lasting and deep burial; thus, the reaction progress for illite approached steady-state conditions at peak diagenetic pressures (burial and tectonic load) and temperatures. In younger formations, the low peak burial grade within the subduction wedge did not allow re-equilibration (recrystallization) of illite derived from a source of a higher metamorphic grade in the hinterland, and neoformation of illite did not advance. However, even if illite was not at equilibrium, the effect of physical grinding during tectonic activity might be observed via the decrease of KI values close to the main faults (e.g. along the Adams-Tinui fault; Fig. 7). A study of various fraction sizes might help to determine the occurrence of inherited illite by determining the IC values of detrital and neoformed clay minerals. This would help to explain the low KI values observed in the samples. This phenomenon might also hold for kaolinite ‘crystallinity’ (Fig. 7).
A strong correlation exists between the temperatures determined by chlorite geothermometry and temperatures deduced from VR values. No variation was observed in the fault zones; the higher temperatures were observed in the older formation (Table 4, Fig. 7). In chlorites, the activities of K+, Mg2+ and Fe2+ might play a role in the neoformation and re-equilibration of clays (Warr & Cox, Reference Warr and Cox2016). In the Hikurangi prism, the chlorite geothermometer of Bourdelle et al. (Reference Bourdelle, Parra, Chopin and Beyssac2013) provides more reliable temperature measures than the temperatures estimated via KI values. The occurrence of kaolinite in the samples confirms the diagenetic grade. The disappearance of kaolinite occurs before the diagenetic zone–anchizone boundary due to illitization and chloritization, unless the environment is Al-rich. However, it may persist in carbonate rocks, sedimentary rocks rich in organic matter or volcaniclastic rocks with R r values of 1.3 ± 0.15% (Kisch, Reference Kisch and Frey1987; Ferreiro Mählmann, Reference Ferreiro Mählmann2001). Kaolinitization of detrital plagioclase, orthoclase and mica in a Ca-rich environment enhanced by de-carbonatization of plagioclase and illitization (sericitization) of K/Na-feldspars leads to significant potential for the kaolinite formation that is typical in low-grade diagenesis, which progressively disappears in high-grade diagenesis. This is compatible with the migration of oil observed in the rocks in the oil-window (mature zone).
CONCLUSION
The low-grade diagenetic gradual evolution of clay minerals and the maturity of organic matter in the Whakataki and Adams-Tinui fault zones have been studied, combined with the evolution of the KI and the determination of temperatures using the chlorite geothermometer of Bourdelle et al. (Reference Bourdelle, Parra, Chopin and Beyssac2013). The resulting temperatures were compared with T (°C)–KI–VR correlations presented in the literature. Various evolutions of the organic and mineralogical parameters were observed in the fault zones.
It was shown that:
(1) The thermal burial grade is of the high-grade diagenetic zone (KI = 1.0 ± 0.15Δ°2θ), corresponding to VR = 1.3 ± 0.15% (high-volatility bituminous/medium-volatility bituminous coal), with a temperature of ~100°C.
(2) The physical grinding of minerals during tectonic activity with increases of deformation close to the fault, where tectonic strain proceeds faster than recrystallization, reduced phyllosilicate crystal size, thereby reducing clay ‘crystallinity’ values for illite and kaolinite.
(3) Burial time was important for the equilibrium of clays (chemical and structural homogeneity) in the low-grade diagenetic zone, where inherited structures and the chemistry of detrital phases predominated, specifically in subduction wedges.
(4) Rocks from a subduction wedge in close proximity to a metasedimentary hinterland are inappropriate for the sampling and use of KI to determine grade of diagenesis if there exists little difference between the sediments and their source.
ACKNOWLEDGEMENTS
UniLaSalle Beauvais is thanked for its financial support of the PhD thesis of P. Malié (2014–2017) on the project. The manuscript has benefited greatly from thoughtful review from two anonymous reviewers. A. Schleicher and G. Christidis are also thanked for their management as editors of the article.


