Kaolin is a valuable industrial clay with a large variety of applications. In its raw form kaolin has limited applications, mainly as a raw material for various types of ceramic products or as a white pigment for decoration and painting. More technically demanding applications (ceramics, functional filler in paper, plastics, amongst others) require thoroughly refined and selectively processed mineral products. Markets for these end-product applications usually exist in industrialized economies, where the added value of the final mineral products is also of major concern.
In less-developed or non-industrialized economies, kaolin mining and processing is limited, primarily due to a lack of substantial local manufacturing industries and respective markets for refined kaolin mineral products. This is the case in Africa. Although >250 kaolin occurrences are known on the continent (Ekosse, Reference Ekosse2010), exploitation on a greater scale is restricted to the Republic of South Africa and Egypt. Small-scale operations in countries such as Algeria, Botswana, Ethiopia, Nigeria and Tanzania, among others, are directed mainly at the production of bricks and ceramics (Ekosse, Reference Ekosse2010).
Incentives to invest in kaolin exploration, mining and processing in Africa are rather restricted due to the lack of markets for added-value products. The value-adding potential of kaolin extraction and refinement can, however, also be seen as a stimulus for local economic development in less-developed countries (Ekosse, Reference Ekosse2010). In such countries, exploration of kaolin occurrences and the evaluation of the mineralogical and technical properties of kaolin raw materials are mainly undertaken by public organizations (i.e. geological surveys), especially during the first stages of exploration. Within this framework, the present study was undertaken during a project on mining-sector diversification in Mauritania, jointly carried out by Bundesanstalt für Geowissenschaften und Rohstoffe (BGR) and Office Mauritanien de Recherches Géologiques (OMRG) (now Agence Nationale de Recherches Géologiques et du Patrimoine Minier (ANARPAM)).
Geological features of kaolin deposits with reference to western Africa
Kaolins may be either of primary (residual, hydrothermal, mixed) or of secondary (sedimentary) origin (Harvey & Murray, Reference Harvey and Murray1997). A more detailed classification is provided by Dill (Reference Dill2016). In this paper, however, classification is based on Harvey & Murray (Reference Harvey and Murray1997) because of insufficient geological data. Primary kaolins form in situ through weathering and/or hydrothermal alteration of feldspathic rocks such as granites and arkoses. Secondary kaolins are derived from the erosion and transport of weathered materials away from their source area, combined with size fractionation during transport and eventual (re)deposition as clastic kaolinite-rich sediments. Some of the most economically important secondary kaolins were further altered after deposition in groundwater environments by microbially mediated processes that naturally removed iron-bearing accessory minerals (Hurst & Pickering, Reference Hurst and Pickering1997).
In Africa, kaolin outcrops occur in almost every country, with a relatively large number of deposits known to occur in the southern, western and west-central parts of the continent (Ekosse, Reference Ekosse2010). Approximately 50% of all kaolin occurrences in Africa are secondary sedimentary and 35% are primary of residual origin. The remaining 15% are classified as mixed or hydrothermal. Known primary kaolin occurrences are located mainly in southern and central Africa (Harvey & Murray, Reference Harvey and Murray1997; Murray, Reference Murray and Bailey1998; Njoya et al., Reference Njoya, Nkoumbou, Grosbois, Njopwouo, Njoya and Courtin-Nomade2006; Ekosse, Reference Ekosse2010). Secondary kaolins occur mostly in northern Africa, but some significant deposits have also been reported in southern and western Africa (Ekosse, Reference Ekosse2010). Deposits with a hydrothermal origin are mostly located in central and western Africa (e.g. Njoya et al., Reference Njoya, Nkoumbou, Grosbois, Njopwouo, Njoya and Courtin-Nomade2006; Ekosse, Reference Ekosse2010).
Worldwide, most of the sedimentary kaolins occur geologically in Cretaceous and Tertiary strata (Murray, Reference Murray and Bailey1998). Among them, the largest and purest kaolins are the fluvial and nearshore marine Coastal Plain deposits in the south-eastern USA and the fluvial and lacustrine deposits in northern Para State, Brazil (Kogel, Reference Kogel2014). The accumulation of Cretaceous and Tertiary sediments and their depositional environments are generally shared between the eastern coast of the Americas and the western coast of Africa. This reflects their similar geological histories during the breakup of the Pangea supercontinent and the opening of the Atlantic Ocean in the Mesozoic. The occurrence of kaolin deposits in western Africa may therefore be temporally and genetically associated with extensive kaolin deposits in the south-eastern USA (Georgia, Alabama) and in Brazil (Ekosse, Reference Ekosse2010). This may also serve as a clue for the exploration of presently unknown deposits in West Africa, including Mauritania.
Mauritanian kaolin occurrences and their geological setting
To date, Mauritania has not been reported to have substantial deposits of kaolin. In the compilation of African kaolin deposits by Ekosse (Reference Ekosse2010), only one occurrence is referred to in Mauritania, namely Akjoujt in west-central Mauritania, possibly of hydrothermal origin. Unpublished reports and notes from the OMRG (now ANARPAM), however, indicate the occurrence of more widespread kaolin outcrops in the southern part of the country, probably related to late Cretaceous and Tertiary episodes of weathering (Pitfield et al., Reference Pitfield, Key, Waters, Hawkins, Schofield, Loughlin and Barnes2004), followed by erosion and deposition in terrestrial to coastal sedimentary basins. None of these kaolin outcrops has ever been studied and evaluated in detail, with the exception of analytical data on a single sample from the Kaédi area (Baudet et al., Reference Baudet, Baron and Hergibo1987). Therefore, the aim of this study is to characterize mineralogically and geochemically kaolin outcrops in three regions in southern Mauritania, namely Kaédi, Hassi Abyad and Néma (see Fig. 1), which have not been investigated before. The final aim of this study is to evaluate the possible applications of the various raw materials, which has to be based on in-depth characterization and (ceramic) application tests.
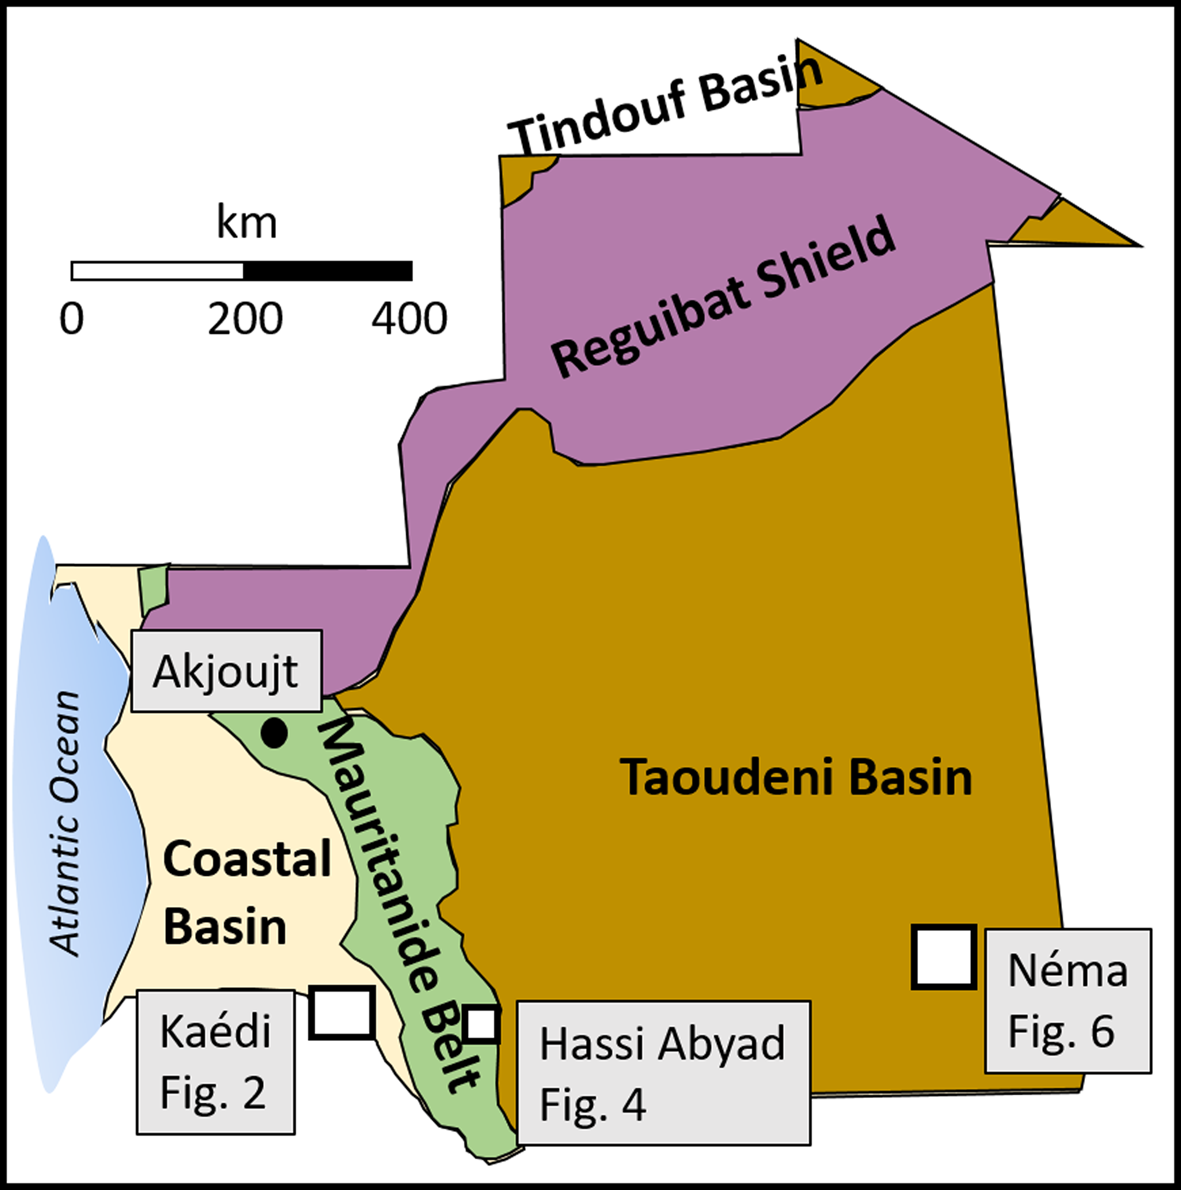
Fig. 1. General geological map of Mauritania indicating the locations of the kaolin occurrences investigated (Kaédi, Hassi Abyad and Néma regions) and of another known kaolin deposit (Akjoujt). The latter was not studied in this paper. Map modified after Langer & Horton (Reference Langer and Horton2012).
Location and regional geology
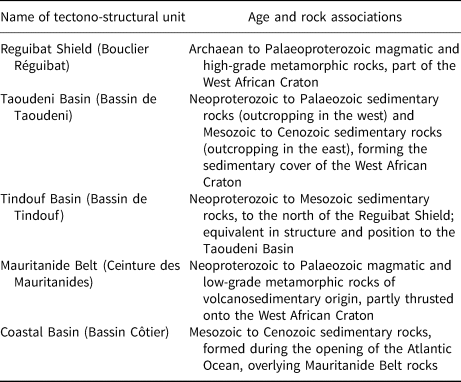
Mauritanian geology is characterized by five major tectono-structural units (Fig. 1 & Table 1). The kaolins in the Néma region (south-eastern Mauritania) occur in the Taoudeni Basin, the kaolins of the Hassi Abyad region (south-central Mauritania) occur in the Mauritanide Belt and the kaolins from the Kaédi region (south-western Mauritania) occur in the Coastal Basin (see Fig. 1). More detailed descriptions of the kaolin occurrences are given below.
Table 1. Geological units of Mauritania (OMRG, 2015).

Kaédi region, Coastal Basin
In south-western Mauritania, kaolins occur west of Kaédi and geologically belong to the Miocene Mbidane Formation (Continental Terminal) of the Coastal Basin (Fig. 2). Six outcrops were sampled at the base or along the flanks of escarpments or small inselbergs, exposing the Mbidane Formation around Bababé, Fondé, Bagodine and Rindiao (see Fig. 2).
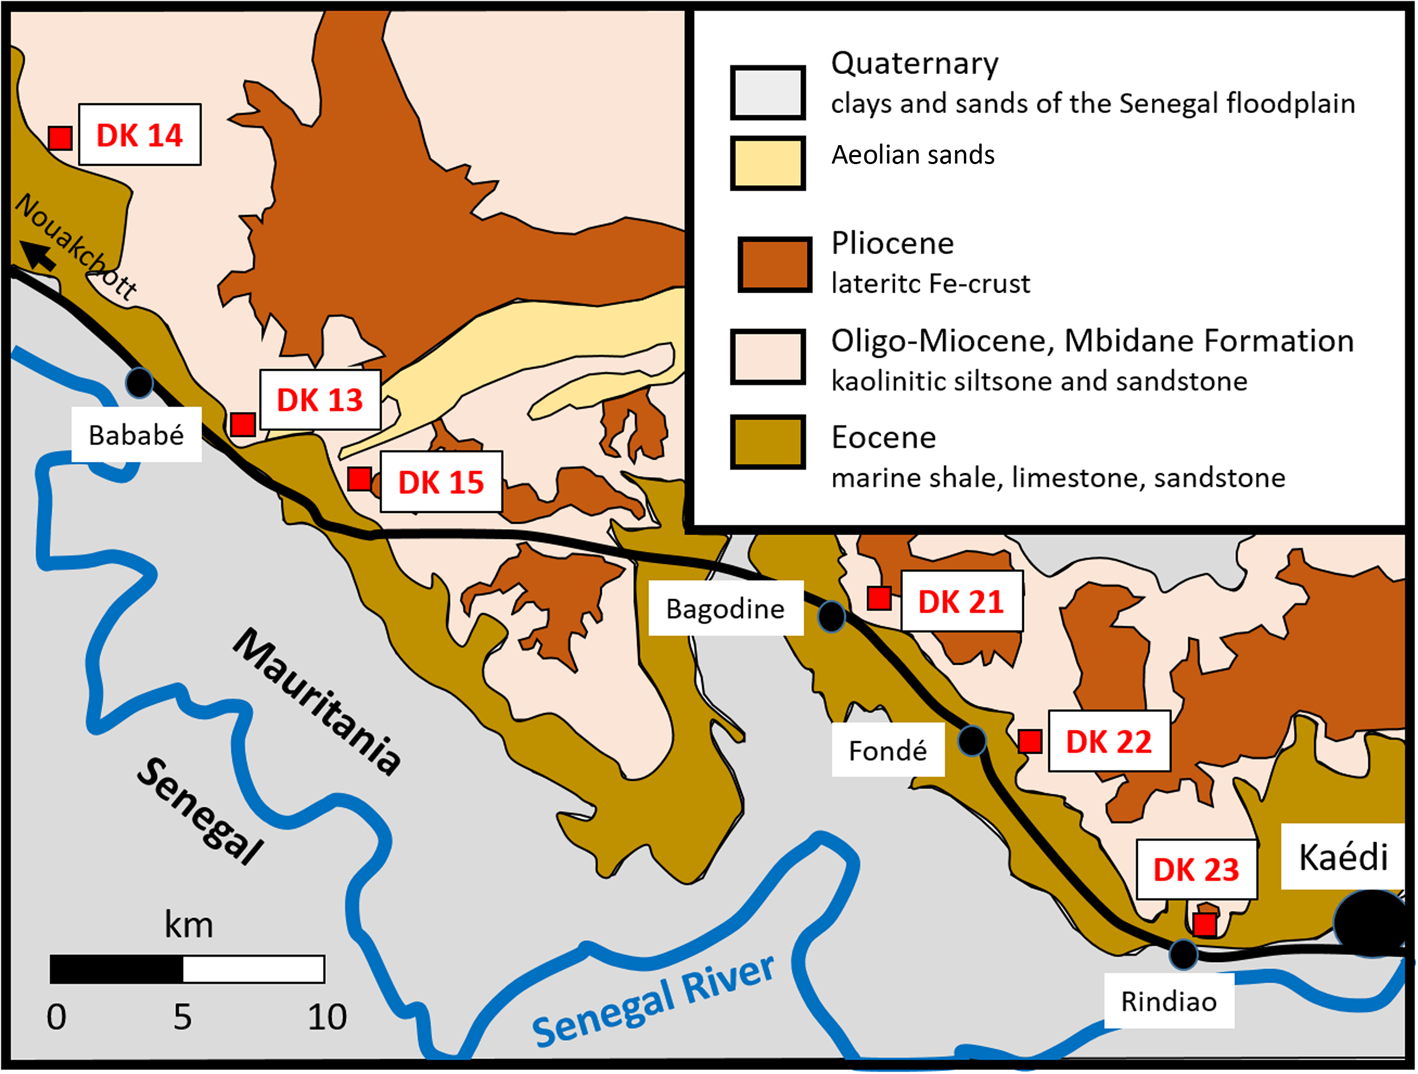
Fig. 2. Geological sketch map showing the locations of the kaolin samples to the west of Kaédi.
The Mbidane Formation is composed of terrestrial to shallow-marine clastic sedimentary deposits that have undergone intense lateritization. Kaolin-rich layers 1–5 m thick occur within sedimentary successions consisting mainly of kaolinitic/kaolinized siltstones and sandstones (Limam et al., Reference Limam, Ba, Mohamed and Kuester2017). The succession is capped by lateritic iron crust (Fig. 3). The kaolin occurrences and sampling points are easily accessible along the major asphalt road linking the regional centre of Kaédi with the capital Nouakchott (Fig. 2).
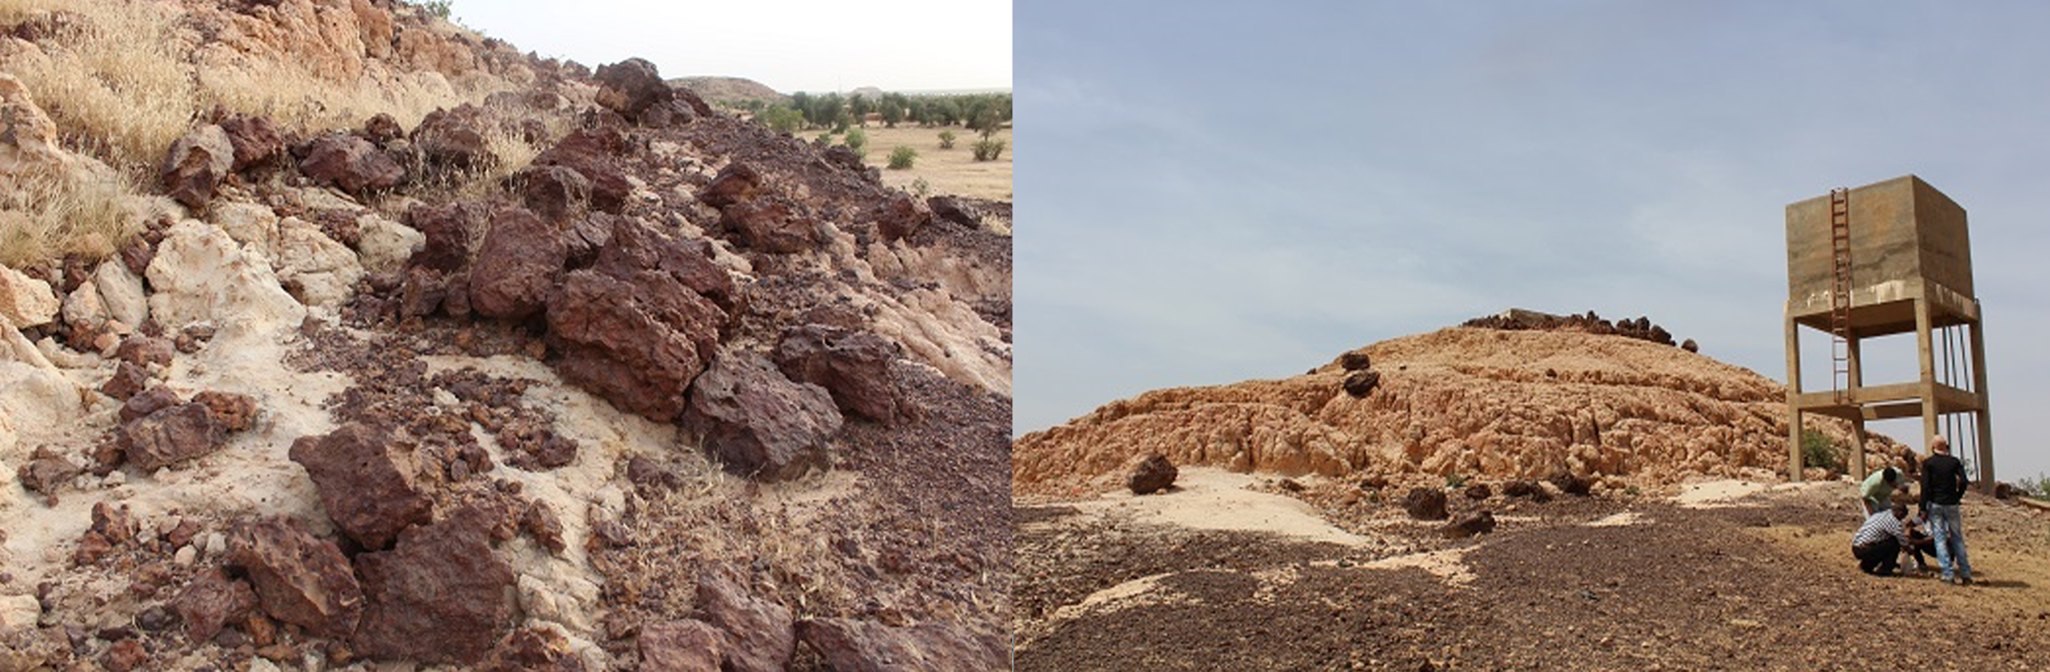
Fig. 3. Photographs of kaolin cropping out in the Kaédi region. Kaolinitic layers of the Mbidane Formation, capped by lateritic crust.
Hassi Abyad, Mauritanide Belt
In the central part of southern Mauritania, kaolins occur at Hassi Abyad, ~50 km east of the district capital M'Bout. The kaolin at Hassi Abyad crops out in an alluvial plain that dips slightly to the south, following the direction of the main surface-water drainage system (Fig. 4). The kaolin is usually unstratified and rather compact and is exposed on the surface over several square kilometres. It is made up of white kaolinitic clay with reddish, violet and yellow patches (Fig. 5) (Limam et al., Reference Limam, Ba, Mohamed and Kuester2017). The latter probably originated from (presumably later) infiltrations of weathering solutions.
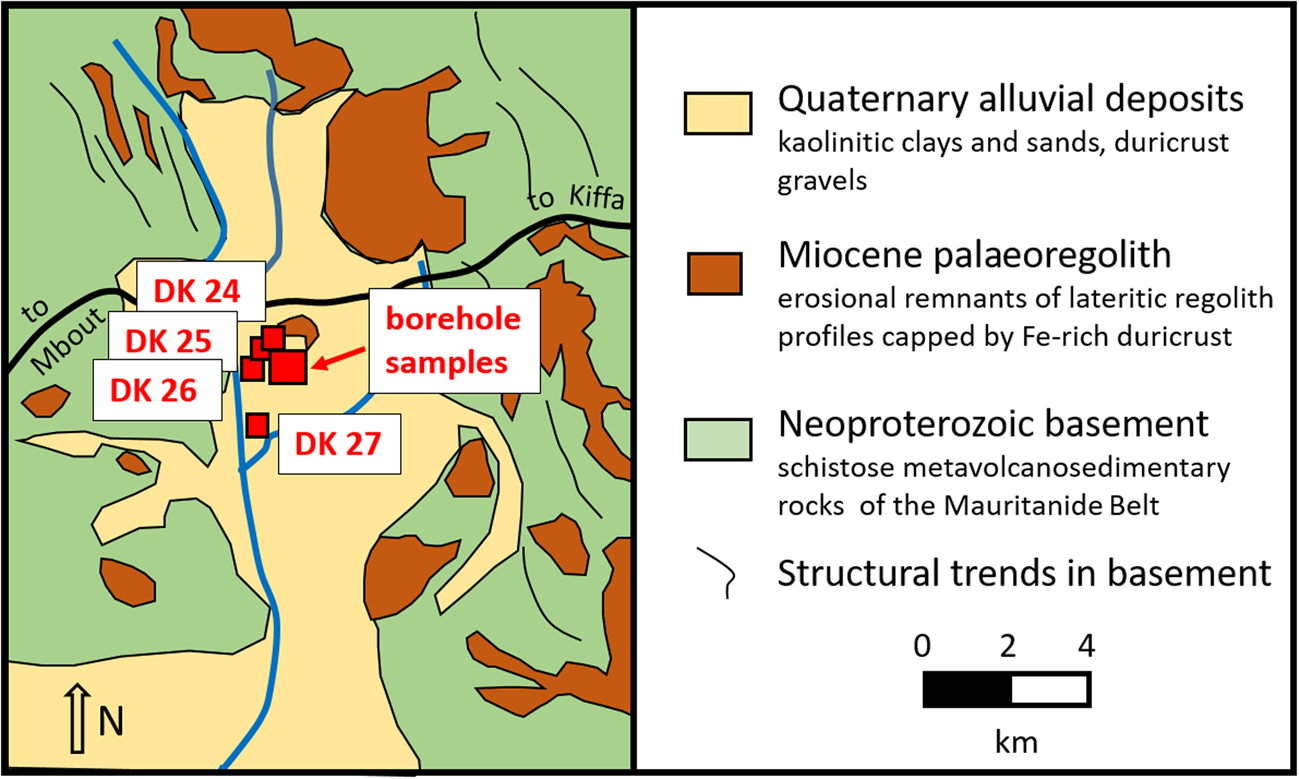
Fig. 4. Geological sketch map showing the locations of the kaolin samples at Hassi Abyad.
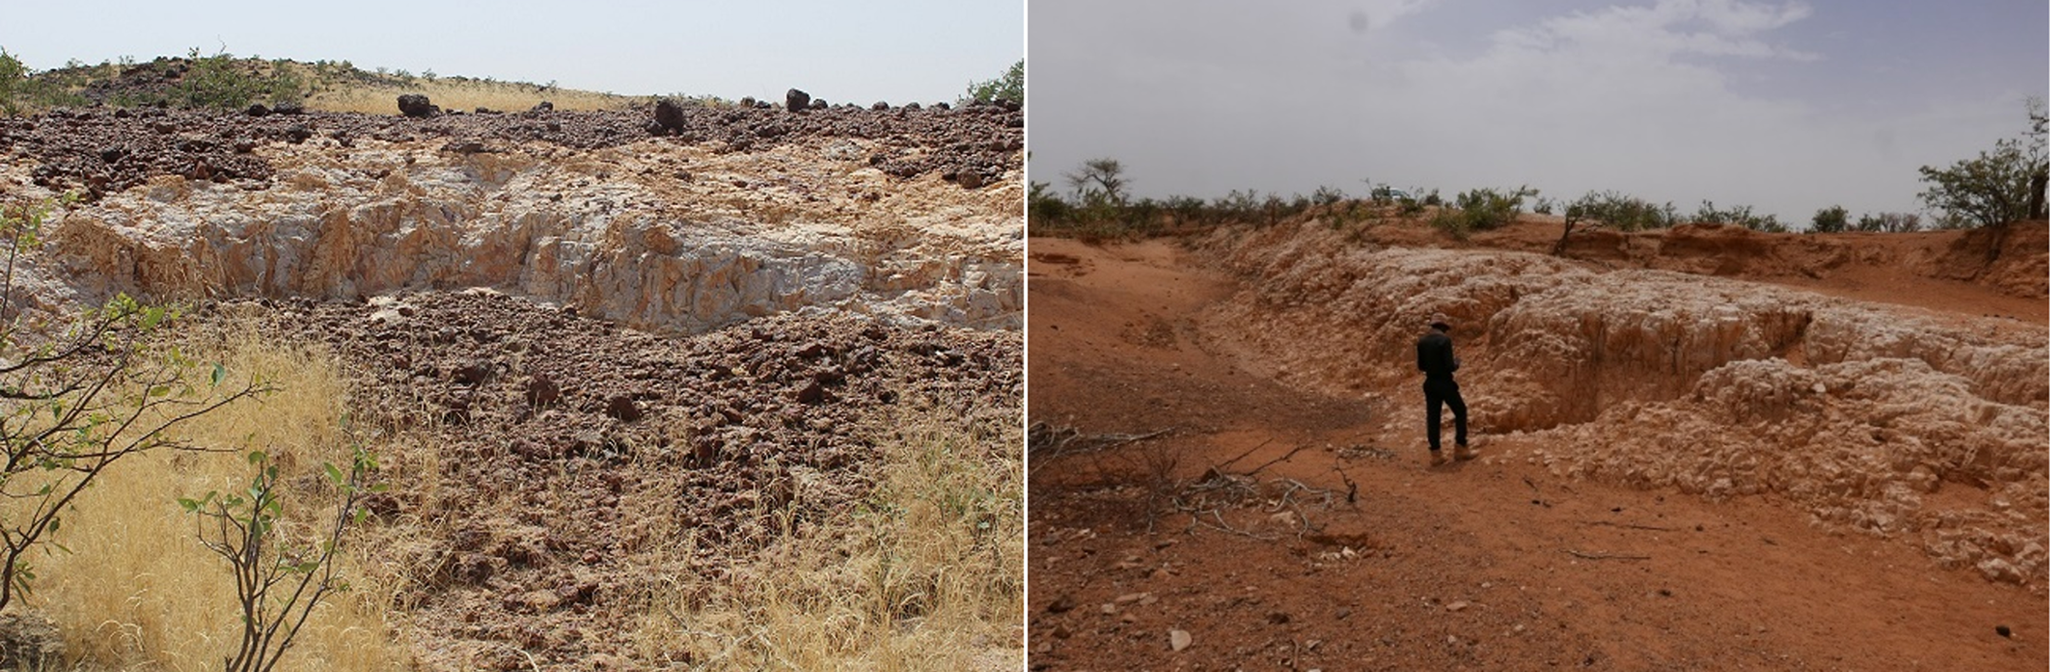
Fig. 5. Photographs of kaolin cropping out at Hassi Abyad.
The kaolin probably overlies altered metasedimentary and metavolcanic schistose rocks of the Mauritanide Belt, which also crop out along the slopes and the upper reaches of the alluvial drainage. However, the direct contact between the kaolin and the Mauritanide Belt rocks is not exposed and their relationship remains unclear. Erosional remnants of a palaeoregolith with complete in situ lateritic weathering profiles are exposed in the near surroundings (Fig. 4). The palaeoregolith is considered of Miocene age (Pitfield et al., Reference Pitfield, Key, Waters, Hawkins, Schofield, Loughlin and Barnes2004) and might have derived from the weathering of underlying Mauritanide Belt rocks. The kaolin in the Hassi Abyad plain is, in places, also capped by lateritic iron crust, and it is incised and partly overlain by a thin veneer of fluvial silts and sands, indicating that the kaolin is not a product of recent alluvial deposition. A residual or near-residual formation of the Hassi Abyad kaolin may be suggested.
Initially, a set of four surface samples was taken, which was later supplemented by 35 samples from shallow drillings (Fig. 4). Drilling was conducted due to the apparently huge size of the Hassi Abyad kaolin deposit. Further results from subsequent drillings will be reported in a follow-up paper. The Hassi Abyad deposit is reasonably accessiblevia an earthen road which links Mbout with Kiffa (see Fig. 4).
Néma region, Taoudeni Basin
In south-eastern Mauritania, kaolins occur 30–60 km north of Néma and belong geologically to the Lower Cretaceous Néma Group (Continental Intercalaire) of the Taoudeni Basin (Fig. 6). Three kaolin occurrences were sampled between Néma and Oualata, two of which occur along the flanks of an escarpment (samples WA 1 and WA 8; see also Fig. 7), while the third one resides on top of the escarpment and occupies an area >1 km2 (Limam et al., Reference Limam, Ba and Mohamed2018).
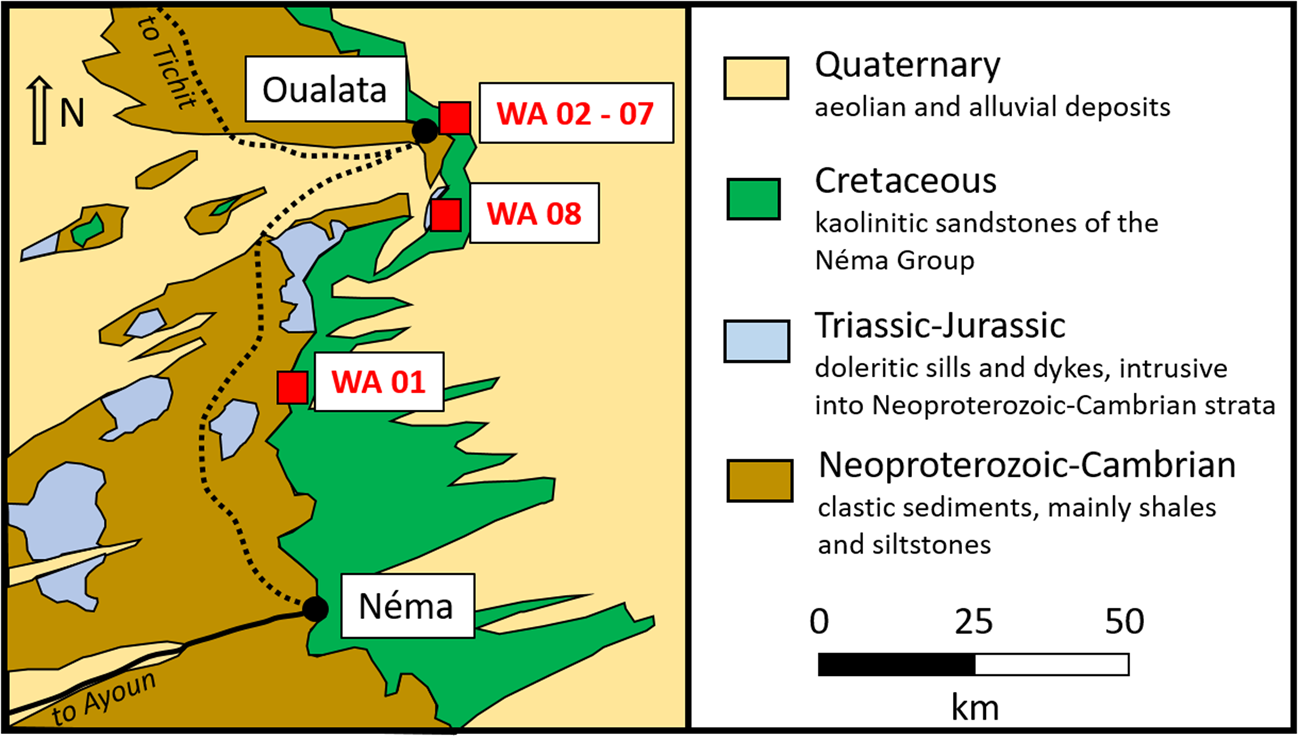
Fig. 6. Geological sketch map showing the locations of the kaolin samples from the Néma region.
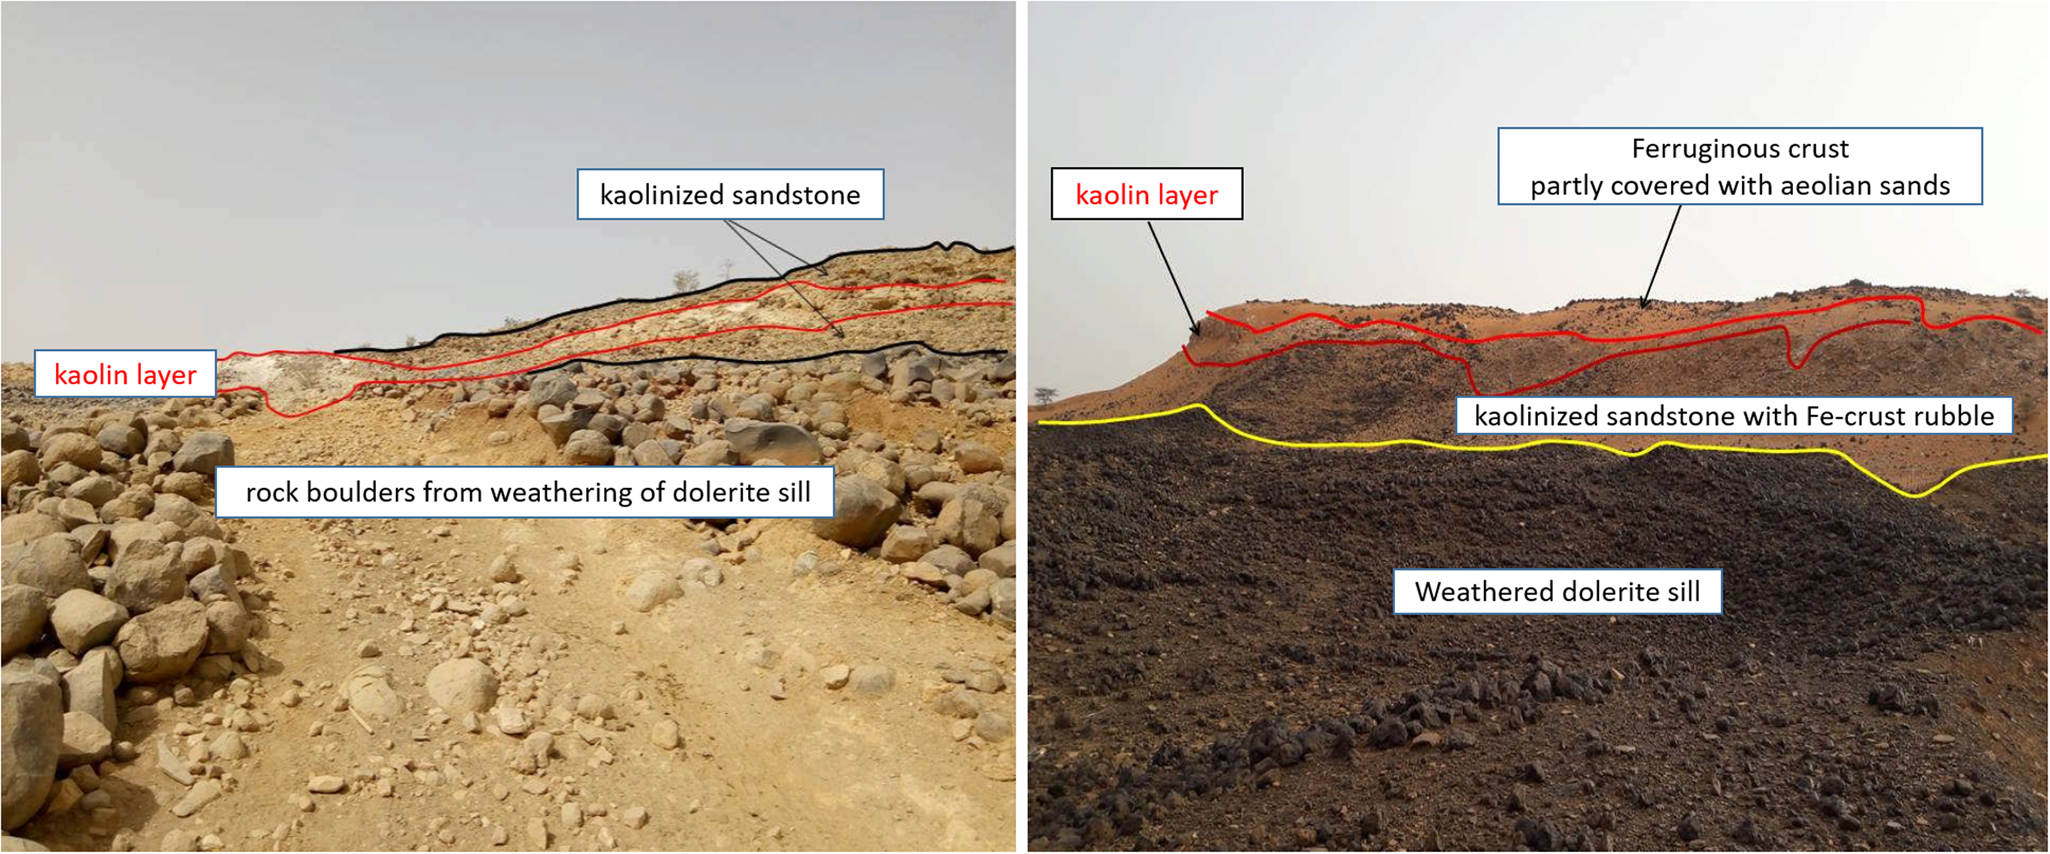
Fig. 7. Photographs of kaolin cropping out in the Néma region. Sub-horizontal, lenticular to irregular kaolin bodies within kaolinized sandstones, underlain by dolerite intrusions.
The Néma Group consists of clastic sedimentary rocks, mainly sandstones, discordantly overlying Neoproterozoic to Cambrian marine shales and siltstones (Fig. 6). The kaolin occurs in the form of lenticular bodies within variably altered and kaolinized sandstones of the Néma Group. The profile is partly capped by a thin ferricrust and is often underlain by pre-Cretaceous partly altered doleritic intrusions (see Fig. 7). Based on these observations, the formation of the kaolin by weathering and alteration of the clastic sedimentary rocks is likely; detailed investigations of the genesis of these occurrences have not been undertaken, however.
The kaolins of the Néma-Oualata region are rather difficult to access and can be reached from Néma, the regional centre, only via logistically challenging desert tracks.
Materials and methods
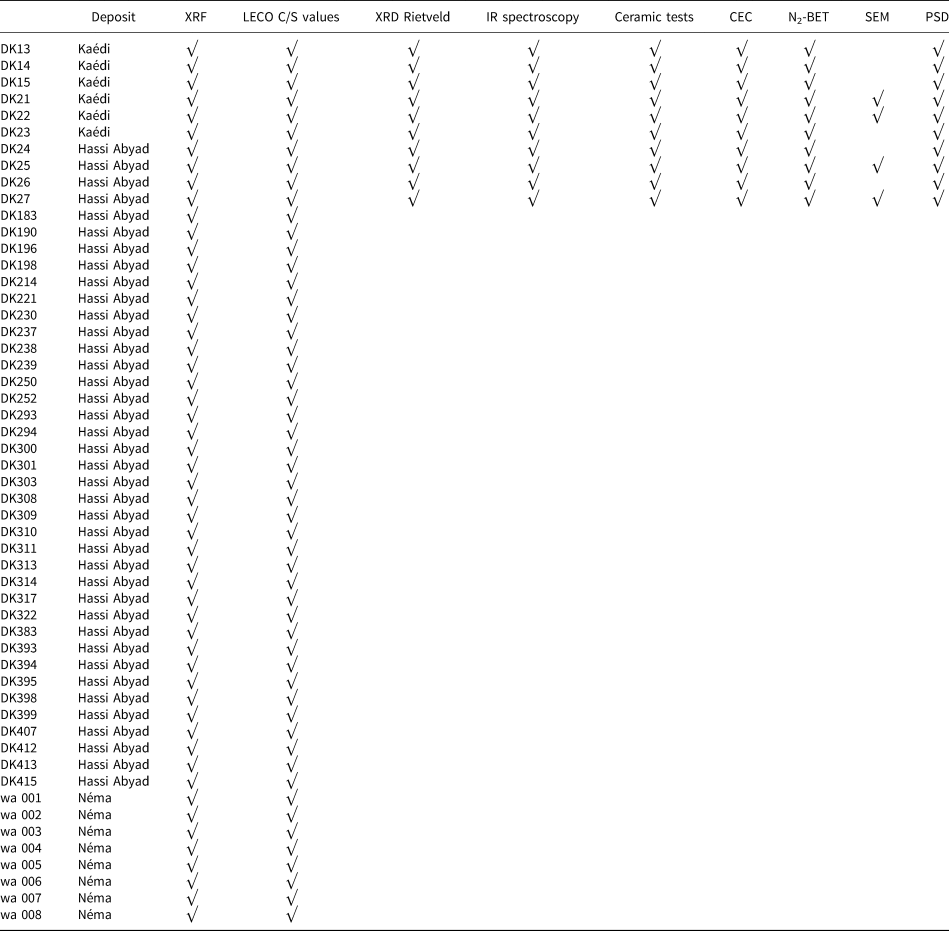
A total of 53 samples were collected from the three regions and were analysed using X-ray fluorescence (XRF). The samples were dried at 60°C for 3 days and ground using a mortar mill prior to analyses. The samples and analyses performed and discussed in the present study are summarized in Table 2.
Table 2. Samples collected from the three kaolin-bearing regions and the analytical methods used in the present study.

PSD = particle-size distribution.
Samples were ground and mixed with a lithium metaborate flux (Spectroflux, Flux No. 100A, Alfa Aesar) and fused to make glass beads. The beads were analysed using wavelength-dispersive XRF spectroscopy with a PANalytical Axios spectrometer (ALMELO, The Netherlands). To determine loss on ignition (LOI), 1000 mg of sample material was heated at 1030°C for 10 min. A total of 150 reference samples provided by various geological surveys were used for calibration. The materials covered common rocks, soils and ores. Validation of the calibration was performed using mixtures of synthetic oxides. Matrix correction was carried out as described by de Jongh (Reference de Jongh1973).
The mineralogical composition of the samples was determined using X-ray diffraction (XRD) with a PANalytical X'Pert PRO MPD θ-θ diffractometer (Co-Kα radiation, 40 kV and 40 mA), equipped with a variable-divergence slit (20 mm irradiated length), primary and secondary soller slits, diffracted beam monochromator, point detector and sample changer (sample diameter 28 mm). The samples were investigated from 1° to 80°2θ with a step size of 0.03°2θ and a measuring time of 10 s per step. For specimen preparation, the back-loading technique was used. Prior to XRD measurements, the samples were also ground using a McCrone mill.
Rietveld refinement of the experimental XRD data was conducted using the Profex/BGMN software (Bergmann et al., Reference Bergmann, Friedel and Kleeberg1998; Döbelin & Kleeberg, Reference Döbelin and Kleeberg2015). The mineral phases were identified during the Rietveld refinement process. No other clay mineral was identified; therefore, the refinements started at 10°2θ. The presence of abundant illite was rejected based on the low K2O content of the samples. The kaolinite content was derived from Rietveld refinement using two types of kaolinites with various degrees of disorder. The kaolinite content represents the sum of both types (Ufer et al., Reference Ufer, Kleeberg and Monecke2015). Kaolinite contents were also calculated based on the Al2O3 content assuming the absence of other Al-bearing minerals and considering that 1mass% kaolinite contains 0.395 mass% Al2O3.
Fourier-transform infrared (FTIR) spectra were collected in the mid-infrared (MIR) region using the KBr pellet technique (1 mg sample per 200 mg KBr). Spectra were collected on a Thermo Nicolet Nexus (Nicolet Instruments, USA) FTIR spectrometer (MIR beam splitter: KBr, deuterated triglycine sulfate detector), with a resolution of 2 cm–1. Measurements were conducted before and after drying of the pellets at 150°C in a vacuum oven for 24 h.
The cation-exchange capacity (CEC) of the samples was measured using the Cu-triethylenetetramine (Cu-Trien) method (Meier & Kahr, Reference Meier and Kahr1999). Using this method, 10 mL Cu-Trien solutions and 50 mL of deionized water were added to the sample (400 and 600 mg). The mixture was shaken end-over-end for 1 h and subsequently was centrifuged. The amount of Cu-Trien adsorbed was measured with a visible-light spectrometer adjusted to 578 nm.
The specific surface area of the samples was determined by N2 adsorption. Measurements were performed using a Micromeritics Gemini III 2375 surface area analyser with samples of ~300 mg in weight. Samples were degassed for 24 h at 105°C under vacuum. Nitrogen adsorption at five different relative pressure values was assessed and the data were used to calculate the Brunauer–Emmett–Teller (BET) surface area.
The organic carbon (Corg) content was measured using a LECO CS-444 Analysator (LECO, USA) after dissolution of the carbonates. Carbonates were removed by treating the samples several times at 80°C with HCl until no further gas evolution could be observed. Samples of 170–180 mg of the dried material were used to measure the total carbon (Ctotal) content. Total inorganic carbon (Ccarb) was calculated from the difference of Ctotal and Corg. The samples were heated in the device to 1800–2000°C in an oxygen atmosphere and the CO2 and SO2 were detected using an infrared detector.
Ceramic tests were performed at the FGK, which runs/operates a commercial testing laboratory specialized in testing inorganic materials made of ceramics and glass. The melting behaviour was tested according to DIN 51730 (2007). In addition, the firing shrinkage and colour after firing were determined. Furthermore, the water absorption with open porosity and the tensile strength were determined according to DIN EN 993-1 (2019). Prior to ceramic testing, the samples were dried at 110°C, milled by a jaw crusher and ground by a vibratory disc mill (split width 1 mm). For the production of pressed pieces (pellets), ~6 mass% water was added to each sample. For each sample, 30 pellets with a diameter of 40 mm were produced using a 32 MPa uniaxial load. The mass of each pellet was 20 g. After compaction, the samples were again dried at 110°C and then calcined at various temperatures (1000°C, 1100°C, 1200°C, 1300°C), with a temperature ramp of 5 K min–1 and a 30 min soaking time at maximum temperature.
A Zeiss Sigma 300 VP field emission gun scanning electron microscope (SEM) operating at 15 kV was used to evaluate the samples at the micro-scale using the high-vacuum mode. Carbon coating was used to provide sufficient electrical conductivity. The microscope was equipped with the following detectors: a Bruker Xflash® 6/60 energy-dispersive X-ray detector, a high-definition backscattered electron detector (HDBSD), a secondary electron detector (SE2), a variable-pressure secondary electron detector (VPSE) and an InLens detector for the detection of secondary and backscattered electrons, respectively.
Grain-size analysis was performed using X-ray granulometry (XRG) with a SediGraph 5100™ and MasterTech 052 Autosampler™ (Micrometrics, USA). The device is used to measure gravity-induced settling rates of different-sized particles through X-ray absorption of particles in a suspension. Prior to this measurement, the samples were dispersed in a 0.01 N Na2P2O7 × 10 H2O solution, and the >63 μm fraction was subjected to drying and conventional sieving. The material passing through the 63 μm sieve was freeze-dried and resuspended to fit the requirements of XRG regarding the solution:solid ratio. This procedure also included ultrasonic treatment of the suspension (2 × 2 min at 20 kHz) in addition to a weak ultrasonic short shake-up immediately prior to XRG measurement.
Results and discussion
Chemical composition
Kaolin raw materials are commonly assessed based on their Al2O3 content, which is often highly correlated with the kaolinite content (e.g. Dewi et al., Reference Dewi, Agusnar, Alfian and Tamrin2018). The geochemical data including C and S values of all samples considered in the present study are given in Table 3. Reference chemical compositions for commercial kaolins were published by Harben (Reference Harben1992).
Table 3. Geochemical data of all samples. Al2O3 contents are often used as kaolin quality indicators and hence are marked in bold. Values marked with italics are significant.
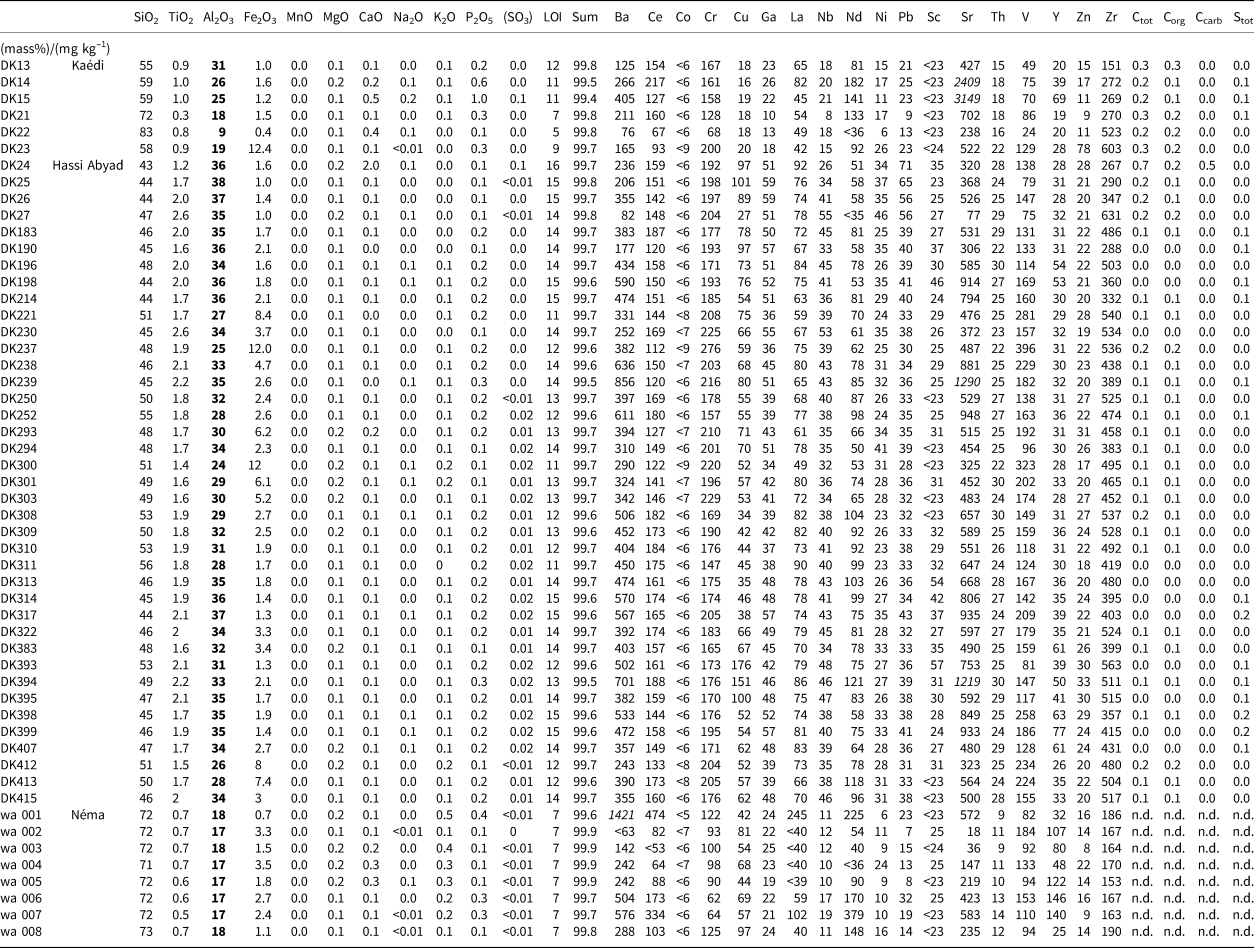
The Al2O3 content of the samples from the Kaédi region ranged from ~10 to 31 mass%, corresponding to a kaolinite content ranging from 25 to 80 mass%. The Fe2O3 content of the kaolinite-rich materials was small (<2 mass%), as was the inorganic carbon content. The C contents ranged from 0.1 to 0.3 mass% and could be largely explained by the presence of organic C rather than carbonates. The carbonate content hence is low, which is favourable for some ceramic applications. Relatively high P contents (0.1–1.0 mass%) as well as Sr contents (up to 3000 mg kg–1) were identified. Samples from Hassi Abyad, by contrast, had greater TiO2 contents (>1 mass%), maximum Sr contents of ~1000 mg kg–1 and a very small organic carbon content on average. The Al2O3 content of the Hassi Abyad samples indicated the presence of up to 96 mass% kaolinite and >80 mass% kaolinite on average. The kaolins from the Kaédi and Hassi Abyad regions have variable Fe2O3 contents, but the kaolins from the Néma region are more homogeneous with respect to Fe2O3 content. The geochemical variation of the samples from the Néma region was comparably low, but the kaolinite contents did not exceed 50 mass% (based on the Al2O3 values of 17–18 mass%). In addition, the region is not easily accessible. Therefore, the study focused on the kaolins from the Kaédi and Hassi Abyad deposits. The trace element composition showed relatively large Cr contents, suggesting at least andesitic parent rocks and comparably high Sr contents. The most significant Sr contents are marked in italics in Table 3.
Mineralogical characterization
A summary of the mineralogical composition of selected samples from the Kaédi and Hassi Abyad deposits is given in Table 4.
Table 4. Mineralogical composition of selected samples from Kaédi and Hassi Abyad. Contents <1 mass% are declared as ‘0’. The most significant parameter (kaolinite content) is marked in bold.
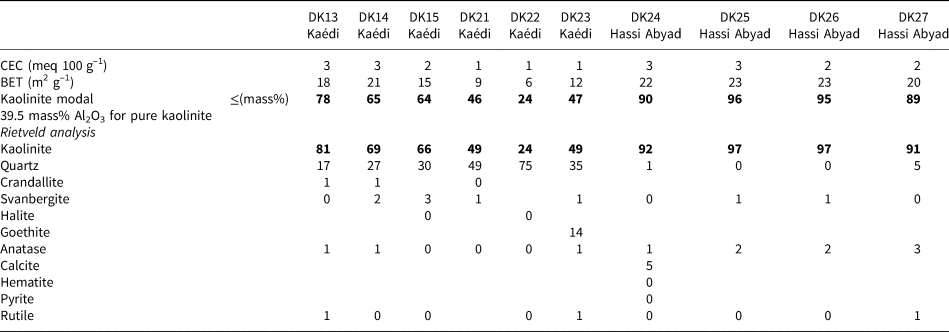
The CEC values of all samples from both deposits are small, indicating traces or the absence of swelling clay minerals. A CEC value of 2 or 3 meq 100 g–1 is attributed to the variable charge of the kaolinites (Kaufhold & Dohrmann, Reference Kaufhold and Dohrmann2013). The BET specific surface area is commonly controlled by micropores, but in the case of kaolinites, which do not possess micropores, it is controlled by the particle size. Well-crystallized kaolinites have specific surface areas of <10 m2 g–1. The specific surface areas of samples from both deposits considered in the present study, by contrast, was ~20 m2 g–1, pointing towards the presence of small kaolinite particles. Specific surface areas of <20 m2 g–1 were observed in the samples with the smallest kaolinite contents (e.g. sample DK22, with a specific surface area of 6 m2 g–1, contains 24% kaolinite).
Two methods were used to determine the kaolinite content: XRF and Rietveld analysis with XRD. Assuming that an Al2O3 content of pure kaolinite accounts for 39.5 mass% and that other Al-bearing minerals are absent, the modal kaolinite content can be calculated based on the Al2O3 content. This method is used routinely in the clay industry. The kaolinite contents obtained from these two methods are in quite good agreement. Using XRD, two different phosphate minerals were distinguished: Ca- and Sr-dominated (crandallite and svanbergite). A reasonable correlation was found between the svanbergite content and the Sr content, which indicates that both related P compounds could be distinguished well by XRD. Apart from crandallite and svanbergite, there is a variety of so-called ‘aluminium phosphates and sulfates’ minerals (Dill, Reference Dill2001), which are barely detectable in many clays, though they may be present in minor amounts. Therefore, the identification of svanbergite by XRD in the present study is exceptional, and one has to keep in mind that the mineral that is present might deviate in composition from ideal svanbergite. However, a reasonable XRD–Rietveld fit was obtained using a svanbergite model, and the values fit well with the chemical data.
It remains challenging to obtain an accurate description of the kaolinite structure for use in Rietveld refinement because of the various types of possible structural disorder. Various attempts to describe the structure and structural disorder of kaolinites have been published by Ufer et al. (Reference Ufer, Kleeberg and Monecke2015) and Sakharov et al. (Reference Sakharov, Drits, McCarty and Walker2016). Additional information on the disorder of kaolintes was provided by, for example, Brindley et al. (Reference Brindley, Kao, Harrison, Lipsicas and Raythatha1986), and, more recently, Kogure et al. (Reference Kogure, Inoue and Beaufort2005) and Mercier & Page (Reference Mercier and Page2008). This topic will not be discussed here further because it will be addressed in a follow-up study. Instead, the XRD traces of three samples of the two promising deposits (Fig. 8) were compared using widely accepted methods for the interpretation of kaolinite diffraction data.

Fig. 8. XRD powder traces of six samples from both promising deposits (uppermost pattern: Hassi Abyad; lowermost pattern: Kaédi).
Kaolinites from the two deposits showed significantly different diffraction traces. The green trace (Fig. 8) representing sample DK22 is dominated by quartz, and the d 001 intensity of kaolinite is low because of the small kaolinite content of this sample. The d 001 reflection of the remaining samples is sharp, but significant differences were found in the 2θ regions between 23–28° and 40–47°. The peaks between 40° and 47° might indicate a more dickitic character of the Hassi Abyad samples (stacking sequences with alternating octahedral vacancies) and a more kaolinitic character of the Kaédi samples (stacking sequences with equal octahedral vacancies). Sample DK22 would also be considered as showing dickitic character, but the kaolinite content is small, which results in lower intensities and thus increasing uncertainty. If present, the dickitic character might be interpreted as a type of disorder caused by a mix of dickitic and kaolinitic layer stacking. However, more work is necessary to verify the presence of dickitic stacking sequences in the Hassi Abyad samples. Additional b-axis disorder may exist, but this is also difficult to verify. Overall, the samples from Hassi Abyad showed a lesser degree of structural order compared to the samples from Kaédi.
Careful inspection of the XRD traces (7 h long-term measurements) showed no hints of mica or feldspars. This finding is supported by the chemical composition. The only layer silicate present is kaolinite. Therefore, only randomly orientated specimens were prepared.
IR spectroscopy
Selected samples were investigated by FTIR spectroscopy. The FTIR spectra are shown in Fig. 9.
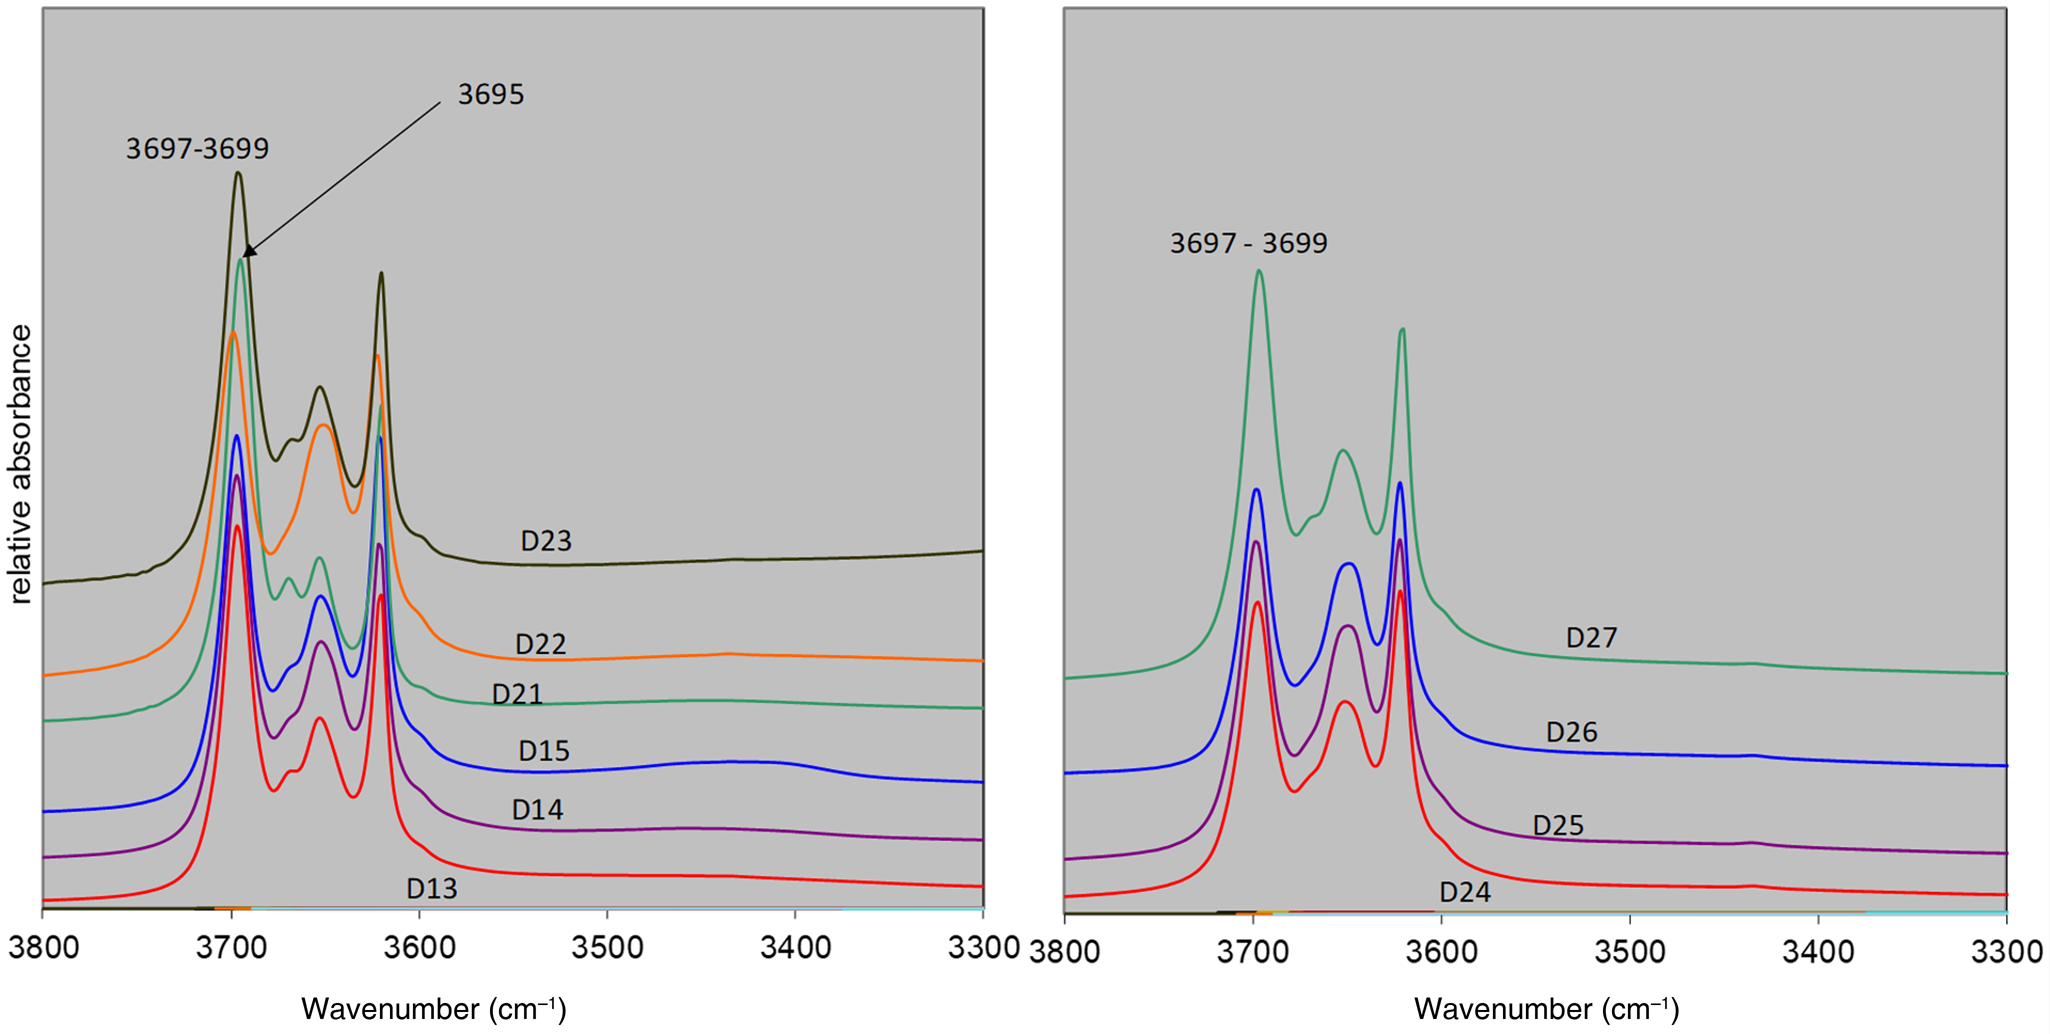
Fig. 9. FTIR spectra of the selected samples from the Kaédi (left) and Hassi Abyad (right) deposits.
FTIR spectroscopy may also be used to investigate the degree of structural order of kaolin minerals (Russell & Fraser, Reference Russell, Fraser and Wilson1994; Awad et al., Reference Awad, Amer, López-Galindo, El-Rahmanya, García del Morale and Viseras2018). Figure 9 shows the OH-stretching region of the IR spectra of the selected samples from the Kaédi and Hassi Abyad deposits. The 3670 cm–1 band intensity (ν2 in case of kaolinites) can be used to determine the so-called ‘b-axis’ disorder, a term often used to describe the IR spectra of kaolinite (Brindley et al., Reference Brindley, Kao, Harrison, Lipsicas and Raythatha1986). The discussion about the exact meaning of this parameter, however, is not the subject of the present study; it is simply used as a proxy to characterize the various materials. Significant variability of the 3670 cm–1 band intensity (b-axis disorder) of samples from Kaédi was observed (Fig. 9, left). Most samples showed a pronounced shoulder at 3670 cm–1, and sample DK21 showed a well-resolved band. Accordingly, the kaolinite from sample DK21 showed the least significant b-axis disorder and the kaolinite from sample DK22 showed the most significant b-axis disorder. The sample from Hassi Abyad, on the other hand, did not display such variations, but instead showed a high degree of b-axis disorder (low intensity of the 3670 cm–1 band). Alternatively, the position of the ν1 stretching vibration of kaolinites can be used to estimate the Hinkley index, which has often been used to characterize the degree of structural disorder of kaolinites using XRD (Brindley et al., Reference Brindley, Kao, Harrison, Lipsicas and Raythatha1986). Additional indices have been discussed by Brindley & Brown (Reference Brindley and Brown1980), for example. The band positions of all of the samples varied from 3697 to 3699 cm–1, corresponding to a Hinkley index of 0.2–0.4, indicating moderately disordered kaolinites. Only sample D21, which also showed the most intensive 3670 cm–1 band, pointing towards the least b-axis disorder, showed a ν1 band position of 3695 cm–1, corresponding to a Hinkley index of 0.7 (based on Brindley et al., Reference Brindley, Kao, Harrison, Lipsicas and Raythatha1986) and indicating a greater degree of structural order. A further possibility for characterizing the degree of structural order of kaolinites based on IR spectroscopy was published by Parker (Reference Parker1969). He considered the ratio of the ν1 (3700 cm–1) and the ν4 (3625 cm–1) bands, which reflects the ratio of OH groups at the outer particle surfaces and OH groups inside the particles. For samples DK24 to DK26, a ν1:ν4 ratio of ~1 was calculated. In the case of the Kaédi samples, on the other hand, a slightly more intense ν1 was observed.
SEM investigation
Four different samples selected based on their varying degree of structural order (as indicated by IR spectrometry) were investigated using SEM. The largest degree of structural order was found for sample DK21, followed by samples DK27 and DK25 (more or less similar), and the lowest degree of structural order was found for sample DK22. Representative SEM images of these four samples are shown in Fig. 10.
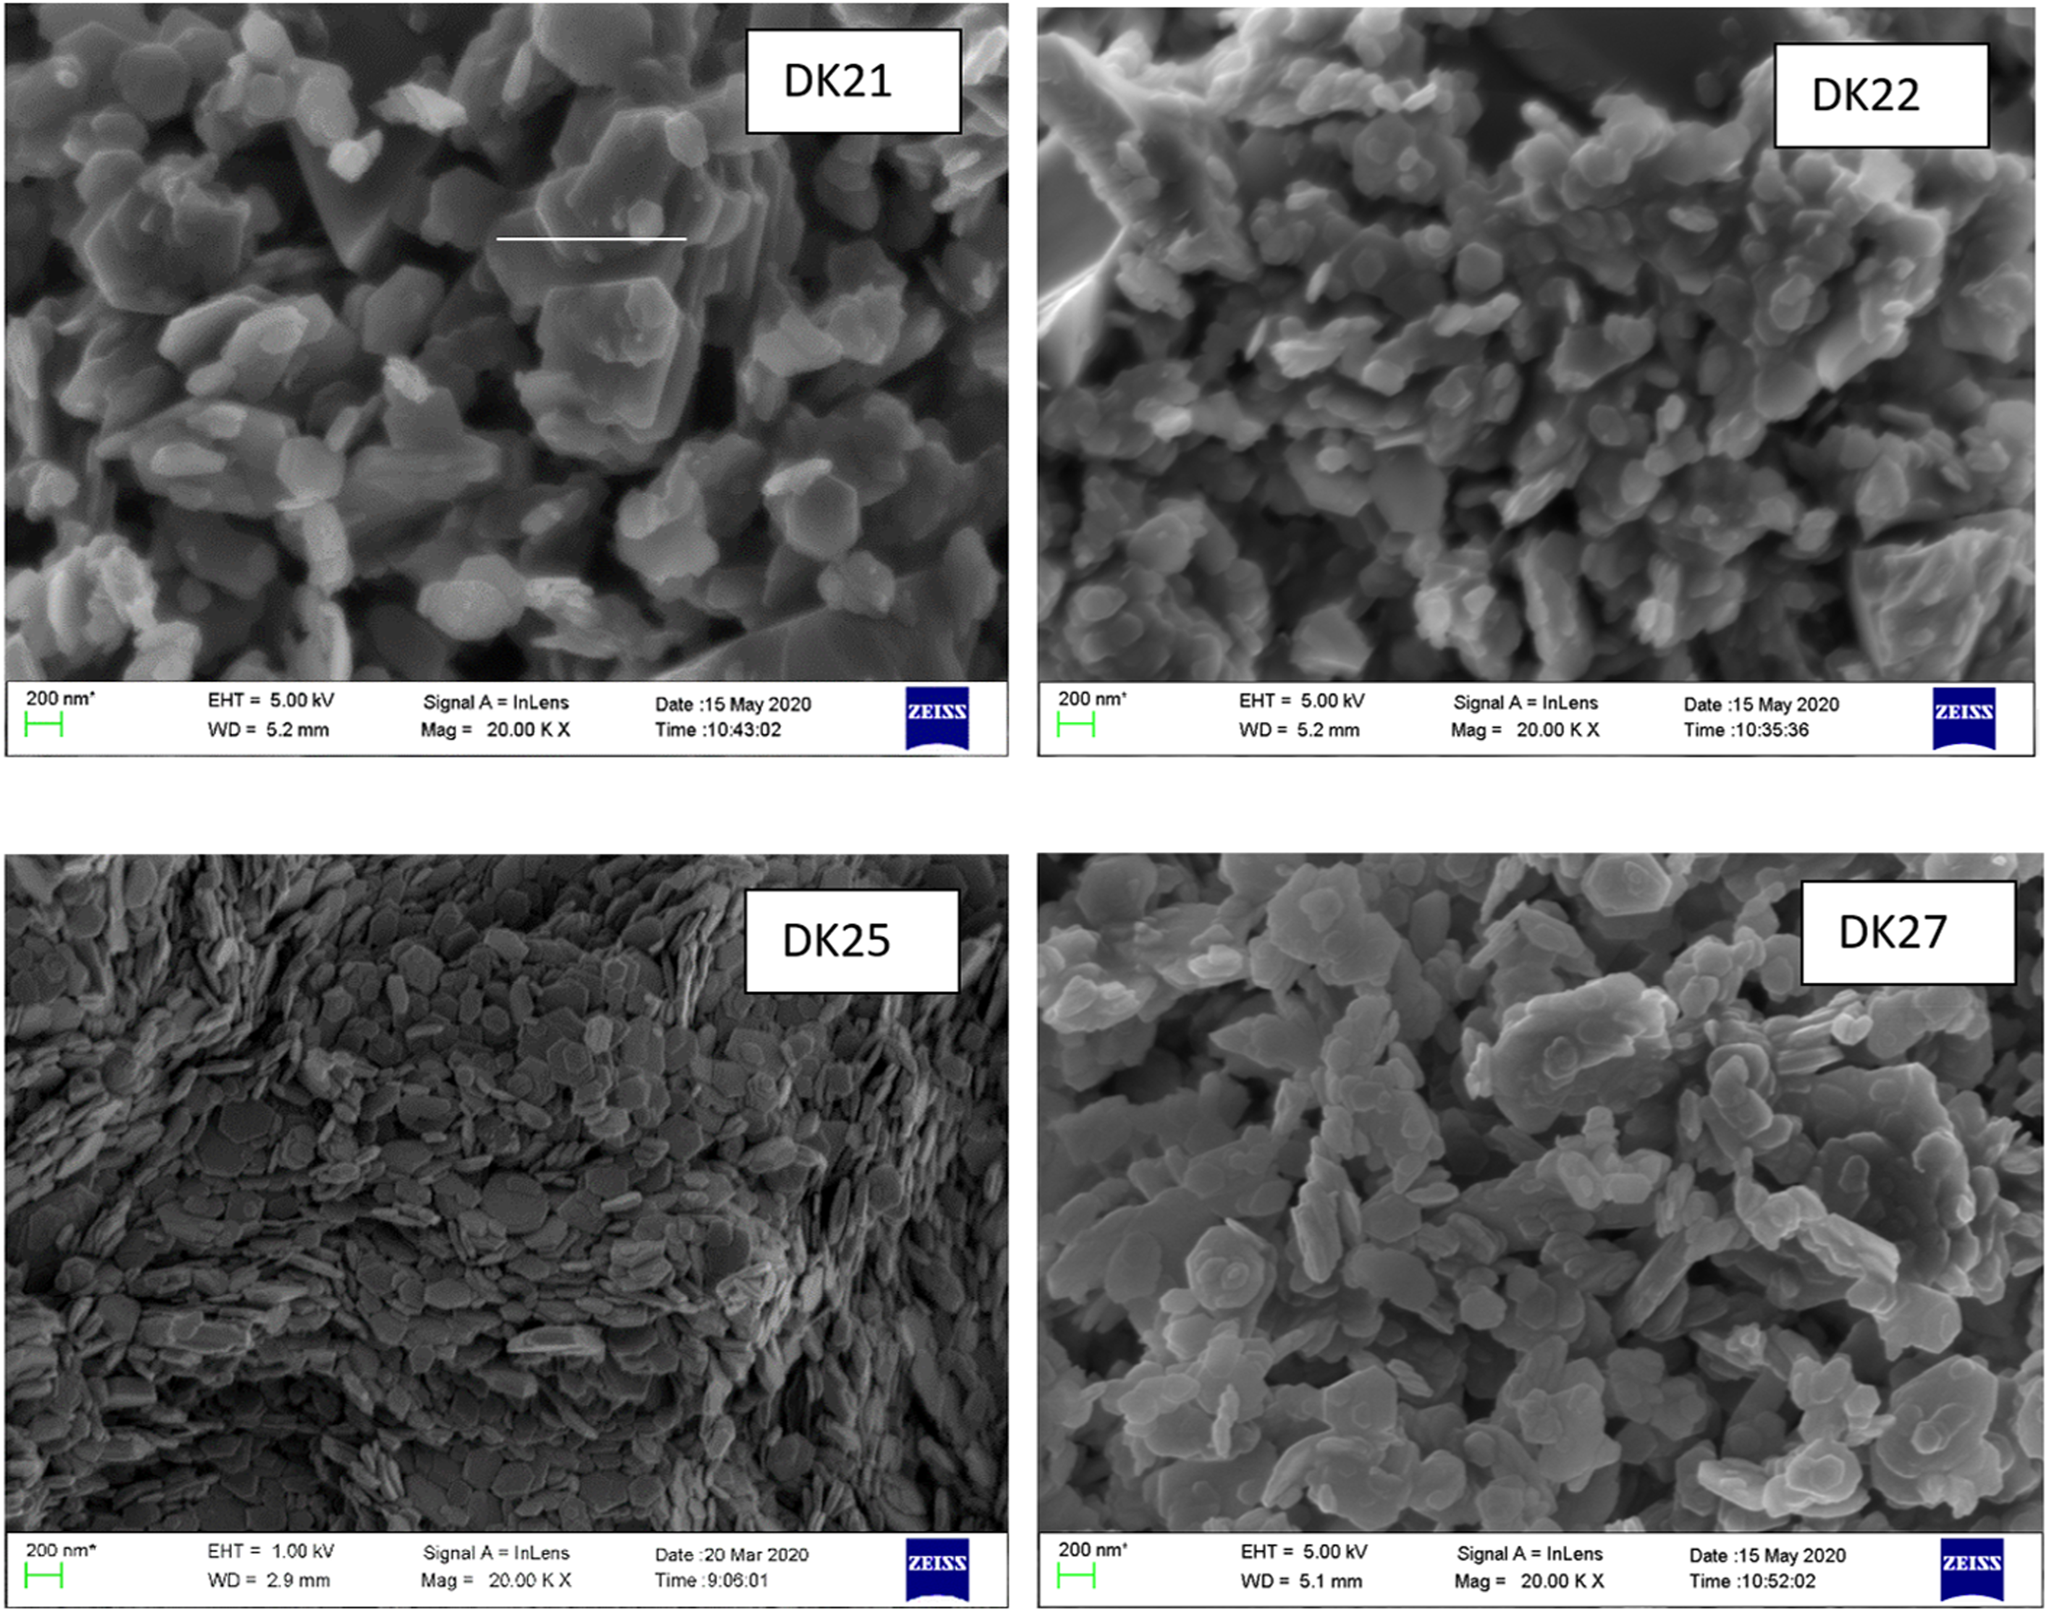
Fig. 10. SEM images of four samples selected because of their varying degrees of structural order in the sequence DK21 > DK 27 ≥ DK25 > DK22.
The largest kaolinite crystallites occur in sample DK21, which showed the greatest degree of structural order. The largest crystallites were ~1 μm and the particle size ranged between 0.2 and 1.0 μm (scale bar in Fig. 10). Both hexagonal and pseudohexagonal platy particles were observed. Kaolinite particles from sample DK22 with the least degree of structural order showed diameters of ~0.2 μm. Kaolinite particles of sample DK25 were slightly larger (0.2–0.4 μm). Sample DK27 showed kaolinite particle sizes ranging from 0.2 to 0.6 μm. All of the samples showed kaolinite particles with comparably high aspect ratios and (pseudo)hexagonal shapes, but of different diameters, which corresponded to the degree of structural order. The typical ‘booklet’ appearance of kaolinites was not observed. The morphology of kaolinites was discussed comprehensively by Fiore et al. (Reference Fiore, Huertas, Huertas and Linares1995) and Zhang et al. (Reference Zhang, Liu, Yang, Wang, He and Sun2017).
Particle-size distribution
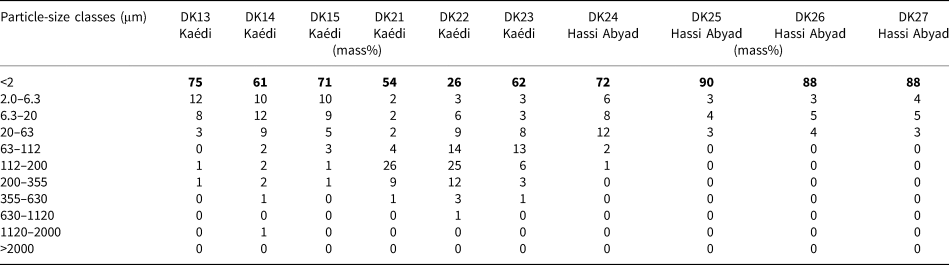
The particle sizes of the selected samples are summarized in Table 5 (compare with Table 2).
Table 5. Particle-size distribution of selected samples. The most significant size class is shown in bold.

The material from Hassi Abyad consists mainly of fine particles rarely exceeding 63 μm in size. As was expected, the dominant particle size class was the <2 μm fraction. The <2 μm content of the samples from this deposit ranged from 70 to 90 mass%. The greater values were observed for the kaolinite-rich materials. The samples from the Kaédi deposit might be classified into two groups based on the particle size. Samples DK13 to DK15 contained only 2–5 mass% <63 μm and up to 70 mass% <2 μm, but the remaining samples (DK21 to DK23) contained 20–30 mass% >63 μm and had considerably fewer particles of the <2 μm fraction. This result is in accord with the larger quartz content determined by XRD (Table 4).
Ceramic testing
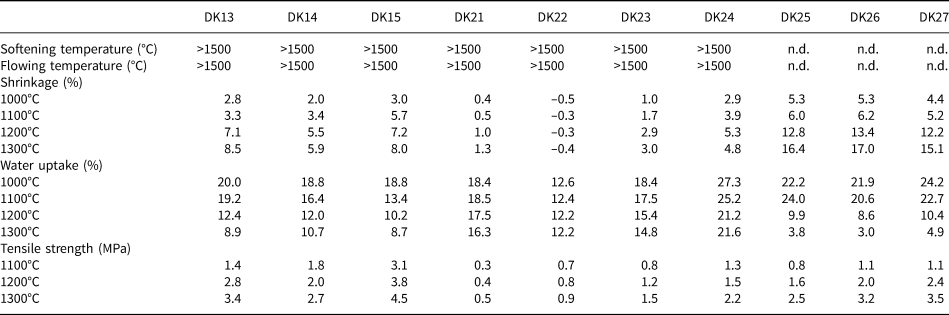
Ten samples of the Hassi Abyad and the Kaédi deposits were selected for the testing of ceramic properties. The results are summarized in Table 6. In addition, the results were compared with the Al2O3 content, which largely reflects the kaolinite content.
Table 6. Results of ceramic tests of selected samples.

The softening and flowing temperatures of all of the samples exceeded 1500°C (not determined for DK25 to DK27 because of their high Al2O3 contents). Therefore, these parameters could not be used to determine the ceramic properties of the samples.
A good correlation was observed between Al2O3 and shrinkage (Fig. 11a). A greater shrinkage was observed for samples with greater Al2O3 contents. A good correlation was observed for all temperatures. Sample DK22 did not show any shrinkage, probably because of the rather small kaolinite and large quartz contents. Sample DK24 showed a unique behaviour: a decrease in volume was observed between 1200°C and 1300°C, which was not observed for the other samples. This might be attributed to the calcite content because this is the only carbonate-bearing sample. This possible explanation, however, remains speculative.
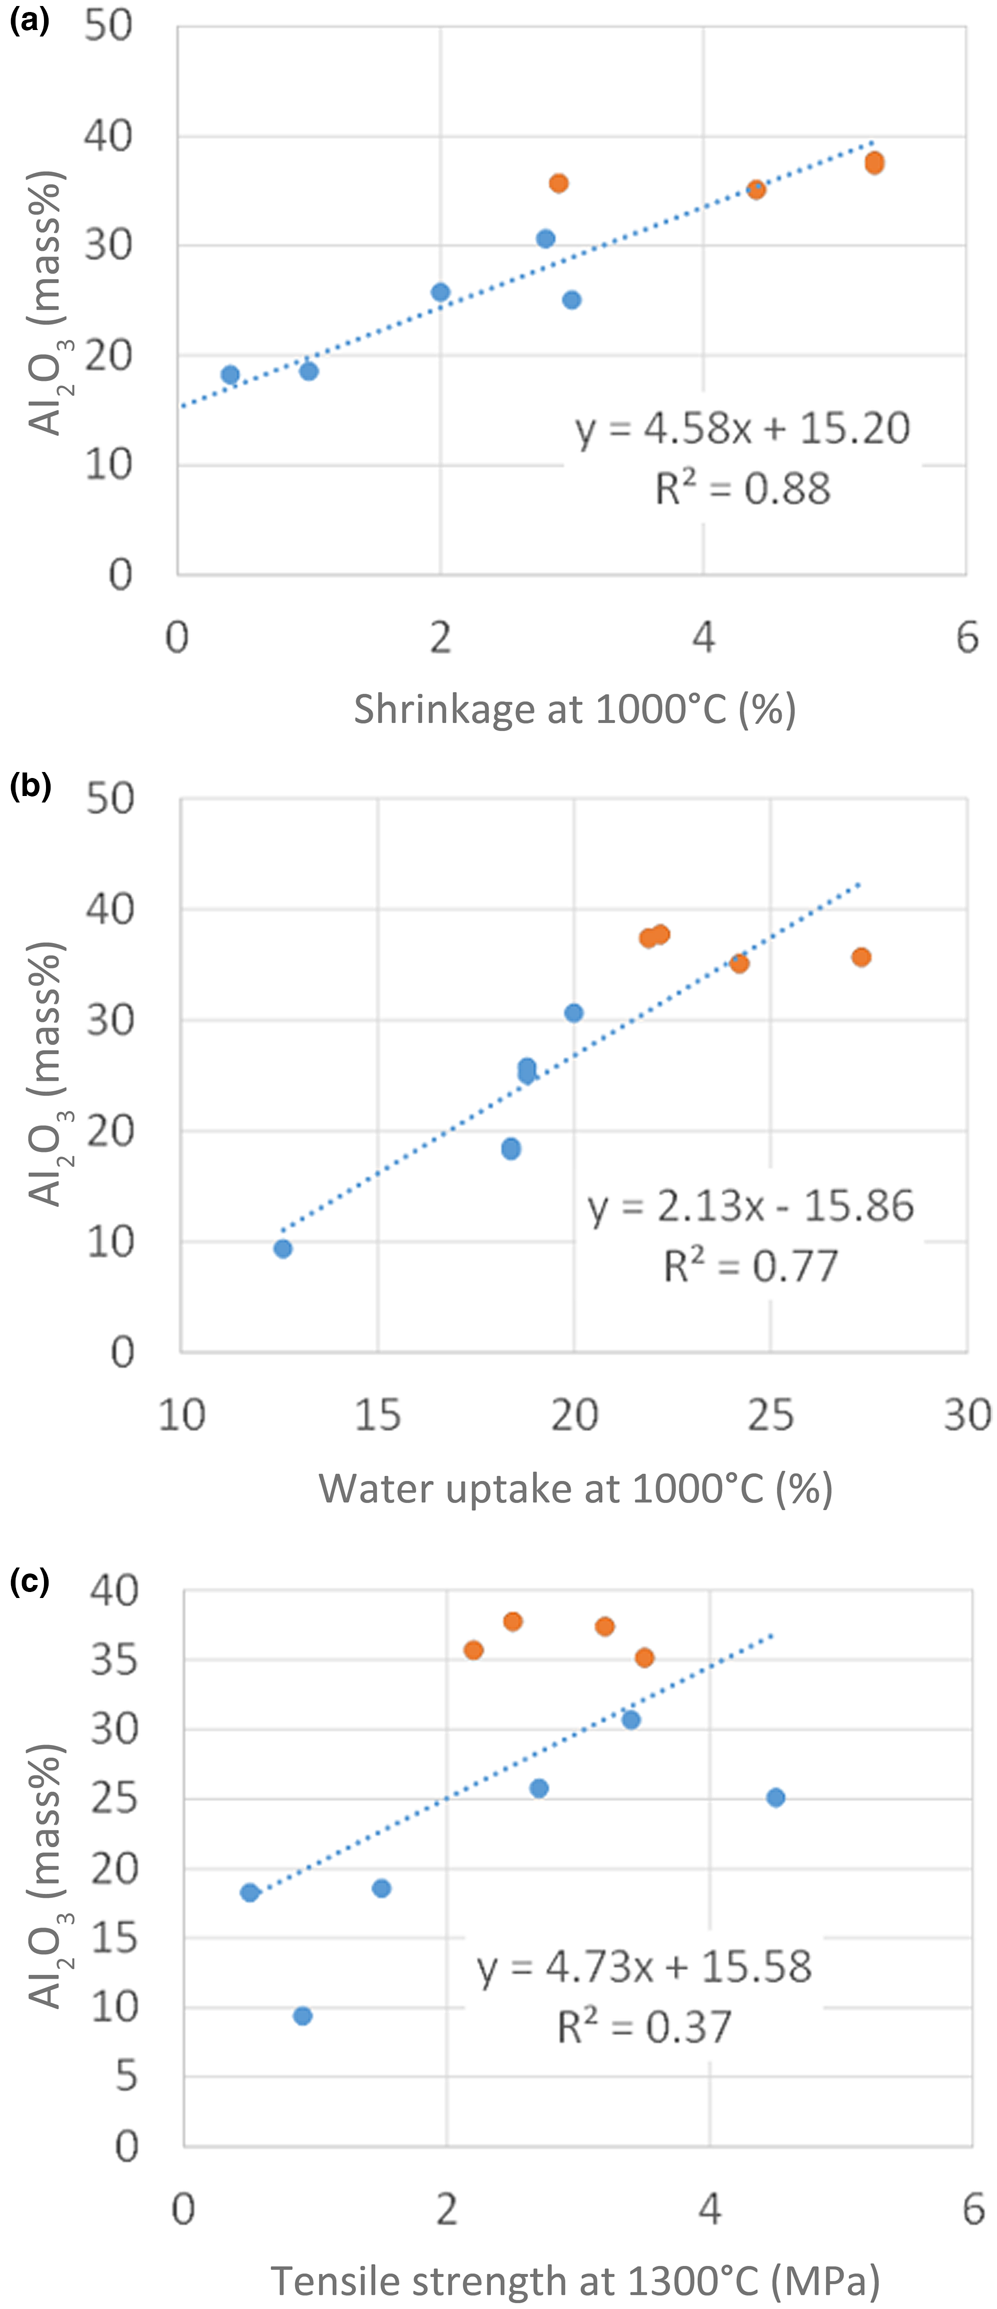
Fig. 11. Correlations of ceramic parameters with the Al2O3 contents of selected samples. (a) Shrinkage compared with Al2O3 content; (b) water uptake compared with Al2O3 content; (c) tensile strength compared with Al2O3 content.
The water-adsorption capacity (Fig. 11b), which can be used to determine the level of open porosity, is known to be related to the shrinkage. Samples with a large kaolinite content show a significant decrease in water uptake. As for the shrinkage case, sample DK22 did not follow this trend because of its small kaolinite content. In addition, sample DK24 did not show any significant change in its water-adsorption capacity at >1200°C, in contrast to the other samples. No explanation is currently offered for this unique behaviour. The regression coefficient of the water absorption–Al2O3 content correlation decreases with increasing temperature. At >1200°C, no trend is observed between the two parameters.
The tensile strength shows the weakest correlation with the Al2O3 content, which indicates that other parameters have to be considered. Samples DK13 to DK15 show similar tensile strengths, being the samples with the largest kaolinite contents (Fig. 11c). This might be explained by the microstructure after firing, which includes the intergrowth of mullite and quartz (and other minor components).
The firing colour of kaolins is important for some ceramic applications. Photographs of samples after firing at various temperatures are shown in Fig. 12. The red colour of sample DK23 is attributed to its high Fe2O3 content. The brightest colours were observed for the samples of the Kaédi deposit. The samples from Hassi Abyad turned darker after firing at 1200°C; this was not observed for the samples from Kaédi. Both deposits, however, contain raw materials with bright colours, and they might be used for sanitary ware. All of the raw materials might be used for the production of ceramics. The samples with a large Al2O3 content from Hassi Abyad may be suitable for the production of refractory materials. The bright-firing samples might be used for sanitary ware, tableware or as technical ceramics. The materials with greater Fe2O3 contents, such as sample DK23, are potentially suitable for the production of bricks and/or roof tiles. Selective mining considering the various quality-determining parameters would provide the possibility of producing a range of different ceramic products for a wide range of applications.
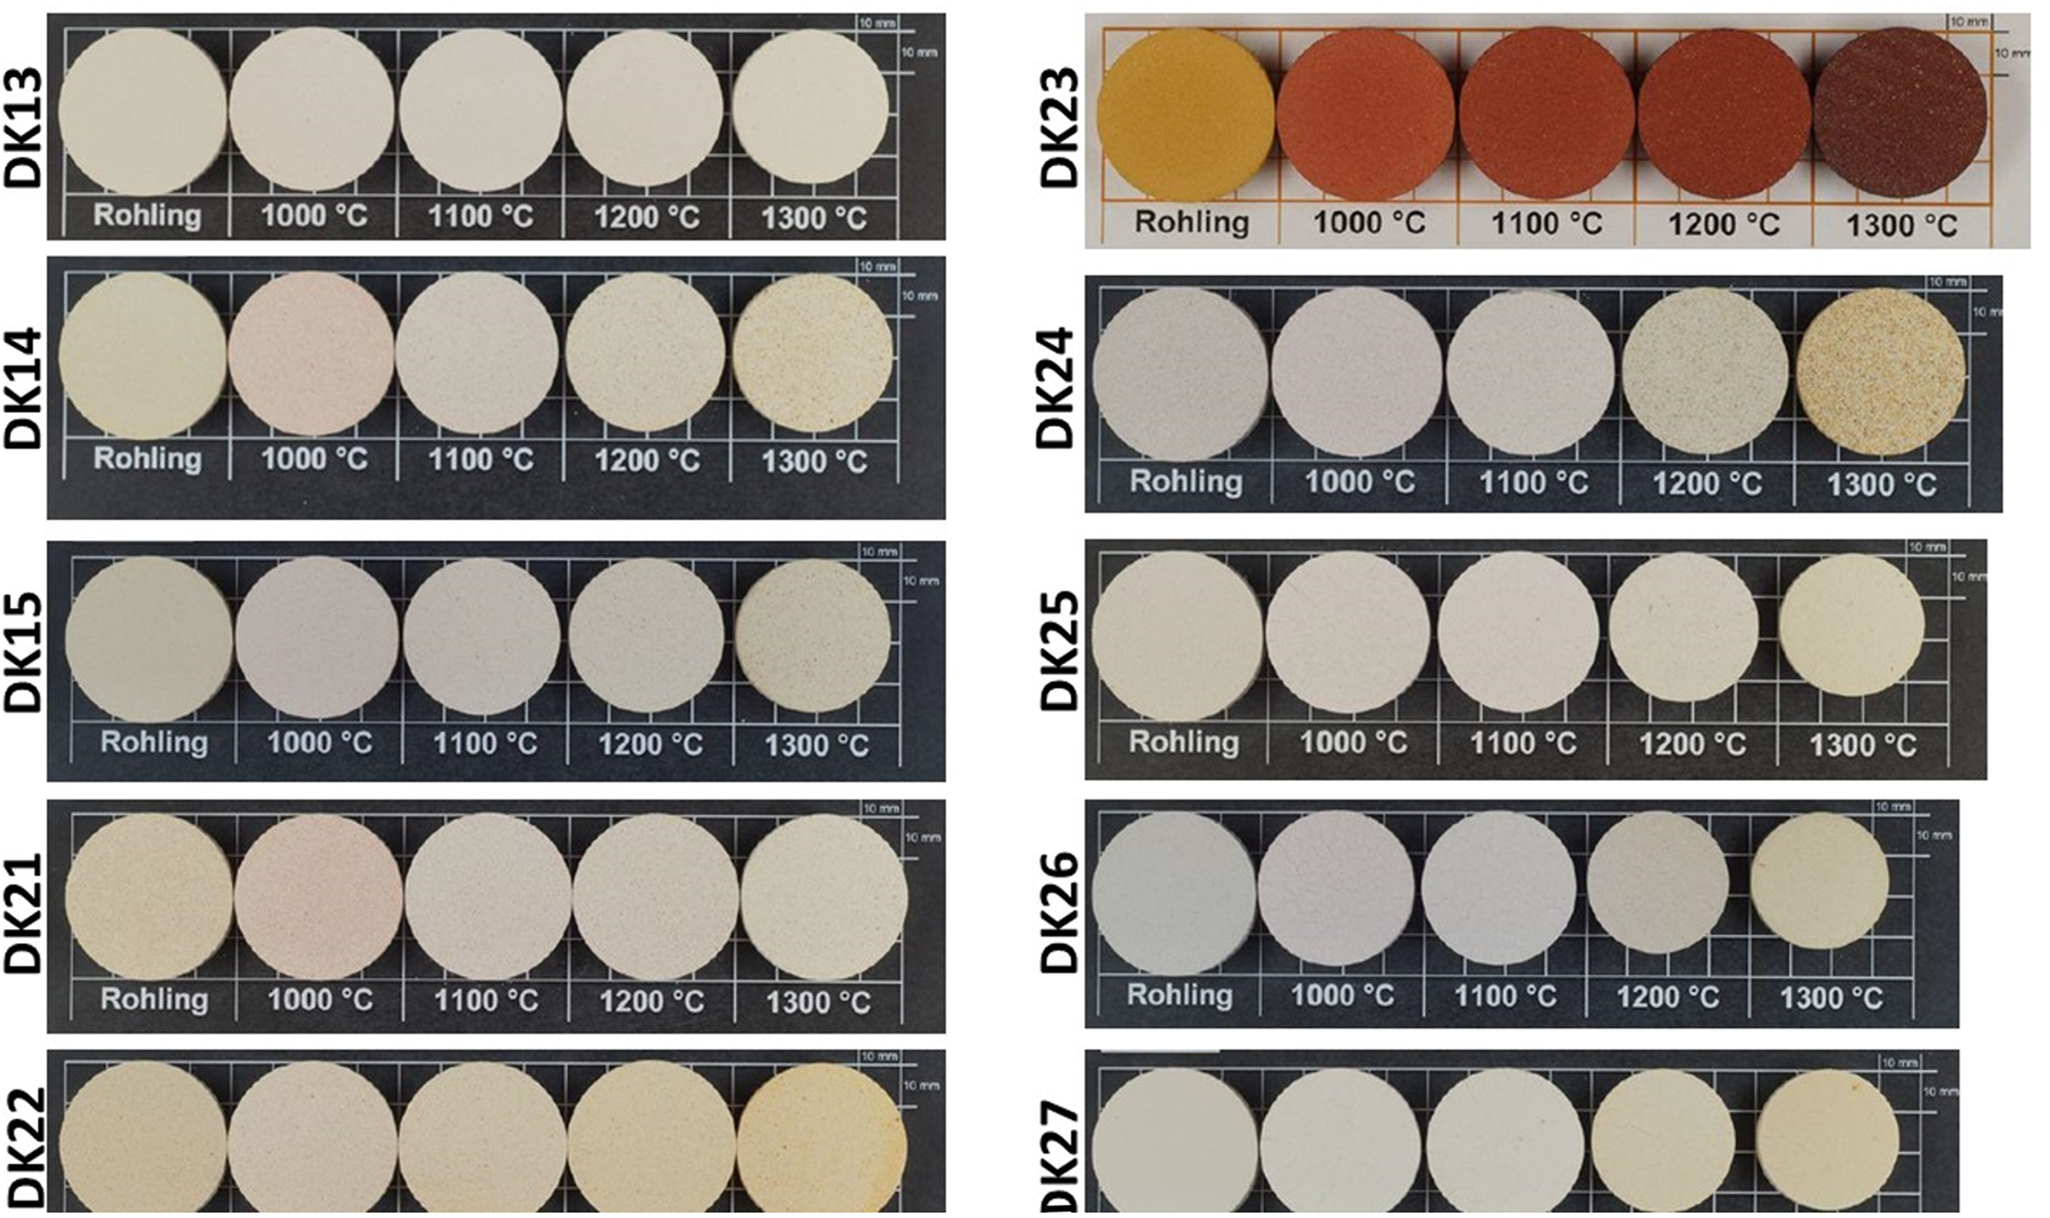
Fig. 12. Photographs of selected samples fired at various temperatures.
Conclusions
Kaolin occurrences from three different regions in southern Mauritania were investigated. The kaolins show variable Al2O3 contents between 9% and 38%, which correspond to kaolinite contents of 23–96%. Kaolinite contents are greatest at Hassi Abyad and in some of the occurrences from the Kaédi region (>25% Al2O3 or >63% kaolinite). Materials from the Néma region contained less kaolinite (<50 mass%). As this region is also more difficult to access, the mineralogical investigations focused on the kaolins from the occurrences of the Kaédi and Hassi Abyad regions.
The degree of structural order of the kaolinites was assessed using both XRD and IR spectroscopy. Both methods proved a generally greater degree of structural order of the samples from the Kaédi deposit, but also greater variability of kaolinites from this deposit. The samples from Hassi Abyad were all similar but generally showed a lower degree of structural disorder.
All of the raw materials could be used for the production of ceramics. Other possible applications (e.g. filler, refractories, glass, etc.) were not tested. However, based on the comparably high purity, particularly of the samples from Hassi Abyad, the materials may be suitable for other applications as well. For example, the samples with large Al2O3 contents from Hassi Abyad might be suitable for the production of refractory materials. The samples with bright firing colours might be used for fine ceramics such as sanitary ware, tableware or as technical ceramics. The materials with greater Fe2O3 contents, such as sample DK23, may be suitable for the selective production of bricks and/or roof tiles. Selective mining considering the various quality-determining parameters would provide the possibility of producing a range of different ceramic products for a range of applications.
Future work will be devoted to the systematic exploration of the deposit based on drilling, XRD and XRF investigations of >1000 samples. The results will allow for a preliminary feasibility study, including the possible use of blending beds and/or selective mining. Due to the large kaolinite content in some layers, the material might also be interesting as a reference clay for scientific purposes.
Financial support
The project was funded by the German Ministry of Economic Development and Cooperation (BMZ) in the framework of German–Mauritanian technical cooperation.