Since the turn of the twentieth century, clay minerals have been research tools for scientists due to their multiple intriguing properties (e.g. charged surface, molecular sieve structure and ion exchange character; Weber et al., Reference Weber, Heuser, Mertens and Stanjek2014; Arif et al., Reference Arif, Liu, Yousaf, Ahmed, Irshad and Ashraf2021). Layered double hydroxides (LDHs), with their two-dimensional (2D) sandwich-structure composed of a positively charged metal hydroxide host layer together with charge-balancing anions and water in the interlayer, are among the most common anionic clay minerals (Ma et al., Reference Ma, Wang, Islam, Liu, Ma and Kanatzidis2016; Suh et al., Reference Suh, Weon, Li, Wang and Kim2020). Due to their unique structure, the LDHs exhibit excellent properties, such as a tuneable composition, a high dispersion of cations and a large specific surface area, which endow LDHs with superior performance in photocatalysis, electrocatalysis and supercapacitors (Abderrazek et al., Reference Abderrazek, Uheida, Seffen, Muhammed, Srasra and Srasra2015; Gao et al., Reference Gao, Sun, Xu and Xiao2016; Hong et al., Reference Hong, Zhou, Xiong, Liu, Yao and Lai2019; Jing et al., Reference Jing, Zhu, Liu, Ma, Dong and Dong2019). Remarkably, LDHs have another prominent feature (i.e. ‘anion-exchange capacity’) that permits external anionic species in the solution to be inserted into the interlayer regions of the LDHs (Yang et al., Reference Yang, Wang and Wang2004; de Castro et al., Reference de Castro, Ferreira, Eulálio, de Souza, Novais and Novais2018). In view of these characteristics, the Fe3O4/MgAl-LDH has achieved high adsorption capacity for Congo red (253 mg g–1; Shan et al., Reference Shan, Yan, Yang, Yu, Hao, Yu and Du2014), and NiFe-LDH was used to remove methyl orange (MO) from water with a maximum adsorption of 323.6 mg g–1 (Hu et al., Reference Hu, Wageh, Al-Ghamdi, Yang, Tian, Cheng and Ho2020). Obviously, LDHs may serve as potential water purification agents for removal of anionic pollutants.
Recently, interest in LDHs has focused on tuning the 2D structure to a three-dimensional (3D) structure to enhance their adsorption capacity (Li & He, Reference Li and He2008; Jiehu et al., Reference Jiehu, Chunlei, Ming, Jie, Li and Xiuhong2020). In this context, hierarchical LDHs with 3D structures have been designed with greater specific surface areas and pore volumes than those of 2D LDHs (Sun et al., Reference Sun, Zhou, Cai, Zhao and Yuan2015; Zheng et al., Reference Zheng, Cheng, You, Yu and Ho2019). A novel hierarchically porous Fe3O4@MgAl-LDH was produced and used to eliminate Congo red, which exhibited superb adsorption capacity (813.0 mg g–1) compared with pure MgAl-LDH (Lu et al., Reference Lu, Li, Ng, Yang, Song and Zuo2017). Miao et al. (Reference Miao, Zhao, Zhang, Lei and Liu2021) prepared a hollow hierarchical porous CoMgAl-borate LDH for MO elimination with an extraordinary adsorption capacity of 990.1 mg g–1. In our previous work, we had successfully prepared an organic hierarchical LDH (HLDH) via a soft-template method using sodium dodecyl sulfate (SDS) as a template agent and intercalated anions (Zhang et al., Reference Zhang, He, Li, Zeng and Huang2019a). Interestingly, the SDS introduced not only changed the positive surface charge of the LDH to negative, but also rendered the surface hydrophobic (Bayram et al., Reference Bayram, Bucak and Ozturk2020). Numerous reports reveal that such an evolution is favourable for cationic pollutant removal with adsorbents (Lin et al., Reference Lin, Tran, Chao and Lee2018; Liu et al., Reference Liu, Yu, Wang, Zhu, Long and Li2021; Romero Ortiz et al., Reference Romero Ortiz, Lartundo-Rojas, Samaniego-Benitez, Jimenez-Flores, Calderon and Mantilla2021). Few comprehensive reports exist, however, on the utilization of HLDHs to remove various charged organics, or which focus on the underlying mechanisms.
In view of the fact that wastewaters contain numerous charged pollutants, an organic HLDH intercalated with SDS was employed here for the removal of two charged organic pollutants, namely methylene blue (MB; a cationic heteroaromatic compound) and MO (an anionic azo dye). Moreover, the response surface methodology (RSM), a powerful statistical technique to optimize the reaction parameters as well as to explore their interactions, was employed to reveal the adsorption performance based on central composite design (CCD) (Igwegbe et al., Reference Igwegbe, Mohmmadi, Ahmadi, Rahdar, Khadkhodaiy, Dehghani and Rahdar2019; Yuan et al., Reference Yuan, Zhang, Liu, Fu, Huang and Wang2020). The interaction mechanisms of the two variously charged dyes with the HLDH were further investigated via thermal analysis, Fourier-transform infrared (FTIR) spectroscopy, X-ray photoelectron spectroscopy (XPS), X-ray powder diffraction (XRD) and scanning electron microscopy (SEM). The results are expected to open up a new avenue for charged pollutant removal and to broaden the application of anionic clay minerals in water purification.
Experimental
Materials
Mg(NO3)2⋅6H2O, Al(NO3)3⋅9H2O, urea (CH₄N₂O), SDS, MB and MO of analytical grade were purchased from Aladdin and used without further purification. The physicochemical properties of the organics are shown in Table S1. Deionized water was used in all of the experiments.
Materials preparation
The HLDH was synthesized via a soft-template method (Zhang et al., Reference Zhang, Ouyang, Li, Huang and Frost2019b), with a molar ratio of Mg:Al:urea of 2:1:10 dissolved in 50 mL of deionized water (Solution A). Separately, 0.865 g SDS was dissolved in 30 mL of deionized water (Solution B). Thereafter, Solution B was immediately added to Solution A under stirring and was sonicated for 30 min. The homogeneous solution was transferred into a 100 mL Teflon-lined autoclave and heated at 150°C for 6 h. After air-cooling, the product was centrifuged, washed four times with water and ethanol and dried at 65°C overnight.
Batch experiment
Sorption isotherm experiments for MB and MO were carried out based on the RSM as described in the next section. A kinetic study was performed with an initial concentration of MB/MO of 100 mg/L at 25°C. The effect of solution pH was investigated within the pH range 3–11 adjusted by 1 M HCl and NaOH. The dosage of HLDH in all tests was 1.0 g L–1. The mixtures were stirred for 12 h at 150 rpm. After filtration through 0.45 μm membrane filters, the equilibrium concentrations of MB and MO were measured using an ultraviolet–visible spectrophotometer (UV-1600 spectrophotometer) at maximum absorbance wavelengths of 664 and 464 nm, respectively.
The adsorption of MB and MO on HLDH was determined using Eq. 1:

where q e (mg g–1) is the adsorption of MB and MO at equilibrium, V (L) is the volume of the MB and MO solution, C 0 and C e (mg L–1) are the initial and equilibrium concentrations of MB and MO, respectively, and m (g) is the mass of HLDH.
Central composite design-based RSM
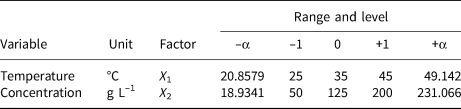
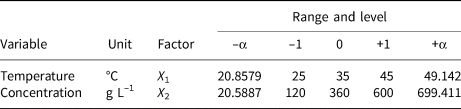
A two-factor and one-level CCD model was constructed to investigate the removal behaviour of MO and MB on HLDH. The coding limits and levels of selected variables (i.e. temperature and initial concentration) are listed in Tables 1 and 2, respectively. The actual experimental parameters are listed in Tables S2 and S3. The experimental data were evaluated using Design-Expert (8.0.6, trial version) software. Additionally, the accuracy of the CCD model was determined using analysis of variance (ANOVA) to avoid poor or ambiguous results, as is shown in Tables S4 and S5. The detailed analyses are shown in the Supplementary Information.
Table 1. Independent factors of MB and their levels used in the CCD model.

Table 2. Independent factors of MO and their levels used in the CCD model.

Preparation of HLDH_MB and HLDH_MO
For the synthesis of HLDH_MB, HLDH (1 g L–1) was added to 200 mg L–1 MB solution. The mixture was stirred at 150 rpm for 12 h. Subsequently, the solid phase was separated by filtration and dried at 65°C for 12 h. HLDH_MO was synthesized using a similar method, except for the initial MO concentration (1000 mg L–1).
Characterization of the end products
The FTIR spectra were obtained using a Bruker Tensor 27 spectrometer in the 4000–400 cm−1 range. Surface elemental compositions were identified using XPS (Kratos Axis ULTRA X-ray photoelectron spectrometer). Powder XRD was conducted using a D8 ADVANCE X diffractometer with Cu-Kα radiation (40 kV, 100 mA) at a scan speed of 4°2θ min–1 in the range 2–65°2θ. Scanning electron microscopy (JSM 6701F) was used to observe the morphology of the samples. Thermogravimetry and differential thermal analysis (TG-DTA) were performed using the NETZSCH simultaneous TG-DTA/differential scanning calorimetry (DSC) apparatus STA 449C/4/G Jupiter-QMS 403C Aeolos in the range 40–1000°C at a heating rate of 10°C min–1 in a pure N2 atmosphere. The pH values were monitored using an Elico digital pH meter (Model LI-120).
Results and discussion
Adsorption behaviour of MO and MB
The adsorption performance of HLDH towards MB and MO with various initial concentrations and temperatures was investigated using the RSM. The 2D contour plots and 3D response surfaces obtained are shown in Fig. 1. The adsorption of MB was maximal at high initial MB concentrations, but the amount of dye removed did not change as the temperature increased from 25°C to 45°C (Fig. 1a,c). In the case of MO, the amount removed was also maximal at high initial MO concentrations, but it increased with increasing temperature (Fig. 1b). The influence of the initial MO concentration on MO adsorption was greater than the influence of MB. Indeed, the density contour obtained for the initial MO concentration in the RSM was more pronounced than that of temperature (Fig. 1d). Both results demonstrated a more significant effect of the initial concentration on the MO adsorption, implying different removal pathways for MB and MO by HLDH (Zhang et al., Reference Zhang, Ouyang, Li, Huang and Frost2019b). Notably, the maximum adsorption capacities of MB and MO on HLDH at 25°C were 58.7 and 416.7 mg g–1, respectively, which are superior to those of the other adsorbents (Table S6).

Fig. 1. Adsorption capacities of (a, c) MB and (b, d) MO by the HLDH via the RSM. Conditions: adsorbent dosage for MB/MO = 1 g L–1; contact time = 12 h.
To evaluate the effectiveness of the HLDH for absorbing both dyes, kinetic experiments were performed at an initial MB/MO concentration of 100 mg L–1 (Fig. 2). The adsorption of MB rapidly reached equilibrium within 5 min, with the maximum adsorption being 44.4 mg g–1. In the case of MO, the adsorption was rapid in the first 60 min, and then gradually reached a plateau at 480 min (64.1 mg g–1). The rapid removal of MB compared to MO further illustrates the existence of different interaction mechanisms for the two charged dyes on HLDH.
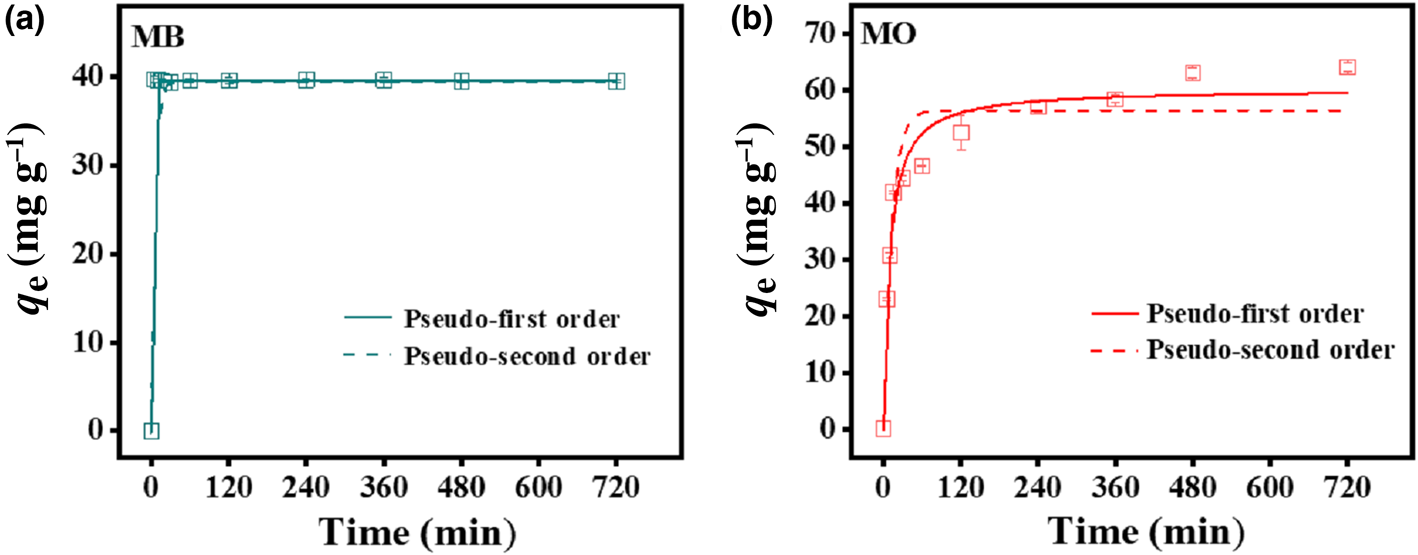
Fig. 2. Adsorption kinetics of (a) MB and (b) MO by the HLDH. Conditions: adsorbent dosage for MB/MO = 1 g L–1; concentration of MB/MO = 100 mg L–1; temperature = 25°C.
The effect of pH on the removal of MB and MO by HLDH is exhibited in Fig. 3. The adsorption of both dyes varied slightly over the pH range 3–9 and decreased at pH 11. This reduced adsorption amount might be associated with the unstable structure of LDHs in strong alkali environments (Xu et al., Reference Xu, Jin, Liu, Hao and Lu2008).
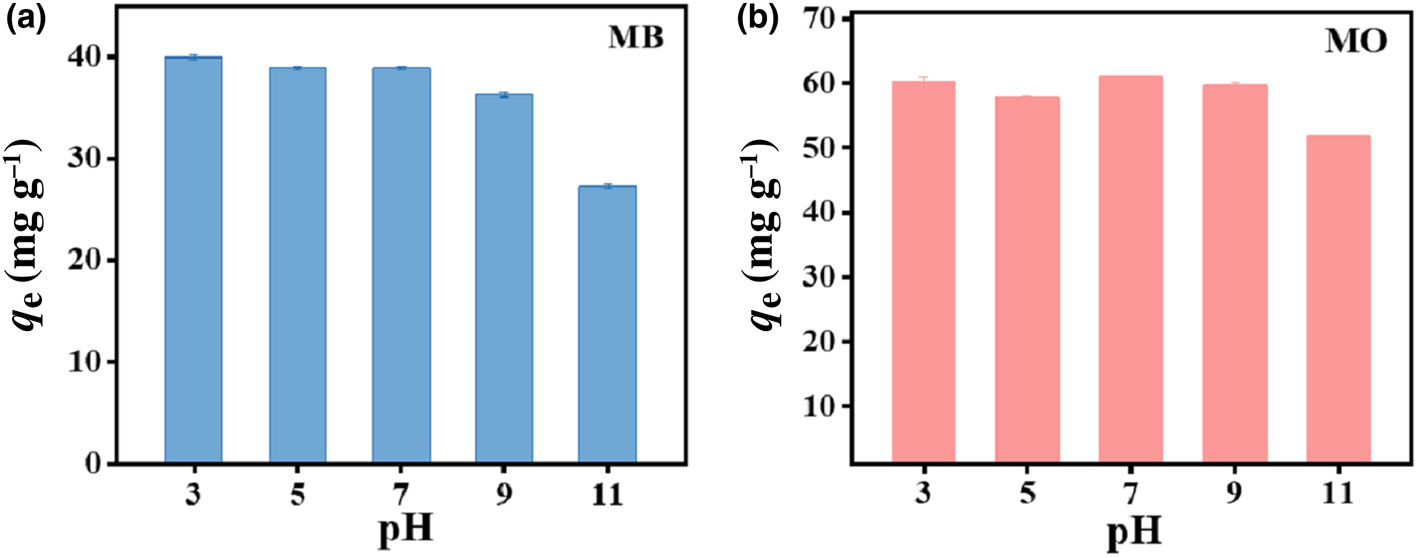
Fig. 3. Effect of pH on the absorption of (a) MB and (b) MO by HLDH. Conditions: adsorbent dosage for MB/MO = 1 g L–1; concentration of MB/MO = 100 mg L–1; temperature = 25°C.
In addition, the ζ-potential of the HLDH was examined to explore the reaction pathway. The ζ-potential remained negative across the whole pH range, suggesting a negative surface charge for the HLDH (Fig. S1). Given that MB and MO are cationic and anionic dyes in solution, respectively, it is reasonable to deduce that electrostatic attraction contributed to MB removal by HLDH, whereas electrostatic repulsion occurred in MO removal. However, the adsorption of MO (61.0 mg g–1) was superior to that of MB (40.9 mg g–1), suggesting that electrostatic interaction was not the only mechanism controlling the reaction process.
Adsorption isotherms
The Langmuir and Freundlich models were employed to fit the adsorption equilibrium data at various temperatures to help understand the interactions between the dyes and the HLDH. The forms of these models are expressed by Eqs 2 and 3, and the results are shown in Fig. 4 (Maneechakr & Karnjanakom, Reference Maneechakr and Karnjanakom2017).


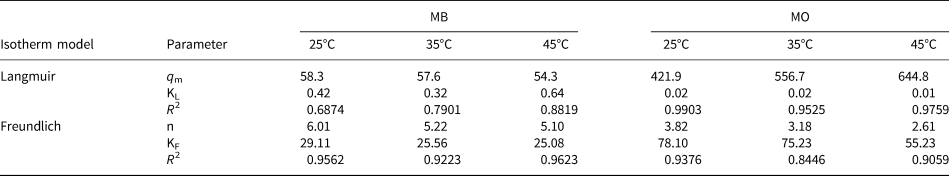
where q e (mg g–1) and C e (mg L–1) are the amounts of adsorption and the equilibrium concentration of MB or MO, respectively, KL (L mg–1) and qm (mg g–1) are the Langmuir constant and the maximum capacity of adsorption, respectively, and KF (L mg–1) and 1/n are Freundlich constants that relate to the adsorption amount and adsorption intensity, respectively. The relative parameter values extracted from the experimental data are listed in Table 3. By comparing the coefficients of determination (R 2), the Freundlich model was applicable for describing the removal of MB at all temperatures (R F2 > R L2), indicating that the multilayer adsorption occurred on the HLDH surface. In the case of MO, the Langmuir model better fitted the adsorption data, indicating a monolayer adsorption reaction for MO (Cui et al., Reference Cui, Zhang, Pearce, Chen, Zhang and Liu2019).
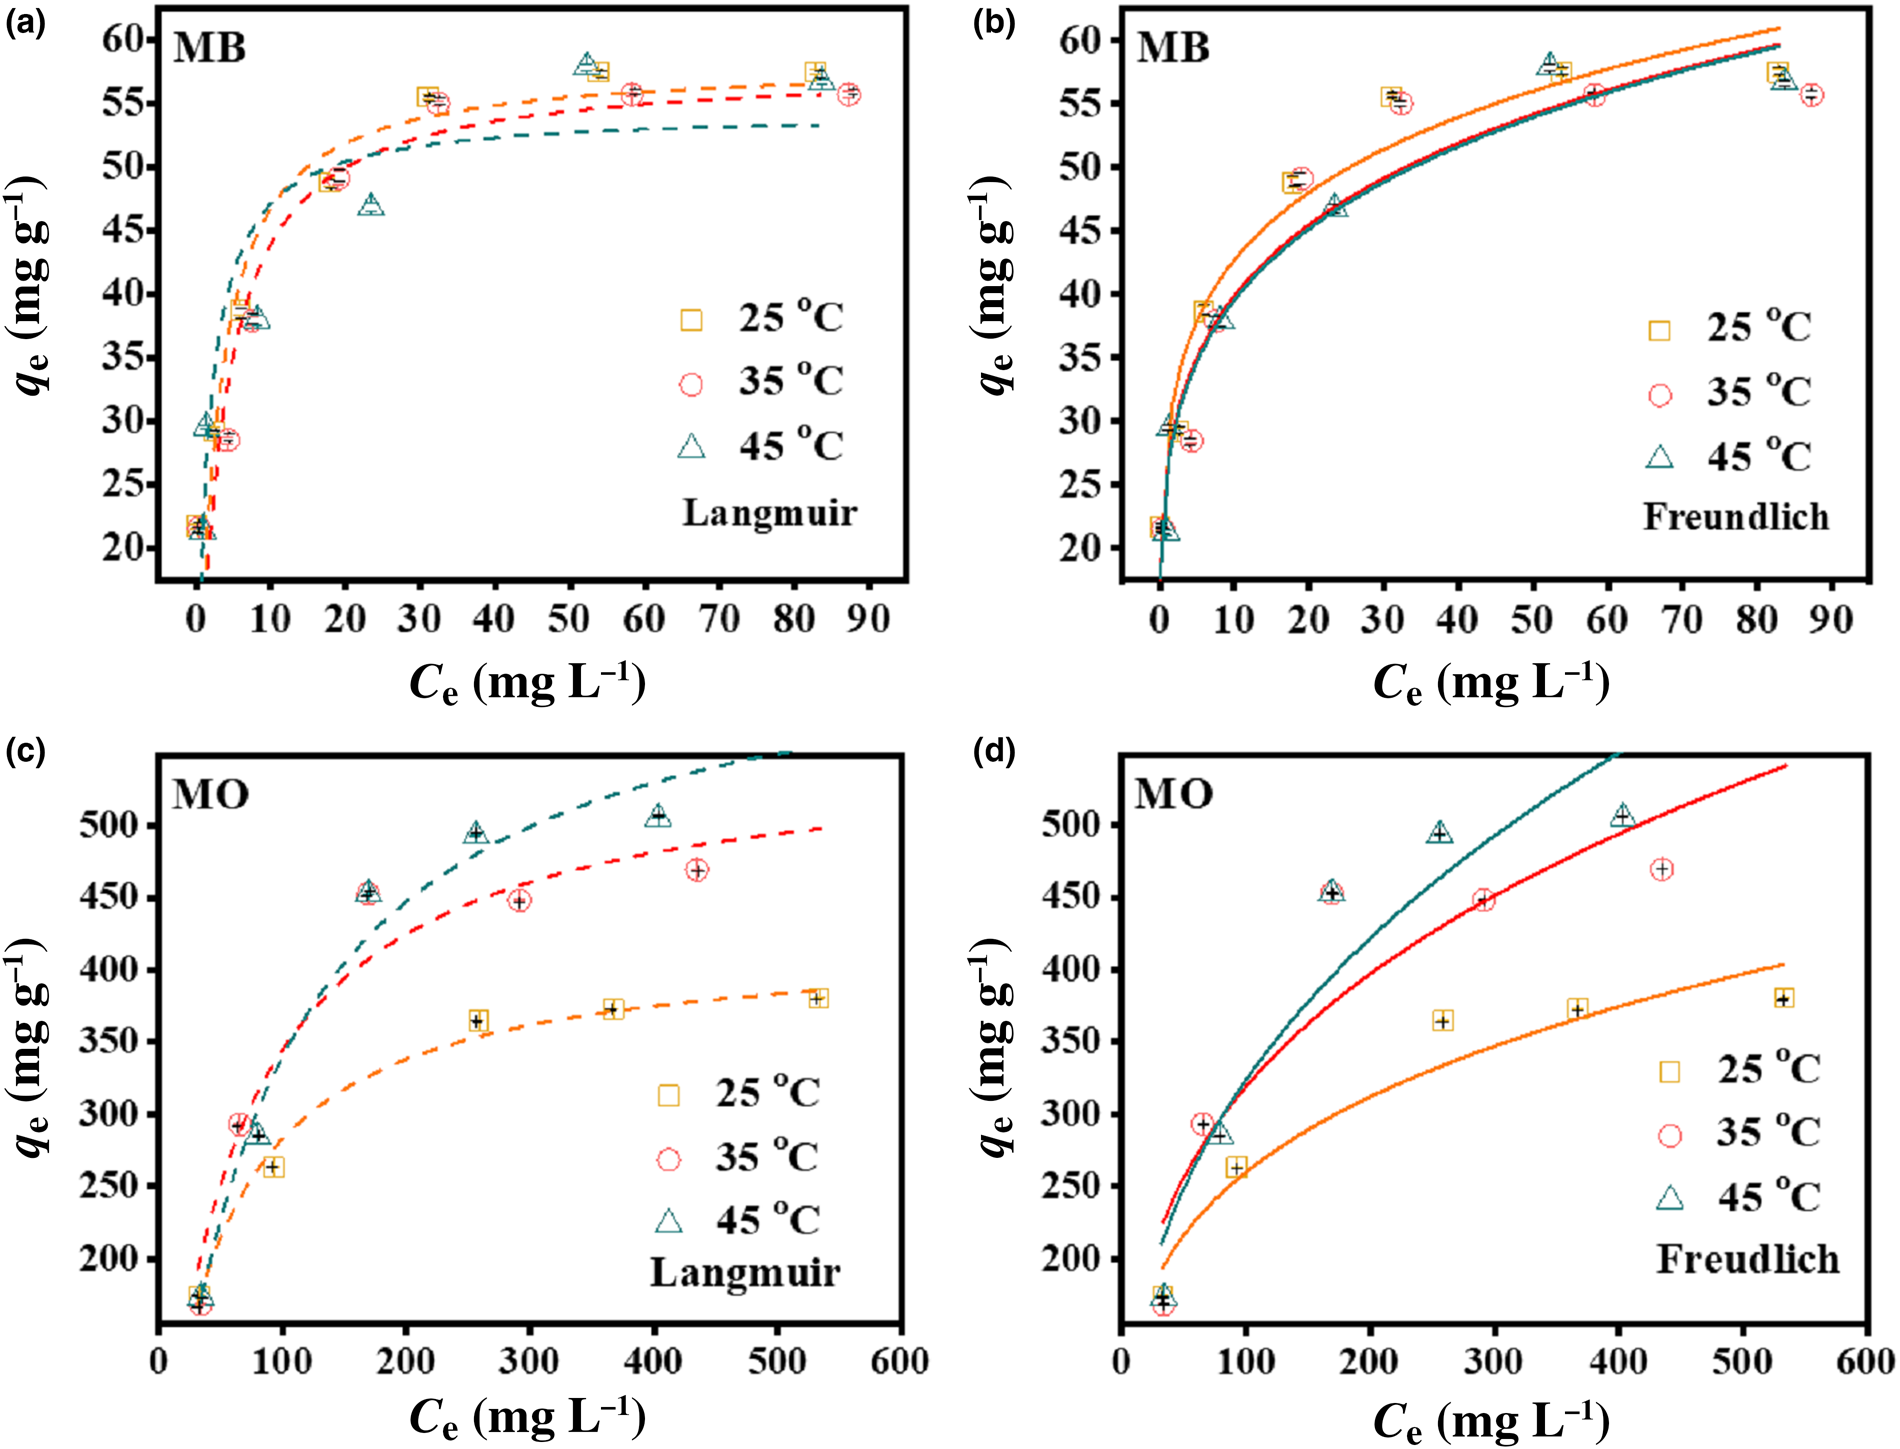
Fig. 4. Adsorption isotherms of MB and MO on the HLDH using (a, c) Langmuir and (b, d) Freundlich models. Conditions: adsorbent for MB/MO = 1 g L–1; contact time = 12 h; temperature = 25°C.
Table 3. Parameters fitted by the Langmuir and Freundlich models for MB and MO.
Adsorption kinetics
The pseudo-first order (Eq. 4) and the pseudo-second order kinetic models (Eq. 5) were adopted to examine the adsorption mechanism (Hu & Han, Reference Hu and Han2019):


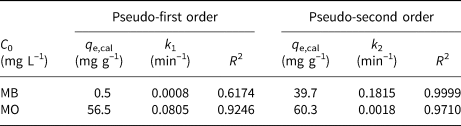
where q e and q t (mg g–1) are the amounts of dyes adsorbed on the HLDH at equilibrium and at time t (min), respectively, and k1 (min–1) and k2 (g (mg min–1)–1) represent the kinetic adsorption rate constants of the pseudo-first order and pseudo-second order models, respectively. The kinetic fitting results are shown in Fig. 2 and the parameters obtained are listed in Table 4. According to the R 2 values, the pseudo-second order kinetic model matched well with the adsorption of both dyes on the HLDH. Based on the assumption of a pseudo-second order kinetic model that chemical adsorption is the rate-limiting step of the adsorption process, it might be deduced that chemisorption was the main adsorption mechanism for both dyes (Guo et al., Reference Guo, Xu, Zhuo, Liu, Xu and Wang2018; Wang et al., Reference Wang, Song, Yuan, Li, Zhang and Gibson2019).
Table 4. Parameters fitted by the pseudo-first order and pseudo-second order kinetic models for MB and MO.

Adsorption mechanism
The different removal mechanisms of MO and MB on the HLDH were elucidated comprehensively by characterization of the solid products after reaction. Three major mass-loss stages are observed in the TG-DTA curve of the HLDH (Fig. 5a). The first mass-loss event before 210°C (23.88%) corresponds to the loss of adsorbed water (Zhou et al., Reference Zhou, Wu, Liu, Orpe, Liu and Xu2010). The second mass-loss event at 210–335°C (26.25%) is attributed to the decomposition of the SDS molecules in the interlayer (Chen & Song, Reference Chen and Song2013). The third mass-loss event at 335–577°C (8.04%) is assigned to the dehydroxylation of the HLDH layers, indicating the collapse of the layered structure of the HLDH during this stage (Zhang et al., Reference Zhang, Ouyang, Li, Huang and Frost2019b). After reaction, similar mass-loss stages were observed for both HLDH_MB and HLDH_MO (Fig. 5b,c), except for the greater mass-loss ratio due to organic molecules at 229°C. This phenomenon might be caused by the anchored organic dyes on the HLDH, which increased the organic content. This was also observed in SEM (Fig. 6) with the occurrence of stacked nanoflakes after removal of the dyes, and with the bands attributed to MO and MB in the FTIR spectra (Fig. 7). In addition, compared with the FTIR spectra of pure HLDH, the O–H band of the HLDH in the HLDH_MB and HLDH_MO shifted from 3506 to 3455 and 3479 cm–1, respectively. Previous studies have reported that a blue shift of the O–H band suggests electrostatic interaction (Shenvi et al., Reference Shenvi, Isloor, Ismail, Shilton and Al Ahmed2015) or hydrogen bonding (Zhao et al., Reference Zhao, Repo, Yin, Meng, Jafari and Sillanpaa2015). Combined with the ζ-potential analysis (Fig. S1), electrostatic attraction should contribute to MB removal, whereas hydrogen bonding occurred in MO removal.
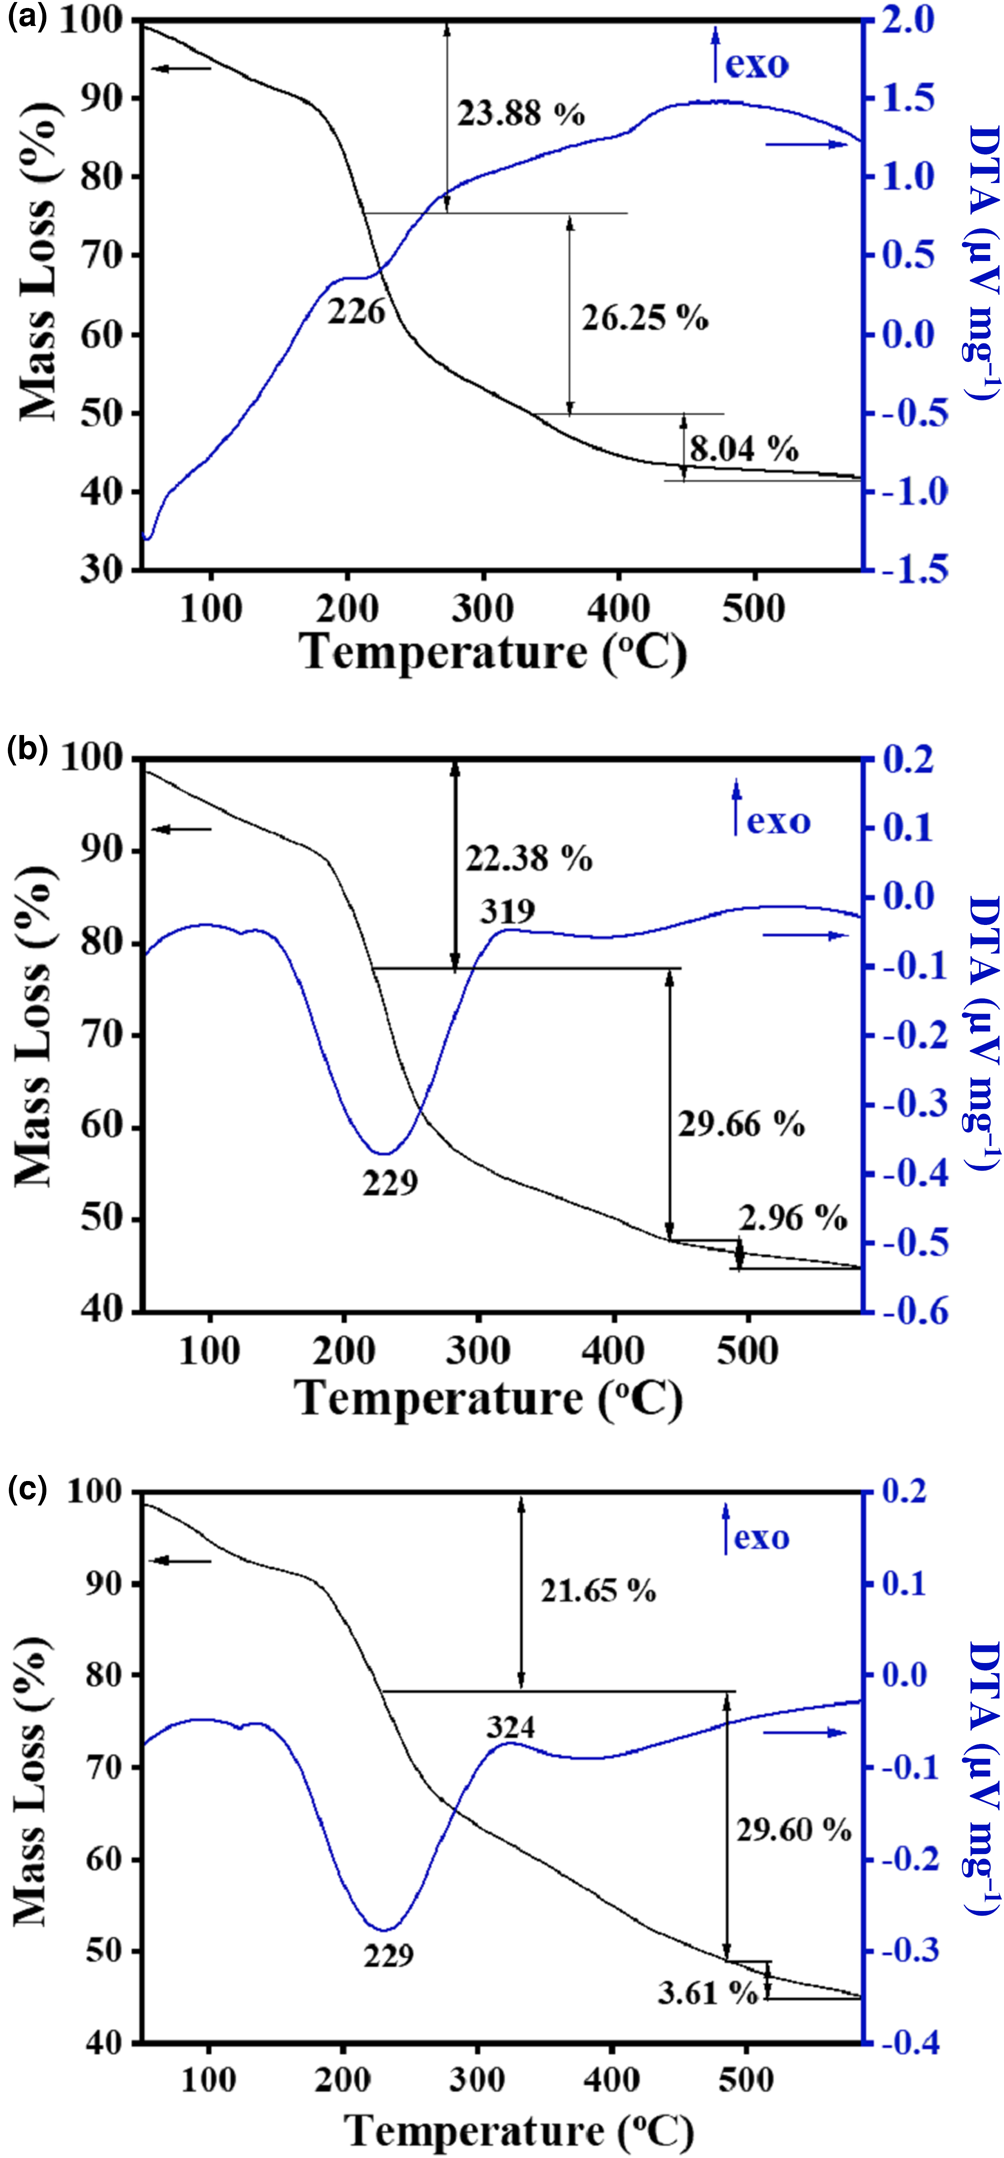
Fig. 5. TG-DTA curves of (a) HLDH, (b) HLDH_MB and (c) HLDH_MO.
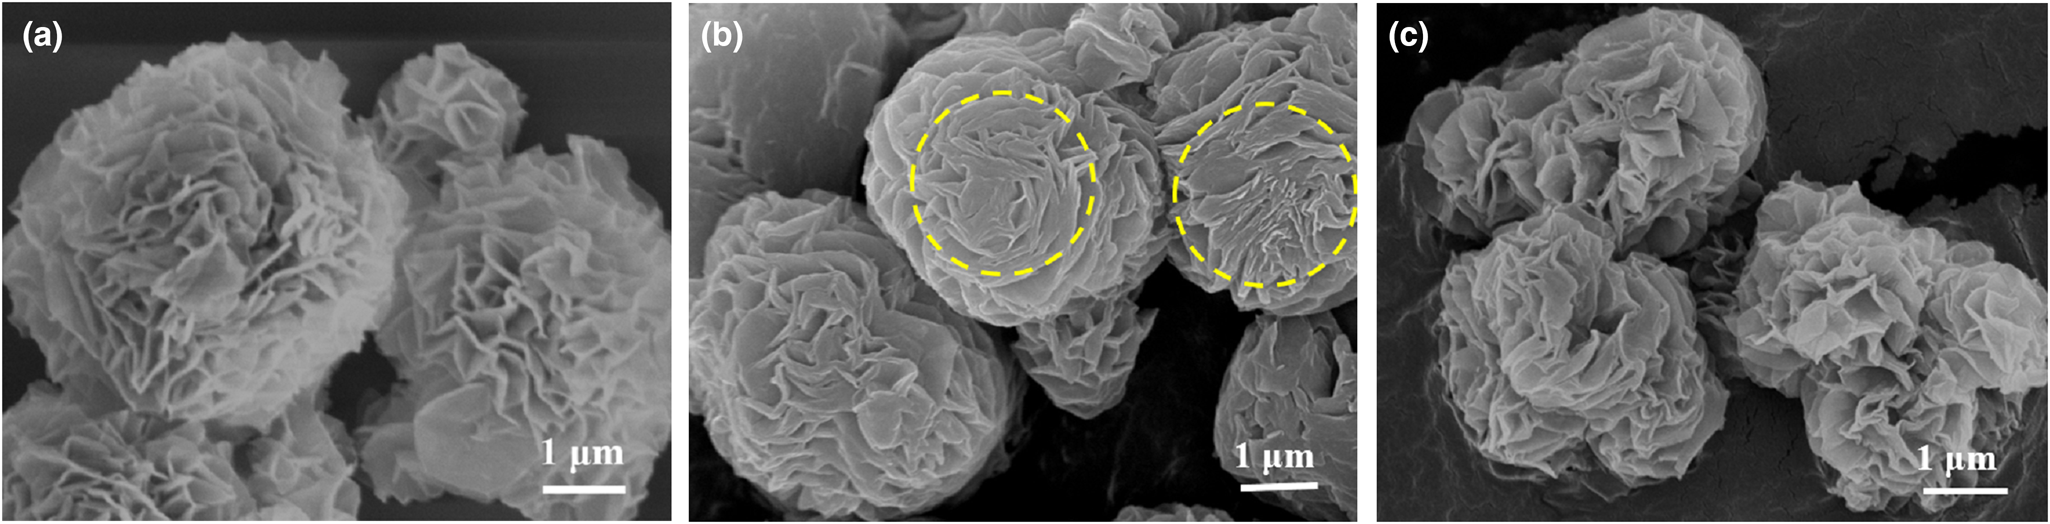
Fig. 6. SEM images of (a) HLDH, (b) HLDH_MB and (c) HLDH_MO.
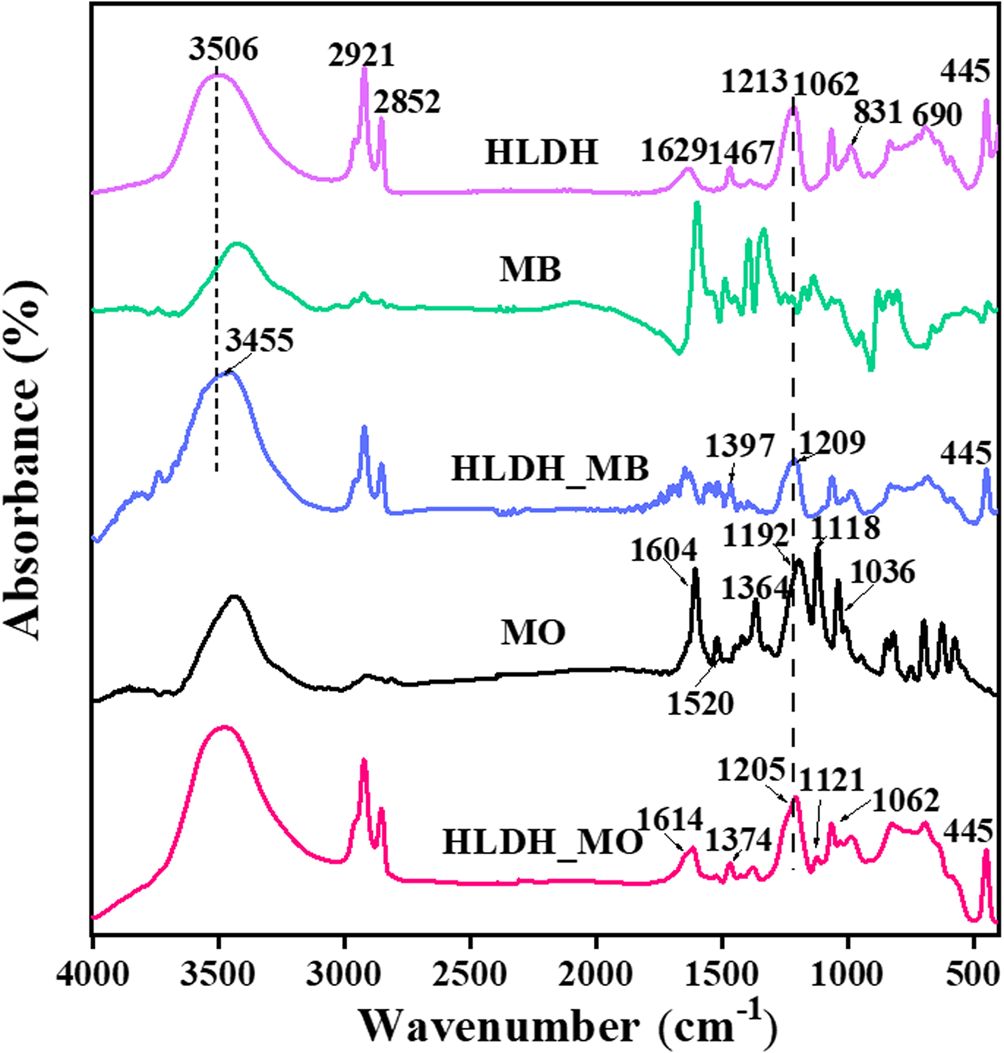
Fig. 7. FTIR spectra of HLDH, HLDH_MB and HLDH_MO
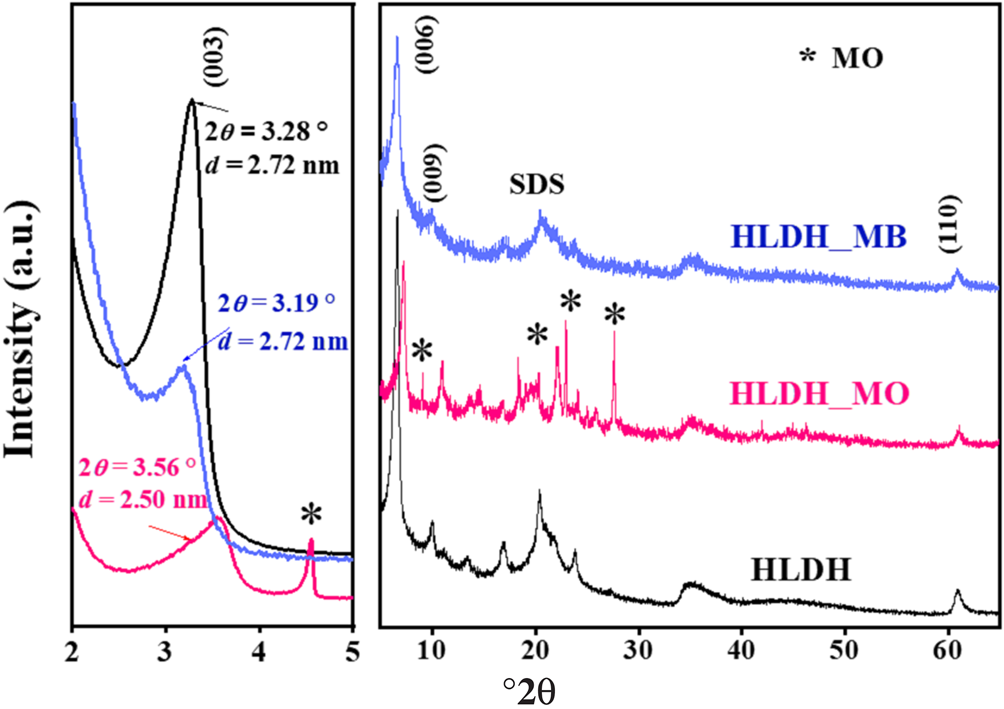
The XRD traces of the HLDH, HLDH_MB and HLDH_MO are shown in Fig. 8. In the HLDH, the (003), (006) and (009) peaks were observed at 3.28, 6.59 and 9.91°2θ, respectively. The corresponding d 003 basal spacing was 2.72 nm, suggesting the existence of intercalated SDS in the interlayer (Dou et al., Reference Dou, Fan and Zhang2015). After adsorption, the typical reflections of the LDH peaks were still visible, except for the shift of the (003) planes in the XRD traces of HLDH_MB and HLDH_MO (Fig. 8). In general, the shift of the (003) plane relates to the exchangeable ions in the interlayer (Deák et al., Reference Deák, Csapó, Juhász, Dékány and Janovák2018), suggesting that MO and MB entered the interlayer of the LDH. Notably, the d-value did not change after MB removal. As the chain length of MB (1.43 nm) is smaller than that of SDS (1.85 nm), we could infer that SDS and MB both existed in the interlayer, wherein MB could interact with SDS to form a monolayer (SDS-MB) via hydrophobic and electrostatic interaction (Milagres et al., Reference Milagres, Bellato, Ferreira, Guimarães, Tonon and Bolandini2019). In the case of MO, the d-value decreased after adsorption, indicating that MO replaced SDS via anion exchange in the LDH interlayer because the length of MO (1.35 nm) is smaller than that of the SDS chain (Zhang et al., Reference Zhang, Ouyang, Li, Huang and Frost2019b).

Fig. 8. XRD traces of HLDH, HLDH_MB and HLDH_MO.
The XPS analysis results of the solid products are presented in Fig. 9. After adsorption, the new N 1s peak belonging to MB and MO was observed in the XPS spectrum (Fig. 9a). As demonstrated by the S 2p spectra (Fig. 9b), the HLDH exhibited two peaks at 169.7 and 168.8 eV, which were assigned to the sulfate (RSO4) and physiosorbed sulfur of SDS species, respectively (Madec et al., Reference Madec, Xia, Petibon, Nelson, Sun, Hill and Dahn2014). After adsorption, an additional peak was observed at 164.8 eV, corresponding to the S 2p orbital electron peak of MB. The peak at 167.8 eV, ascribed to the RSO3 of MO (Salazar et al., Reference Salazar, Lach, Ruckerl, Baumann, Schimmel and Knupfer2016; Kumari et al., Reference Kumari, Khan, Chowdhury, Bhakta, Mekhalif and Hussain2020), is indicative of the successful capture of MB and MO on the HLDH. In addition, the binding energy of RSO4 was shifted in the spectra of the HLDH_MO and HLDH_MB, revealing that the chemical environment of SDS had changed due to the adsorption of the dyes. Moreover, red shifts of Mg 1s (Fig. 9c) and Al 2p (Fig. 9d) were observed after the removal of both dyes, illustrating that the electrodensity of the host layer had changed (Sun et al., Reference Sun, Zhang, Li, Li, Ao and Xue2021). Combined with the XRD and FTIR results, this phenomenon might be due to the fact that MO replaced SDS during anion exchange and then reacted with the host layer of the LDH via hydrogen bonding, while the cationic MB attached onto SDS via hydrophobic and electrostatic interactions, resulting in changes to the electrodensity.
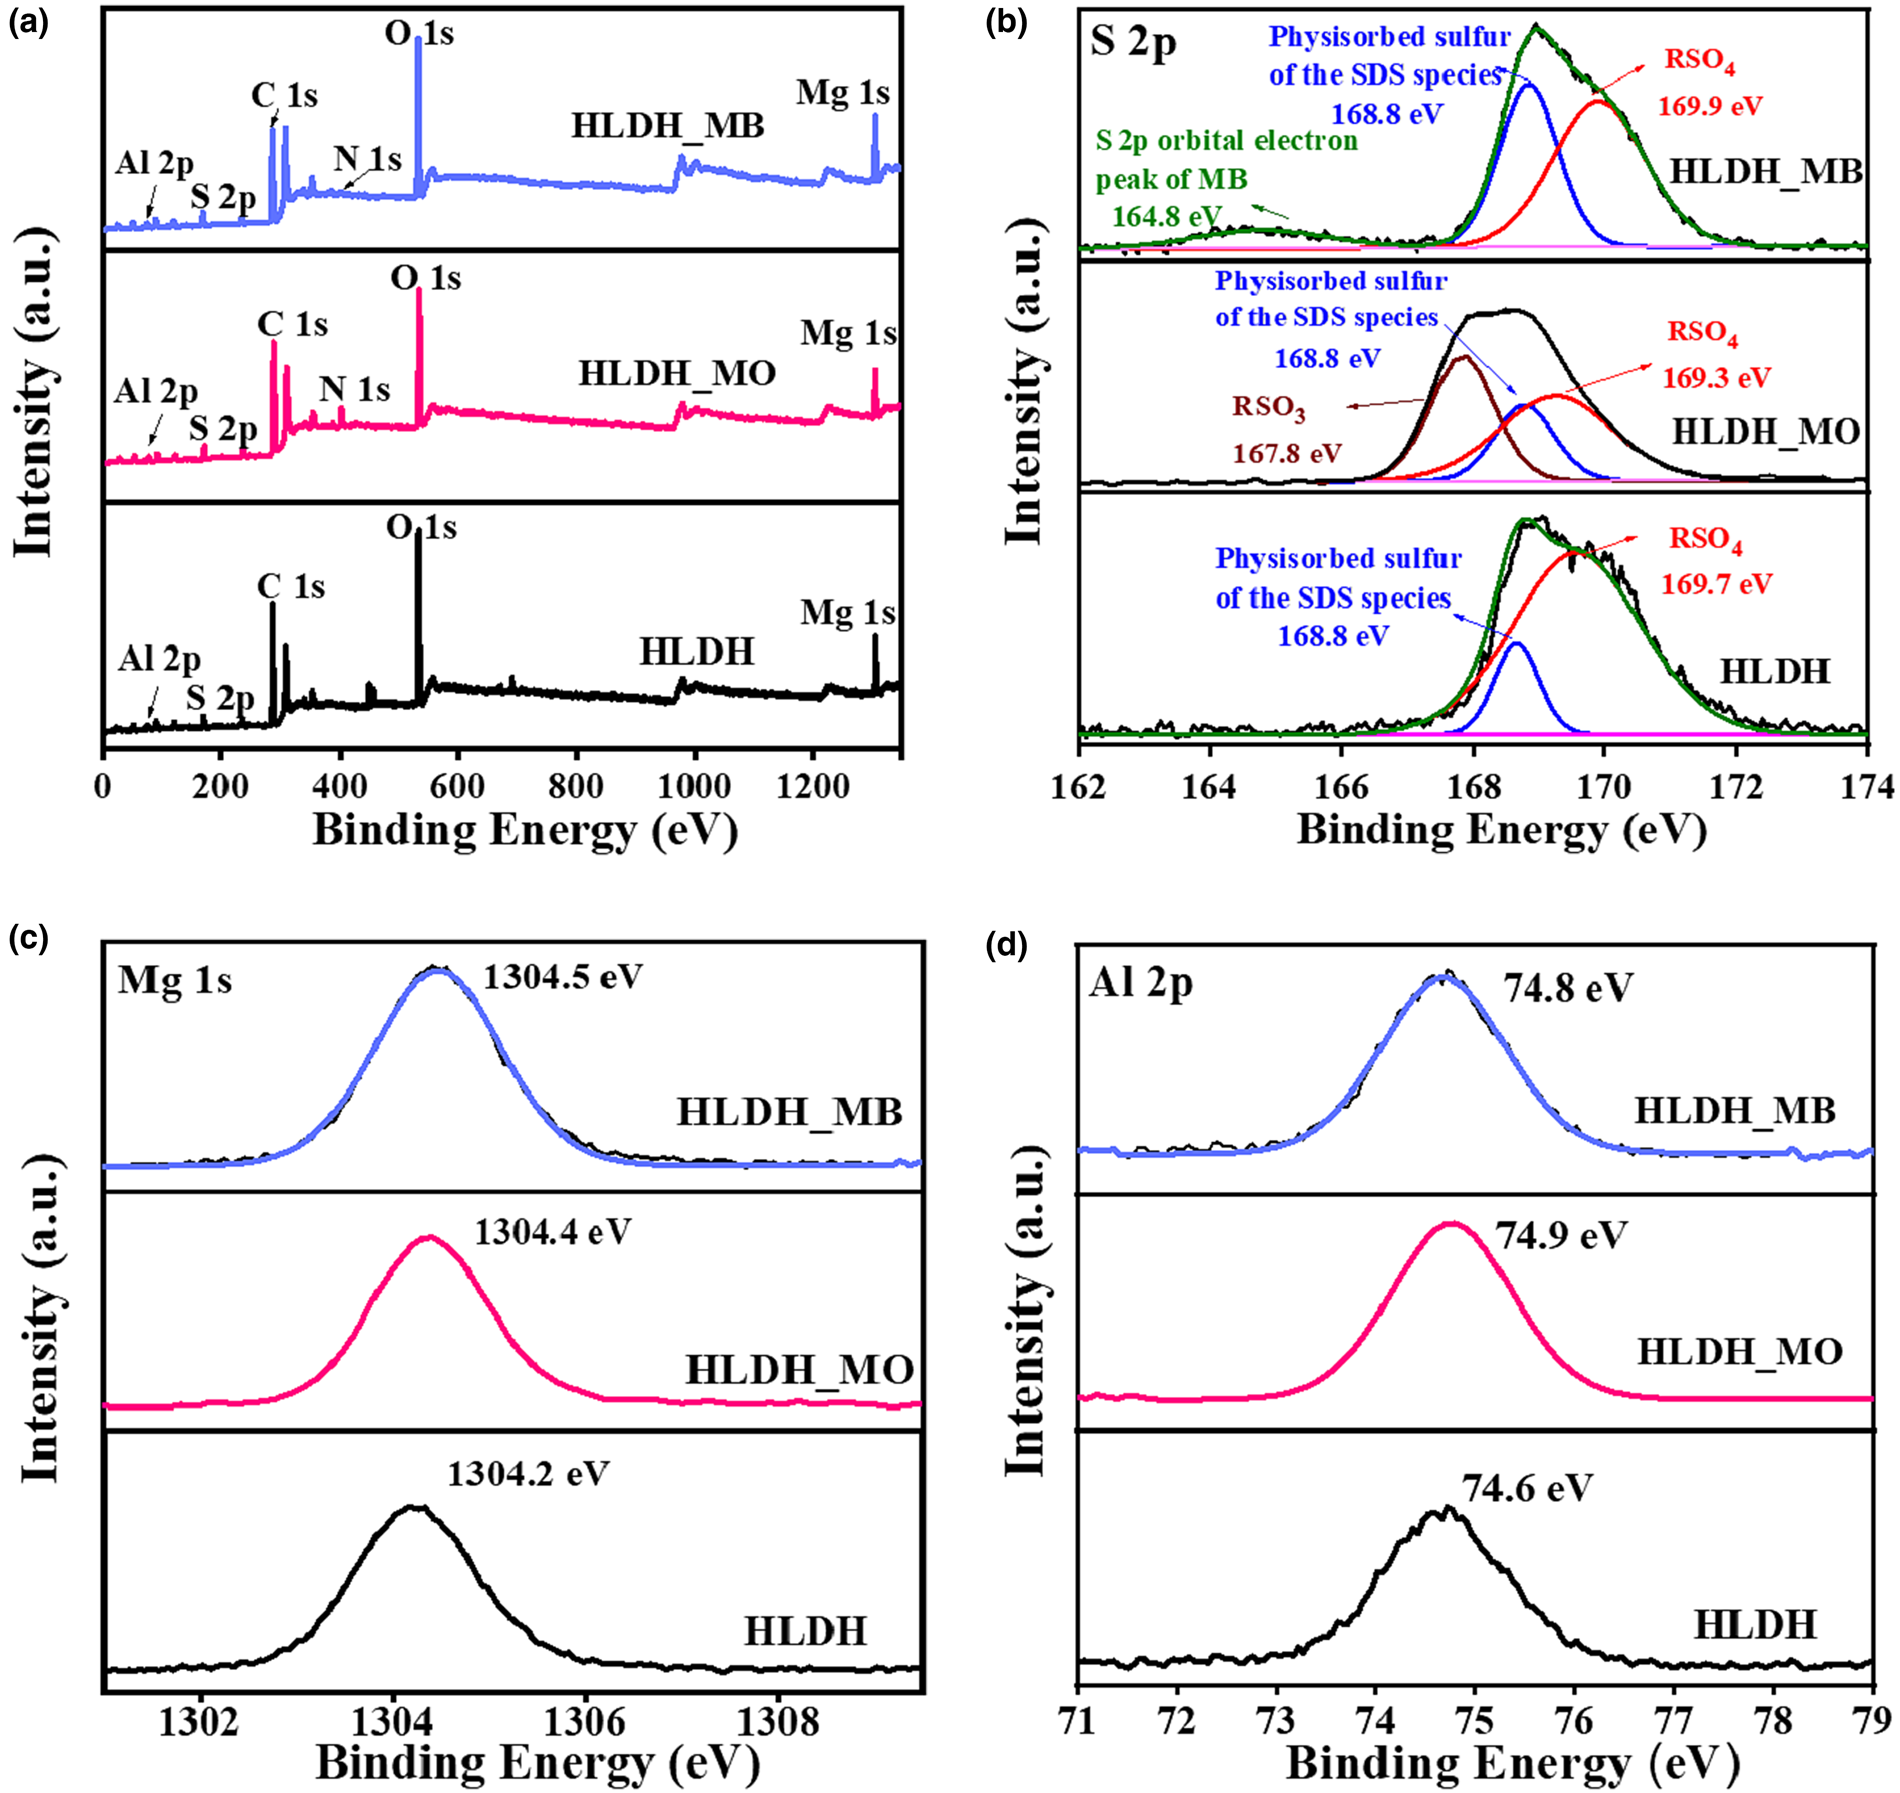
Fig. 9. XPS spectra of (a) wide scan, (b) S 2p, (c) Mg 1s and (d) Al 2p before and after removal of MB/MO on the HLDH.
Based on the above analyses, it is clear that SDS played vital role in the removal of anionic MO and cationic MB by the HLDH. The anionic MO replaced DS– via anion exchange and was intercalated into the HLDH interlayer. However, the strong affinity between MB and DS– led to the formation of a DS-MB monolayer, which promoted anchoring of MB on the HLDH, as is schematically depicted in Fig. 10.
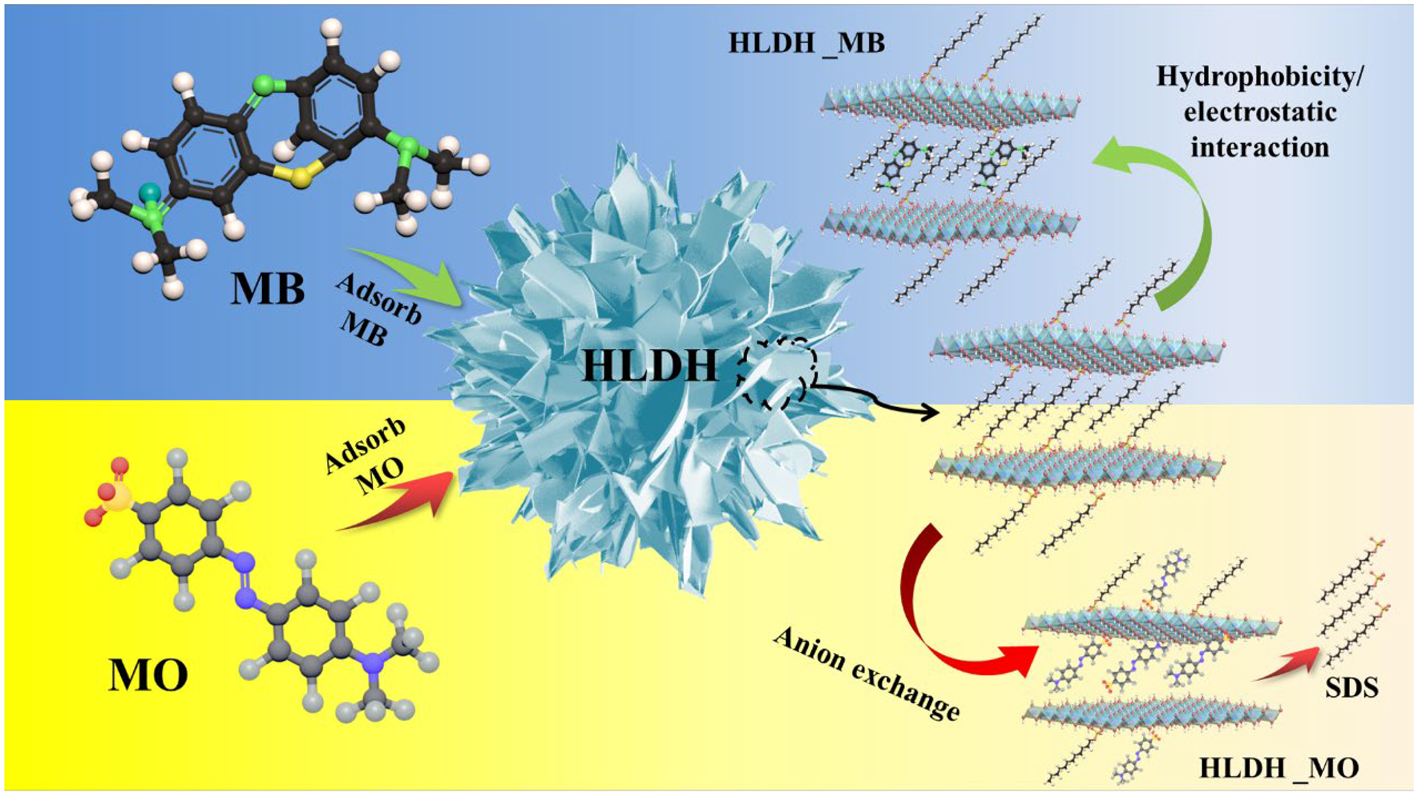
Fig. 10. Schematic illustration of MO and MB adsorption by the HLDH.
Conclusions
Hierarchical HLDH intercalated with SDS via a soft-template mechanism exhibited superior removal performance regarding MO and MB dyes. The adsorption of MO (421.9–644.8 mg g–1) was significantly higher than that of MB (58.3–54.3 mg g–1). Temperature strongly influenced the adsorption behaviour of MO, while it had a negligible effect on MB removal, implying different removal pathways for MO and MB by the HLDH. The kinetic studies demonstrated that the removal of both dyes was controlled by chemisorption, and this is attributed mainly to the SDS; that is, MO replaced DS– via anion exchange, whereas MB showed strong affinity to DS– via hydrophobic and electrostatic interactions, and both were eventually intercalated into the interlayer of the LDH. This work provides a theoretical guideline for the removal of charged dyes using HLDH and deepens our understanding of the removal mechanism.
Supplementary material
To view supplementary material for this article, please visit https://doi.org/10.1180/clm.2021.30.
Acknowledgements
The authors are grateful for the support of the Analysis and Test Center of Nanchang University for infrastructure and morphology characterizations.
Financial support
This project is financially supported by the National Nature Science Foundation of China No. 21767018, Major Discipline Academic and Technical Leaders Training Program of Jiangxi Province No. 2019BCJ22002 and Open Foundation of State Key Laboratory for Nuclear Resources and Environment No. NRE1901.