Modification of clay minerals by organic cations has received great interest because of the possibility of developing new materials with specific properties for new technological applications (e.g. polymer–clay nanocomposites, active sorbents (Li et al., Reference Li, Alessi, Zhang and Bowman2002; Lu, Reference Lu2004), drug release retardation from biocomposite hydrogels (Cojocariu et al., Reference Cojocariu, Profire, Aflori and Vasile2012), storage of radioactive waste (Kaufhold et al., Reference Kaufhold, Pohlmann-Lortz, Dohrmann and Nuesch2007), reinforcement of antimicrobial paper packaging improving its tensile strength (Soares et al., Reference Soares, Moreira, Fialho and Melo2012), pigment preparation (Buccella et al., Reference Buccella, Dorigato, Crugnola, Caldara and Fambri2015), flame-retardant materials (Teli & Kale, Reference Teli and Kale2012), etc.). Although natural clays have a high sorption affinity for cations, their ability to adsorb weakly polar, non-polar or anionic species in the interlayer space or on their surface is limited. Thus, their further modification (e.g. by exchanging inorganic/organic cations in the interlayer space) is desirable. In particular, montmorillonite (Mt), the most commonly used filler in nanocomposites, is a suitable candidate for modification because of its swelling capacity and ability to replace exchangeable cations. Montmorillonite is a naturally occurring mineral that consists of aluminosilicate layers. It is a member of the smectite group composed of two (SiO4)4– tetrahedral sheets sandwiching one (AlO6)9– octahedral sheet. The substitution of central cations in the octahedral and tetrahedral sheets produces a negative charge of the Mt layers. Thus, to compensate this negative charge, hydrated cations such as Na+, K+, Mg2+ or Ca2+ are present naturally in the interlayer space (Brigatti et al., Reference Brigatti, Galán, Theng, Bergaya, Theng and Lagaly2006). These cations may be replaced quite easily by other types of cations in an intercalation process, leading to a modification of the hydrophilic/hydrophobic ratio of smectite surfaces if, for example, organic cations such as alkylammonium cations are used for intercalation into the interlayer space. Such modification may enhance the capacity of smectites to retain, for example, non-polar organic species (Kukkadapu & Boyd, Reference Kukkadapu and Boyd1995; Lagaly, Reference Lagaly, Bergaya, Theng and Lagaly2006). More recently, closer attention has also been paid to phosphonium-based organic cations, which might be used to prepare organoclays with improved properties and greater stability than the conventional alkylammonium cations (Xie et al., Reference Xie, Xie, Pan, Hunter, Koene, Tan and Vaia2002; Calderon et al., Reference Calderon, Lennox and Kamal2008; Blundell & Licence, Reference Blundell and Licence2014; Carvalho et al., Reference Carvalho, Ventura, Batista, Schroder, Goncalves, Esperanca, Mutelet and Coutinho2014).
Depending on the type and amount of the organic cation used in the intercalation process, various arrangements of the surfactant in the interlayer space and also on the surface may be obtained, ranging from monolayers to bilayers or even pseudo-trilayers (Heinz et al., Reference Heinz, Vaia, Krishnamoorti and Farmer2007; Naranjo et al., Reference Naranjo, Molina, Ling Sham and Farfan Torres2015; Schampera et al., Reference Schampera, Tunega, Solc, Woche, Mikutta, Wirth, Dultz and Guggenberger2016). The use of organoclays prepared by alkylammonium salts to prepare polymer–clay nanocomposites may be limited by the organoclay properties. For instance, the alkylammonium salts decompose at ~170–180°C, and corresponding organoclays are not suitable for preparing materials used in high-temperature processing techniques (Wang et al., Reference Wang, Sun, Hao, Du and Pan2014). On the other hand, Mt modified with quaternary phosphonium ions has better thermal stability than its quaternary ammonium-modified analogues (Xie et al., Reference Xie, Xie, Pan, Hunter, Koene, Tan and Vaia2002; Hedley et al., Reference Hedley, Yuan and Theng2007; Alves et al., Reference Alves, Rosa and Morales2016). Similarly, vermiculite, another reinforcing filler in the polymer matrix, intercalated with tetrabutylphosphonium cation enhanced the thermal resistance, the Young modulus and the biodegradation rate of the polymer composite (Oliveira et al., Reference Oliveira, China, Oliveira and Leite2015). The phosphonium organoclay exfoliates better in polyamide than the corresponding ammonium organoclay in spite of its smaller surface coverage. The reinforcing effect of the clays was assessed quantitatively and the results showed that two factors determine the extent of reinforcement: contact surface and the strength of interaction (Naveau et al., Reference Naveau, Dominkovics, Detrembleur, Jerome, Hari, Renner, Alexandre and Pukanszky2011).
Knowledge of the structures and properties of organoclays is essential for their potential application. Prepared organo-montmorillonites are often characterized by spectroscopic (Madejová et al., Reference Madejová, Pentrák, Pálková and Komadel2009, Reference Madejová, Pálková, Komadel, Yarwood, Douthwaite and Duckett2010) and microscopic methods (Ghaffari et al., Reference Ghaffari, Ehsani and Khonakdar2014). Study of hydrated organoclays with 13C magic-angle spinning (MAS) nuclear magnetic resonance and near-infrared (IR) spectroscopy confirmed the presence of residual water in the vicinity of the cation head groups (Pálková et al., Reference Pálková, Hronsky, Bizovska and Madejová2015). The configuration of the surfactant used has a significant influence on its location and arrangement after loading, which consequently affects the thermal stability and the further microstructural evolution of the organoclay (Zhu et al., Reference Zhu, Shen, Ma, Ma, Zhou, Yuan, Liu and He2012).
Because of the complex structure of the studied organoclays, some important factors remain unknown. In addition to experimental methods, molecular simulation may be used in the investigation of organoclays to obtain molecular-scale details regarding their structure and properties. For example, good agreement with experimental data was obtained for the relationship between the thickness of the interlayer space and the size of the intercalated cation predicted by classical force-field molecular dynamics simulations (Heinz et al., Reference Heinz, Vaia, Krishnamoorti and Farmer2007). Force-field molecular dynamics simulations on hectorite clay confirmed that this mineral is able to accommodate the bulky Eu-TBP complex into the interlayer space in a form of charged complex or as a neutral trinitrate (Hartzell et al., Reference Hartzell, Cygan and Nagy1998). Force-field-based Monte Carlo simulations of organically modified Mt were used to study the arrangement of the tetraphenylphosphonium ion (TPP+) in the expanded interlayer space and on the external surface of Na-Mt. Segregation of organic and inorganic species on the opposite basal surfaces of Mt was shown and good agreement with experimental results was obtained (Jeschke & Meleshyn, Reference Jeschke and Meleshyn2011). From the molecular simulation methods, quantum chemistry-based methods are used much less frequently, mainly due to their limited applicability in large systems containing hundreds of atoms.
Only a few papers exist on the use of quantum chemistry methods for the simulation of organoclays. For example, tetramethyl, tetraethyl, tetrapropyl and tetrabutyl cations intercalated with Mt were studied at the level of density functional theory (DFT; Scholtzová et al., Reference Scholtzová, Tunega, Madejová, Pálková and Komadel2013, Reference Scholtzová, Madejová and Tunega2014). The theoretical results obtained provided detailed characterization of the arrangement and bonding of small tetraalkylammonium cations in the Mt interlayer space. Moreover, the calculated vibrational density of states helped to interpret the experimental IR spectra, specifically for distinguishing the stretching modes of the –CH3 and –CH2 groups. The structural and Fourier-transform IR (FTIR) studies of the 1–4-butylammonium-Mt organoclays and DFT-calculated interaction energies as a measure of the intercalate stability showed that the Mt intercalated with the 1-butylammonium cation has the highest stability (Scholtzová et al., Reference Scholtzová, Madejová, Jankovič and Tunega2016).
The present work provides an explanation of the differences in the structure and stability of organoclays prepared from the TBA cation and its phosphonium equivalent, the TBP cation. The models used are based on the Mt structure intercalated with the organic cation. The arrangement and interactions of organic cations with the external Mt basal surface are evaluated as well. The molecular modelling study is based on the DFT method combined with molecular dynamics (ab initio molecular dynamics, AIMD) and is complemented by FTIR measurements of the TBP-Mt sample.
Materials and methods
Na-montmorillonite separated from the SAz-1 bentonite (Cheto, AZ, USA) obtained from the Source Clays Repository of The Clay Minerals Society was used for the experimental study. The structural formula Na1.22K0.01(Al2.59Fe0.16Mg1.26)(Si8.0)O20(OH)4 × nH2O confirmed substitutions only in the octahedral sheets. Organo-montmorillonites were prepared by cation-exchange reactions. Details on the synthesis, X-ray diffraction (XRD) and FTIR measurements may be found in Pálková et al. (Reference Pálková, Jankovič, Zimowska and Madejová2011) for TBA-Mt and Pálková et al. (Reference Pálková, Zimowska, Jankovič, Sulikowski, Serwicka and Madejová2017) for TBP-Mt.
Structural models
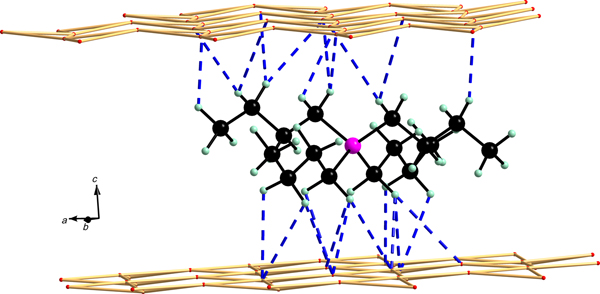
Generally, clay minerals are characterized by isomorphic substitutions of the central cations in the tetrahedral and/or octahedral sheets. Usually for the construction of structural Mt models for modelling, certain simplifications are necessary. The structural models of the Mt-based intercalates used in the calculations have a composition that is similar to layers of Wyoming-type Mt, possessing only Mg2+ substitution for Al3+ and without the presence of Fe3+ cations in the octahedral sheets. This simplification was in accordance with the composition of the SAz-1 Mt used for the preparation of the organoclay samples (Scholtzová et al., Reference Scholtzová, Madejová and Tunega2014). Details of the construction of the structural model of TBA-Mt were presented in a previous work (Scholtzová et al., Reference Scholtzová, Madejová and Tunega2014). The initial model of the TBP-Mt intercalate was prepared analogously simply by replacing N for P (Fig. 1). This model represents the tetrahedral configuration of the organic cation placed in the interlayer space with maximum thickness. Owing to the size of the organic cations, the computational cell for the TBX-Mt models (X = A (ammonium) or P (phosphonium)) had a size of 4a4bc of the original Mt unit cell, with initial lattice vectors a = 20.966 Å, b = 18.176 Å and c = 20.700 Å. Furthermore, for the study of the adsorption of organic cations on the (001) surface, slab models were prepared imposing a vacuum of a thickness of ~20 Å (c = 35 Å). Cations were placed above a ditrigonal hole in the tetrahedral sheet of one Mt layer in the computational cell. Two initial surface adsorption models were assumed: in the first model, the organic cation had a similar initial orientation as in the initial intercalated TBA-Mt/TBP-Mt model (Fig. 1). The second model was prepared from the optimized structure of the corresponding intercalate (Fig. 2) simply by expanding the c vector and imposing vacuum.

Fig. 1. Initial models of TBX-Mt intercalates (X = A or P) with the TBP-Mt model as an example. Colour coding of elements: magenta = phosphorus, black = carbon, light green = hydrogen.

Fig. 2. Optimized structure of TBX-Mt intercalates (X = A or P). The hydrogen bond scheme (dashed lines) corresponds to the TBP-Mt model. Colour coding of elements: magenta = phosphorus, black = carbon, light green = hydrogen.
Computational details
Density functional theory calculations were performed using the Vienna Ab Initio Simulation Package (VASP) program (Kresse & Hafner, Reference Kresse and Hafner1993; Kresse & Furthmuller, Reference Kresse and Furthmuller1996). The exchange-correlation energy was expressed in the framework of the generalized gradient approximation using the DFT function proposed by Perdew, Burke and Ernzerhof (Perdew et al., Reference Perdew, Burke and Wang1996). The Kohn–Sham equations were solved using the variational method in a plane-wave basis set with an energy cut-off of 500 eV. The electron–ion interactions were described using the projector-augmented wave method (Blochl, Reference Blochl1994; Kresse & Joubert, Reference Kresse and Joubert1999). Brillouin-zone sampling was restricted to the Γ-point due to the large computational cells. The atomic positions were relaxed together with the unit-cell parameters. No symmetry restrictions were applied during any relaxation procedure. The relaxation criteria were 10−5 eV/atom for the total energy change and 0.005 eV/Å for the maximum force acting on any atom.
Normal modes of vibration were calculated within the fixed optimized cell using a finite-difference method and harmonic approximation. The Hessian was constructed from single-point energy calculations on the 6N structures generated from the optimized structures by displacing each of the Nth atoms in the cell in positive and negative directions along the three Cartesian directions x, y and z (Hafner, Reference Hafner2003).
The calculations were also complemented by AIMD simulation to obtain additional information about the vibrational dynamics of C–H stretching modes. Owing to the computational demands of AIMD, the energy cut-off was reduced to 400 eV and the required convergence in total energy was reduced to 10−4 eV. The Verlet velocity algorithm (Ferrario & Ryckaert, Reference Ferrario and Ryckaert1985) with a time step of 1 fs was chosen for the numerical solution of the equations of motion. First, the finite-temperature calculations were performed on a canonical NVT ensemble (constant number of particles, N, constant volume, V, and constant temperature, T) applying the Nosé–Hoover thermostat procedure (Nosé, Reference Nosé1984) at the simulation temperature of 300 K in order to equilibrate the structure and using the molecular dynamics (MD) length of 5 ps. Then, the system was changed to microcanonical NVE (E = constant energy) ensemble to obtain the vibrational density of states (VDOS; i.e. power spectra). In this case, the total length of the MD run was 10 ps. The results of the AIMD calculations were interpreted in a wavenumber domain by calculating the Fourier transform of the velocity autocorrelation functions to obtain VDOS.
Results and discussion
Structural optimization
The initial structures of the organoclay models (Fig. 1) were fully relaxed (including unit-cell parameters). Analysis of the optimized geometries showed that both TBX cations reached a quasi-planar arrangement in the interlayer space (Fig. 2). For the TBA-Mt and/or TBP-Mt structures, no complete experimental data (including lattice vectors) exist; only basal space d 001 values were determined from powder XRD patterns (Scholtzová et al., Reference Scholtzová, Madejová and Tunega2014, Reference Scholtzová, Madejová, Jankovič and Tunega2016; Seyidoglu & Yilmazer, Reference Seyidoglu and Yilmazer2015). The optimized lateral lattice vectors (a and b) were similar and the largest difference was observed for the c vector and the d 001 value (15.6 Å for TBA-Mt and 15.2 Å for TBP-Mt; Table 1). Comparison of optimized d 001 values with experimental data (16.9 Å for TBA-Mt (Scholtzová et al., Reference Scholtzová, Madejová and Tunega2014) and 16.4 Å for TBP-Mt (Seyidoglu & Yilmazer, Reference Seyidoglu and Yilmazer2015)) showed a similar trend. The organoclay with the TBA cation had a larger interlayer space than the organoclay with the TBP cation. Although there was a difference between calculated and experimental d 001 values, it may be concluded that in the prepared TBX-Mt samples the organic cations had a quasi-planar monolayer arrangement in the interlayer space. The difference observed between the calculated and experimental data may be explained as follows: our structural models represented ideal structures having only one cation located in the computational cell with all four butyl chains in a straight conformation. In the real structures, however, the cations may not always achieve the same conformation as in our model; some of them may have butyl chains distorted in various conformations due to their flexibility, which results in an expansion of the interlayer space. Moreover, XRD measurements are performed at room temperature, whereas the structural optimization is formally done at 0 K. Thus, thermal effects also contribute to the expansion of the structure and they may be relatively large for organoclays, specifically in the direction of the layer stacking.
Table 1. Optimized cell parameters (Å, °), interlayer distance d 001 (Å) (compared with experiment), reaction energies ΔE int/ads (kJ/mol) and O···H distances in the C–H···O hydrogen bonds (Å) in the order minimal, median then maximal for TBX-Mt models (X = A or P).

a Scholtzová et al. (Reference Scholtzová, Madejová and Tunega2014).
b Tetrahedral configuration (ads*).
c Quasi-planar configuration (ads**).
d Seyidoglu and Yilmazer (Reference Seyidoglu and Yilmazer2015).
int = intercalated; ads = adsorbed.
Geometrical optimization of the two surface models with two different initial configurations (tetrahedral vs. quasi-planar) of the TBX cations resulted in the optimized structures in which the cation configurations were preserved (Fig. 3). From these two surface structures, the planar configuration was significantly more stable than the tetrahedral one (by 14.8 kJ/mol for TBA and by 20.8 kJ/mol for TBP) because of more direct contact with the Mt surface (details of which are discussed later).

Fig. 3. Optimized structures of the TBX cations (X = A or P) absorbed at the basal surface of Mt. Left side = tetrahedral coordination (ads*); right side = quasi-planar coordination (ads**) of the organic cation. The hydrogen bond scheme (dashed lines) corresponds to the TBP-Mt model. Colour coding of elements: magenta = phosphorus, black = carbon, light green = hydrogen.
Hydrogen bonds and stability
The measurement of the interatomic distances between hydrogen atoms of the butyl chains of the cations and the oxygen atoms of the basal surfaces of the Mt layers for intercalate and surface models showed that the cations interacted with the Mt layers through hydrogen bonds. The quasi-planar configuration of the organic cations was stabilized by involving almost all –CH2 groups in hydrogen bonding together with the –CH3 groups (Fig. 2). Furthermore, additional stabilization of the cations was due to the long-range Coulombic interactions between the positive charge of the cations and the delocalized negative charge of the Mt layers.
The analysis of the interatomic distances between the TBP cations and basal surfaces of the Mt layers showed that the TBP cations were anchored in the interlayer space of Mt through weak C–H···O hydrogen bonds, similar to the situation with TBA (Castellano, Reference Castellano2004; Desiraju & Steiner, Reference Desiraju and Steiner2006) with O···H distances in a range of 2.55–2.89 Å (Fig. 2, Table 1). Comparison with the TBA-Mt model (O···H distances in a range of 2.75–2.91 Å) showed that the TBP cation was anchored in the interlayer space through slightly shorter and thus stronger hydrogen bonds. This observation also explains the smaller d 001 spacing for the TBP-Mt model.
The organic cations adsorbed on the basal Mt surface also formed weak hydrogen bonds with the basal oxygen atoms (Ob) of the Mt surface, similar to the intercalated cation (Fig. 3). Overall, the hydrogen bonds formed for both adsorbed cations and both configurations were slightly weaker than the hydrogen bonds formed by the CH3/CH2 groups of the intercalated cations (compare medians in Table 1). Indeed, the shortest hydrogen bond of the adsorbed TBP cation for the tetrahedral configuration (2.54 Å) was shorter than the shortest hydrogen bond detected for the intercalated TBP cation (2.86 Å). A similar situation was also observed for the TBA cation (2.49 Å for the adsorbed tetrahedral configuration vs. 2.58 Å for the intercalated model). However, the total number of hydrogen bonds means that the tetrahedral configuration was significantly less stable than the quasi-planar one. Generally, weak hydrogen bonds such as C–H···O may form an angle (with H as the vertex) in the range of 90–175° (Desiraju & Steiner, Reference Desiraju and Steiner2006). In our models, the weak C–H···O hydrogen bonds (Figs 2, 3) were in ranges of 95–148° (int), 98–138° (ads*) and 107–150 (ads**) for TBA-Mt. These ranges were comparable to TBP-Mt (95–145° (int), 98–157° (ads*) and 106–150° (ads**), respectively, in accordance with Desiraju & Steiner (Reference Desiraju and Steiner2006).
The previous analysis of the hydrogen bonds of the structures of intercalates and surface models can be correlated with reaction energies calculated as the difference between the sum of energies of products and the sum of energies of reactants (ΔE int/ΔE ads) for the following ion-exchange reaction:
 $${\rm N}{\rm a}^ + \left( {{\rm H}_2{\rm O}} \right)_6-{\rm Mt} + {\rm TB}{\rm X}^ + \to {\rm TBX}-{\rm Mt} + {\rm N}{\rm a}^ + \left( {{\rm H}_2{\rm O}} \right)_6$$
where Na+(H2O)6-Mt is the optimized structure of Mt with a hydrated Na+ cation either intercalated in the interlayer space or adsorbed onto the basal surface, TBX+ is the isolated optimized organic cation, TBX-Mt is the model of the optimized intercalated or adsorbed structure of organoclay and Na+(H2O)6 is the optimized isolated hydrated complex of the Na+ cation. The calculated energy difference was not corrected for thermal effects (to obtain reaction enthalpy or Gibbs free energy). This correction may be relatively small for the exchange reaction with an estimation in a range of 4–12 kJ/mol (Alapati et al., Reference Alapati, Johnson and Sholl2006). The energetic gain (ΔE int/ads in Table 1) documents how intercalated/adsorbed TBX-Mt models were stable with respect to the parent Na+(H2O)6-Mt structure. The calculated exchange reaction energies (ΔE int/ads) showed that the TBP-Mt intercalate (–72.4 kJ/mol) was better stabilized than the TBA-Mt intercalate (–56.7 kJ/mol). This observation corresponded very well with the stronger hydrogen bonding of the TBP cation to the basal surface planes and the smaller d 001 interlayer space. The trend in the calculated reaction energies of both surface models was similar to the trend observed for the intercalated models; the TBP cation interacts more strongly with the Mt basal surface (–32.8 (ΔE ads*)/–53.8 (ΔE ads**) kJ/mol) than the TBA cation (–22.6 (ΔE ads*)/–37.4 (ΔE ads**) kJ/mol; Table 1). As expected, intercalation-reaction energies were significantly larger (in absolute value) than the corresponding surface-adsorption reaction energies.
Infrared spectra
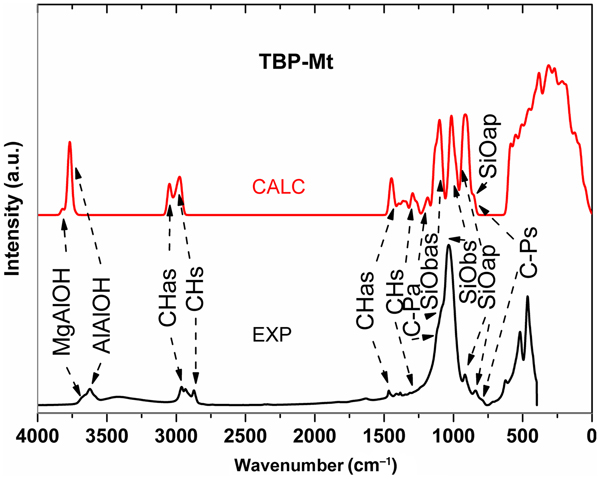
The FTIR spectrum of the TBP-Mt organoclay collected is displayed in Fig. 4 together with the calculated spectrum of the intercalated model. The advantage of the calculated spectrum is that, due to the analysis of the eigenvectors of the calculated modes, it was possible to assign unambiguously the particular vibrations, thereby contributing to a better interpretation of the experimental spectra. The latter often contain complex and overlapped broad bands, which may be difficult to interpret. The collected spectrum of the TBA-Mt intercalate was similar to that of the TBP-Mt spectrum, and its spectral range of 2800–3800 cm−1 was discussed in detail by Scholtzová et al. (Reference Scholtzová, Madejová and Tunega2014, Reference Scholtzová, Madejová, Jankovič and Tunega2016). Similarities between calculated and experimental spectra over the whole spectral range are presented in Fig. 4. In the experimental spectrum in the high-wavenumber region, a broad band of low intensity was observed in a range of 3000–3700 cm−1, which was assigned to residual water in the sample. In the calculated spectrum, this band was not observed, as the TBP-Mt model did not contain any water molecules. The high wavenumber range (>2500 cm−1) contains X–H-type stretching vibrations (X = O or C).

Fig. 4. Calculated (upper red line) and experimental (lower black line) FTIR spectra of the TBP-Mt intercalate.
The stretching modes of the Mt–OH groups were clearly identified in the calculated spectrum with two wavenumbers at 3824 cm−1 (assigned to the Mg–OH stretching mode) and at 3770 cm−1 (assigned to the Al–OH stretching mode). The experimental spectrum showed a broad band with a maximum at 3622 cm−1 and with a shoulder at 3685 cm−1, corresponding to the aforementioned calculated wavenumbers (Fig. 4).
C–H stretching vibrations dominated in the region 3100–2800 cm−1. In contrast to the experimental spectrum, only two distinguishable bands were observed in the calculated spectrum (Fig. 4), which represent a mix of CH2 and CH3 stretching vibrations detected from detailed analysis of the individual modes. The first band with a higher wavenumber (maximum at 3053 cm−1) corresponds to asymmetric C–H stretching, and the second band (maximum at 2976 cm−1) might be assigned to the symmetric C–H stretching. The experimental spectrum in the C–H stretching area was more complicated, with a splitting of the asymmetric C–H band into two distinguishable bands with maxima at 2960 and 2930 cm−1 and to a band at 2871 cm−1 assigned to the symmetric C–H mode (Fig. 4). Similar splitting was also observed in the FTIR spectrum of the TBA-Mt sample discussed in our previous work (Scholtzová et al., Reference Scholtzová, Madejová and Tunega2014). This splitting was explained as a possible disturbing effect of the residual water in the sample and of the more structurally complicated arrangement of the alkyl chains in the interlayer space in comparison to the flat arrangement of the TBX cations with straight alkyl chains in the structural models achieved from geometrical optimization.
For a better understanding of the CH3/CH2 stretching vibrations, molecular dynamic simulations were used to obtain the VDOS. Detailed VDOS spectra in the C–H stretching region were compared for TBP-Mt and TBA-Mt intercalate models (Fig. 5). Partial VDOS was obtained separately for the CH2 and CH3 groups. Both structural units had two bands (higher wavenumbers corresponded to asymmetric modes, whereas lower wavenumbers corresponded to symmetric modes). The maxima of the CH2 and CH3 stretching VDOS modes (3094 and 3033 cm−1 for CH2 and 3096 and 3015 cm−1 for CH3 of the TBP-Mt model) were close to each other, confirming the previous proposal that it was practically impossible to distinguish these modes in the overall calculated spectrum. Comparison of the calculated VDOS of both TBX-Mt models showed a shift in CH2/CH3 stretching modes (blue shifts) that might correspond to stronger hydrogen bonding in TBP-Mt than in TBA-Mt. This significant shift was observed for asymmetric C–H stretching vibrations of the CH3 groups (+23 cm−1) and for the symmetric stretching vibrations of the CH2 groups (+12 cm−1). Such a blue shift to higher wavenumbers of the stretching vibrations is not obvious because in standard X–H···Y hydrogen bonds a red shift of X–H stretching vibration is typical (Desiraju & Steiner, Reference Desiraju and Steiner2006). Nevertheless, the blue shift of C–H wavenumbers has been reported mainly for the sp 3 hybridized carbon. An explanation of this effect has been proposed (Scheiner, Reference Scheiner, Dykstra, Frenking, Kim and Scuseria2005), together with examples showing that the C–H bonds are shortened if they are involved in hydrogen bonding. This effect was also observed for the TBX-Mt models. The C–H···O bonds were formed between the CH3/CH2 groups of the TBX cations and the basal oxygen atoms of Mt (Fig. 2). The average calculated C–H bond lengths involved in hydrogen bonds in the TBP-Mt model were slightly shorter (~0.004 Å) than in the respective TBA-Mt model, corresponding to the observed small blue shift of the C–H stretching modes. Asymmetric C–H stretching vibrations of the CH3 groups of TBP-Mt have the highest energy (3096 cm−1), which corresponds with the shortest average hydrogen bond of 2.86 Å. For TBA-Mt, the energies of the C–H vibrations are lower (3073 cm−1) and, as expected, the average hydrogen bond length is longer (3.19 Å). The same trend is evident for the symmetric C–H stretching vibrations of the CH2 groups with higher energy (3033 cm−1) and shorter average hydrogen bond length (2.93 Å) for TBP-Mt, which are opposite to the lower energy (3021 cm−1) and longer average hydrogen bond length (2.99 Å) for TBA-Mt.

Fig. 5. Calculated power spectra of TBP-Mt (upper red lines) and TBA-Mt (lower black lines) in the C–H region for CH2 (solid line) and CH3 (dashed line).
The spectrum in the region below 1500 cm−1 was more complicated because of the many overlapped vibrations of various structural units existing in the TBP-Mt intercalate and the mixing and overlapping of various types of vibrations (e.g. stretching of heavy atoms, bending C–H modes, etc.). The analysis of the eigenvectors of the calculated modes allowed this region to be described in detail. The asymmetric C–H bending vibrations were detected in a region from 1320 to 1490 cm−1 in the calculated spectrum, which corresponds to a region from 1380 to 1520 cm−1 in the experimental FTIR spectrum (depicted in Fig. 4). The symmetric C–H bending vibrations in the range of 1240–1315 cm−1 (calculated spectrum) and corresponding bands with low intensity might be attributed to vibrations in the range of 1210–1335 cm−1 in the experimental spectrum.
The asymmetric C–P stretching vibration was represented by a small band at 1185 cm−1 in the calculated spectrum followed by three sharp bands at 1100, 1015 and 915 cm−1 in which the Si–Ob asymmetric (b = basal), Si–Ob symmetric and Si-Oap (ap = apical oxygen) vibrations dominated. In the experimental spectrum, one broad band at 1025 cm−1 with small shoulders and two small bands (915 and 814 cm−1) were observed, which might correspond to the vibrations obtained from the calculations. The symmetric C–P stretching vibration was overlapped with the Si–O bands and was detected as a very small shoulder at 832 cm−1 in the calculated spectrum corresponding to the band at 786 cm−1 in the FTIR spectrum. In comparison to the TBA-Mt intercalate, the calculated average C–N bond length (1.529 Å) was shorter than the C–P bond length (1.818 Å). This corresponds to the calculated asymmetric and symmetric C–N stretching modes observed at higher wavenumbers (1247 and 895 cm−1) than the C–P stretching modes. These modes correspond to the FTIR bands in the spectrum of the TBA-Mt intercalate at 1259 and 884 cm−1, respectively (Scholtzová et al., Reference Scholtzová, Madejová and Tunega2014, Reference Scholtzová, Madejová, Jankovič and Tunega2016).
Because this work was focused on the effect of the strength of the hydrogen bonds on the band position of the C–H stretching vibrations, bands <500 cm−1 were not analysed in detail.
Conclusions
The DFT calculations performed on intercalate and surface models of TBA/TBP-Mt organoclays showed that both cations preferred a quasi-planar arrangement in the interlayer space. The quasi-planar arrangement was also preferred for the surface adsorption models that were significantly more stable than the models with tetrahedral configurations of the attached organic cations. The quasi-planar arrangement (in both intercalated and surface models) was stabilized by formation of weak hydrogen bonds between the CH2 and CH3 groups of the butyl chains and the basal surface oxygen atoms of the Mt layer. The analysis of the hydrogen bond distances and interlayer spacing indicated that the TBP cation was better stabilized in the interlayer space and on the surface of Mt than the TBA cation. This observation was also confirmed by calculation of the reaction energies of the cation-exchange reactions, in which organic cations replaced hydrated Na+(H2O)6 cations. The TBP-Mt intercalation model was more stable by 15.7 kJ/mol than the corresponding intercalate model of the TBA cation. The calculated surface reaction energies showed a similar trend to that observed for the intercalation models. The calculated vibrational spectrum of the TBP-Mt model was interpreted in terms of the individual vibrational modes and was in good agreement with the experimental IR spectrum. Observed differences (blue shift) of the wavenumbers of the CH2/CH3 stretching modes between the TBP-Mt and TBA-Mt models supported the conclusion of the higher stability of the organoclay prepared from TBP cations. The calculations showed that alkylphosphonium cations were a good alternative to conventional alkylammonium cations for the preparation of stable organoclays.
The analysis of hydrogen bonds, calculated intercalation and adsorption reaction energies (ΔE int/ads) and the analysis of the calculated vibrational modes of the CH2/CH3 groups indicate that the TBP-Mt structures were more stable than the structures prepared from the TBA cation and Mt.
Acknowledgements
ES is grateful for the financial support by the Slovak Grant Agency VEGA (Grant 2/0141/17) and the Slovak Research and Development Agency (APVV-15-0741 and APVV-15-0347). DT acknowledges gratefully the support by the Austrian Science Fund (FWF), project number I880-N21, and CPU time at the Vienna Scientific Cluster (VSC), project number 70544.