The cap-rock, the heat source, the reservoir and recharge areas are the main four elements in hydrothermal convective geothermal systems. To be effective, a cap-rock should be impermeable enough to maintain the reservoir temperature and the pressure and enthalpy of the system through time (Todesco & Giordano, Reference Todesco, Giordano, Funiciello and Giordano2010; Maffucci et al., Reference Maffucci, Corrado, Aldega, Bigi, Chiodi, Di Paolo and Invernizzi2016; Sánchez-Alfaro et al., Reference Sánchez-Alfaro, Reich, Arancibia, Pérez-Flores, Cembrano, Driesner, Lizama, Rowland, Morata, Heinrich, Tardani and Campos2016). In volcanic and volcaniclastic systems, the development of large, thick cap rocks is favoured by intense argillic alteration which leads to the formation of the clay cap. The efficiency of the clay cap is controlled to a significant extent by the intensity of the hydrothermal alteration, however.
Di- and trioctahedral clay minerals such as smectite, illite, corrensite, chlorite and chlorite-smectite (C-S), chlorite-corrensite (C-Cor) and illite-smectite (I-S) mixed layers are widespread as hydrothermal alteration products (Inoue et al., Reference Inoue, Meunier and Beaufort2004; Meunier Reference Meunier and Meunier2005; Stimac et al., Reference Stimac, Goff and Goff2015). Their formation and transformation to mixed-layer phases (smectite to illite via I-S and smectite to chlorite via C-S and C-Cor) have been studied widely in many fossil and active hydrothermal systems (Inoue, Reference Inoue and Velde1995; Inoue et al., Reference Inoue, Meunier and Beaufort2004; Meunier et al., Reference Meunier, Mas, Beaufort, Patrier and Dudoignon2008a,Reference Meunier, Mas, Beaufort, Patrier and Dudoignonb; Vázquez et al., Reference Vázquez, Nieto, Morata, Droguett, Carrillo-Rosúa and Morales2014; Inoué & Kogure Reference Inoué and Kogure2016). Moreover, the mixed-layer ordering types and the proportion of illite layers in I-S, as well as the Kübler and Árkai indices, have been employed to constrain the temperatures and conditions (e.g. fluid composition, fluid/rock ratio, time) prevailing during the formation of the clay minerals (Kübler, Reference Kübler1968; Środoń, Reference Środoń1981; Merriman & Peacor, Reference Merriman, Peacor, Frey and Robinson1999; Ji & Browne, Reference Ji and Browne2000; Warr & Ferreiro Mahlmann, Reference Warr and Ferreiro2015; Vidal et al., Reference Vidal, Lanari, Munoz, Bourdelle and Andrade2016). Consequently, the study of clay minerals should improve our knowledge of spatial distribution and the relationship with temperature and other factors to estimate the efficiency of the clay cap and its influence on the reservoir zone of the geothermal systems, where other subsurface data are scarce and particularly in the case of blind geothermal systems, where surface thermal manifestations are lacking (e.g. Corrado et al., Reference Corrado, Aldega, Celano, de Benedetti and Giordano2014).
The Cerro Pabellón (previously referred to as the ‘Apacheta geothermal project’, Urzúa et al., Reference Urzúa, Powell, Cumming and Dobson2002) might be considered a high-enthalpy blind geothermal field located in the Andean Central Volcanic Zone (CVZ) in northern Chile, at 4500 m a.s.l., ~100 km NE of the city of Calama and ~60 km NNW of El Tatio geothermal field (Fig. 1a). This geothermal field, discovered in 1999 (Urzúa et al., Reference Urzúa, Powell, Cumming and Dobson2002), constitutes the second productive geothermal power plant of South America (Copahue being the first), beginning its operation in 2017. The CVZ is an active volcanic region with heat-flow density values between 50 and 180 mW/m2 measured in the active magmatic arc and in the Altiplano (Springer & Forster, Reference Springer and Förster1998). This region comprises abundant Quaternary volcanoes and its geodynamic setting is favourable to the development of several geothermal areas (Aravena et al., Reference Aravena, Muñoz, Morata, Lahsen, Parada and Dobson2016).
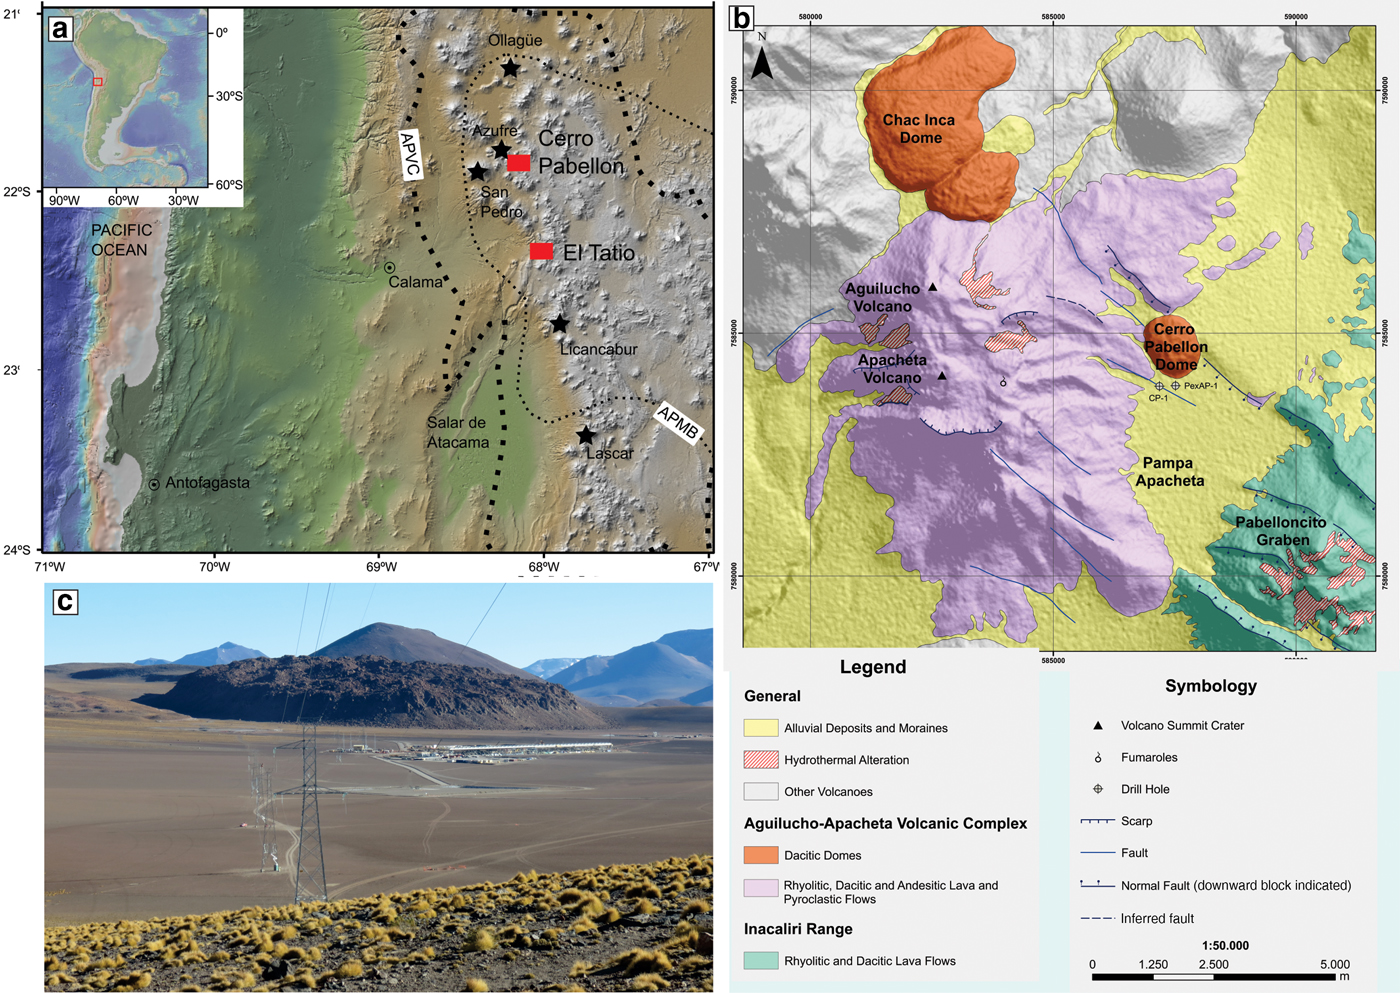
Fig. 1. (a) Central Volcanic Zone (CVZ) in the Andean Cordillera showing the Altiplano-Puna Volcanic Complex (APVC; de Silva, Reference de Silva1989), the main Pleistocene to Holocene volcanoes and the location of the Cerro Pabellón geothermal system; (b) simplified geological map of the Cerro Pabellón geothermal field (modified from Godoy et al., Reference Godoy, Rodríguez, Pizarro and Rivera2017); (c) general view of the Cerro Pabellón geothermal power plant with the 80–130 ka Cerro Pabellón rhyolitic dome in the background.
The purpose of the present study was to examine the vertical distribution of the clay minerals forming the clay cap of the Cerro Pabellón active geothermal field. Our results have allowed us to propose a relationship between the mineral formation-transformation processes and factors such as temperature, fluid–rock composition and time. This represents a contribution to the comprehension of clay-formation processes in blind geothermal systems with the aim of understanding the different mechanism involved during their development.
GEOLOGICAL SETTING
The Andean Central Volcanic Zone (CVZ) has been formed under an intense compressive geodynamic regime since the Early Cretaceous, and is associated with the subduction of the Nazca Plate under the South American Plate, which gives rise to magmatic and hydrothermal activity (e.g. Lahsen, Reference Lahsen1988; Brasse et al., Reference Brasse, Lezaeta, Rath, Schwalenberg, Soyer and Haak2002; Farías et al., Reference Farías, Charrier, Comte, Martinod and Hérail2005; Charrier et al., Reference Charrier, Pinto, Rodríguez, Moreno and Gibbons2007; Tassi et al., Reference Tassi, Aguilera, Darrah, Vaselli, Capaccioni, Poreda and Delgado-Huertas2010; Sánchez-Alfaro et al., Reference Sánchez-Alfaro, Sielfeld, van Campen, Dobson, Fuentes, Reed, Palma-Behnke and Morata2015; Herrera et al., Reference Herrera, Pinto, Deckart, Cortés and Valenzuela2017). In northern Chile, the magmatism generated Middle Cretaceous–Late Miocene andesitic to rhyolitic volcanic rocks overlain by Late Miocene–Pleistocene ignimbrite deposits (Lahsen & Trujillo, Reference Lahsen and Trujillo1975; Francis & Rundle, Reference Francis and Rundle1976; Marinovic & Lahsen, Reference Marinoviç and Lahsen1984; de Silva, Reference de Silva1989; Ahumada & Mercado, Reference Ahumada and Mercado2009). These volcanic rocks constitute the Altiplano-Puna Volcanic Complex (APVC), a volcano-tectonic silicic magmatic province generated by the partial melt of the thickest continental crust in the world (de Silva, Reference de Silva1989; Schmitz et al., Reference Schmitz, Lessel, Giese, Wigger, Araneda, Bribach, Graeber, Grunewald, Haberland, Lüth, Röwer, Ryberg and Schulze1999). Over these units, different Pleistocene to Holocene arc volcanoes have been emplaced. The area of the APVC coincides with the surface projection of the Altiplano-Puna Magmatic Body (APMB), a partially molten body within the upper crust, 4 to 25 km below sea level, recognized by geophysical methods (MT, seismic analyses, etc.) and interpreted as an incrementally constructed upper-crustal batholith atop an upper crustal MASH zone (Brasse et al., Reference Brasse, Lezaeta, Rath, Schwalenberg, Soyer and Haak2002; Zandt et al., Reference Zandt, Leidig, Chmielowski, Baumont and Yuan2003; de Silva & Gosnold, Reference de Silva and Gosnold2007; Ward et al., Reference Ward, Zandt, Beck, Christensen and McFarlin2014; among others).
In the studied area (Fig. 1b), the CVZ is characterized by several NW–SE oriented eruptive centres dominated by the polygenetic Pleistocene to Holocene Azufre–Inacaliri volcanic range (Trumbull et al., Reference Trumbull, Riller, Oncken, Scheuber, Munier, Hongn, Oncken, Chong, Franz, Giese, Götze, Ramos, Strecker and Wigger2006; Rivera et al., Reference Rivera, Morata and Ramírez2015), where stratovolcanoes of basaltic andesite to dacitic composition (Apacheta-Aguilucho Volcanic Complex; Ahumada & Mercado, Reference Ahumada and Mercado2009) and rhyolitic domes (Chac-Inca and Pabellón domes; Rivera et al., Reference Rivera, Morata and Ramírez2015; Tierney et al., Reference Tierney, Schmitt, Lovera and de Silva2016) are recognized (Fig. 1b). Locally, the different geological units have been identified by surface geological mapping and recorded from four commercial wells drilled by Geotermia del Norte S. A. (GDN) (Rivera et al., Reference Rivera, Morata and Ramírez2015). They mainly correspond to Pliocene–Pleistocene andesitic to dacitic lava, breccias and tuffs, capped by a 100 m-thick welded ash flow, whereas the recent volcanic activity is associated with a series of Pleistocene dacitic lava domes (Pabellón, Chac-Inca and Chanka; Urzúa et al., Reference Urzúa, Powell, Cumming and Dobson2002; Fig. 1b).
A local Pliocene extensional phase, within a regional compressional regime related to the subduction of the Nazca Plate under the South American Plate, took place in the area (e.g. González et al., Reference González, Cembrano, Carrizo, Macci and Schneider2003). This phase generated a NW-striking normal fault system which extends from Azufre volcano in the NW to Inacaliri volcano to the SE (Tibaldi et al., Reference Tibaldi, Bonali and Corazzato2016). In the zone investigated, a topographically depressed area of ~100 km2 (Tibaldi et al., Reference Tibaldi, Corazzato and Rovida2009; Rivera et al., Reference Rivera, Morata and Ramírez2015), ~20 km long and 3 km wide, is well defined by two major faults with converging dips and pronounced scarps (~100–150 m), which form a symmetric graben. This NW–SE graben structure (the Pabelloncito Graben, Francis & Rundle, Reference Francis and Rundle1976), affects the NW–SE aligned Pliocene stratovolcanoes. In fact, debris avalanche in the Apacheta-Aguilucho volcanic complex (AAVC), located in the northern part of the graben, has recently been interpreted to be triggered by the partial collapse of this volcanic edifice 100–700 ka ago influenced by hydrothermal alteration and the local extensional setting (Godoy et al., Reference Godoy, Rodríguez, Pizarro and Rivera2017). The main NE fault bounding the graben was sealed by the Cerro Pabellón dacitic dome (Tibaldi et al., Reference Tibaldi, Corazzato and Rovida2009), 80–130 ka age (40Ar/39Ar in biotite, Renzulli et al., Reference Renzulli, Menna, Tibaldi and Flude2006; Fig. 1c), the extrusion of which was favoured by the structural weakness related to the normal faults of the graben.
The Cerro Pabellón field does not display surface hydrothermal manifestations; thus it is classified as a blind geothermal field. However, at the summit of Cerro Apacheta volcano (Fig. 1b), two superheated fumaroles (measured temperatures of 109 and 118°C) with high steam-discharge rates were recognized at 5150 m elevation (Urzúa et al., Reference Urzúa, Powell, Cumming and Dobson2002). The gas geochemistry of these two superheated fumaroles suggests their relationship with a high-temperature geothermal system, with a reservoir composed of biphasic fluids (liquid and vapour), at temperatures of 250–325°C (Urzúa et al., Reference Urzúa, Powell, Cumming and Dobson2002; Tassi et al., Reference Tassi, Aguilera, Darrah, Vaselli, Capaccioni, Poreda and Delgado-Huertas2010). Nevertheless, the only surface alteration related to the active Cerro Pabellón geothermal system is the presence of discontinuous altered clay zones, spatially related to an acid-sulfate alteration, including native sulfur and clay minerals affecting the Pliocene volcanic units (Fig. 1b; Ramírez & Fuente, Reference Ramírez and Huete1981; Urzúa et al., Reference Urzúa, Powell, Cumming and Dobson2002; Tibaldi et al., Reference Tibaldi, Corazzato and Rovida2009).
MATERIAL AND METHODS
Because of the scarcity of surface alteration, this work focused on drill core and cutting samples from two wells provided by GDN for this study: a complete 557 m long exploration drill core (PexAP-1; 21°50′49.68″S, 68°09′21.35″W) and drilling cuttings from the 1821.1 m deep production CP1 well (21°50′56.55″S, 68°09′24.27″W; Figs 1b, 2). Forty-two drilling samples, 25 from the PexAP-1 well and 17 from the CP1 well (Fig. 2), were studied to establish their mineralogical compositions. The samples studied along the PexAP-1 well correspond to depths between 165 and 557 m, with a spacing of ~30 m (Fig. 2), whereas samples along the CP1 well correspond to depths between 425 and 825 m, collected every 25 m. The shallower cuttings, from 175 m to 400 m of depth, studied by Piscaglia (Reference Piscaglia2012), were examined as well. Since the downhole measured temperature at the time of drilling is lower by 10–20°C than the pre-drilling bottom-hole temperatures (cf. Artemieva, Reference Artemieva2011), pre-drilling temperatures were estimated using the Harrison et al. (Reference Harrison, Luza, Prater and Chueng1983) correction. Samples were studied with optical petrography, X-ray diffraction (XRD) and scanning electron microscopy (SEM). The XRD data were obtained with a Bruker D8 Advance diffractometer with Cu-Kα radiation and a Bragg-Brentano geometry at the Department of Physics in the Facultad de Ciencias Físicas y Matemáticas of the Universidad de Chile (Chile) and a Philips PW1830 diffractometer with PW3710 generator and Cu-cathode at 30 mA and 40 kV at the Università degli Studi di Urbino Carlo Bo (Italy). Samples for bulk-rock analysis were dried at room temperature and 10 g samples, powdered in an agate mortar, were examined with XRD at 5–70°2θ and interpreted using the X´Pert Highscore software. The mineralogy of the <2 µm fraction was studied only for the samples of the PexAP-1 well, where a continuous core was available. Sample chips were washed in distilled water to remove salts, treated to remove organic matter and calcite, separated by centrifugation and mounted in oriented aggregates following the recommendations of Moore & Reynolds (Reference Moore and Reynolds1997). Clay-mineral analysis was carried out between 2 and 40°2θ, with a step size of 0.02°2θ and a scanning time per step of 47.25 s. The minerals in the clay fraction were identified according to the position of the basal reflections of air-dried (AD), ethylene-glycol solvated (EG), and heated to 500°C for 4 h (H) XRD patterns, using the criteria of Moore & Reynolds (Reference Moore and Reynolds1997). Smectite was identified by the peak shift from ~14 Å to 17.5 Å after EG solvation, and collapse to 10 Å after the heat treatment (Moore & Reynolds, Reference Moore and Reynolds1997). The presence of I-S mixed layers and their illite proportions were determined by the reflection near 16–17°2θ and the ordering types (R0, R1 and R3) by the position of the reflection from 5 to 8.5°2θ in AD and EG preparations. Illite was identified by the 10.1 Å, 5.0 Å and 3.33 Å reflections on AD preparations, which are not displaced after the EG and H treatments. Chlorite was identified by the 14, 7, 4.76 and 3.53 Å reflections in AD and EG samples. Mixed-layer chlorite-smectite (C-S), corrensite and C-Cor were identified following the recommendations of Beaufort et al. (Reference Beaufort, Baronnet, Lanson and Meunier1997), and Moore & Reynolds (Reference Moore and Reynolds1997).
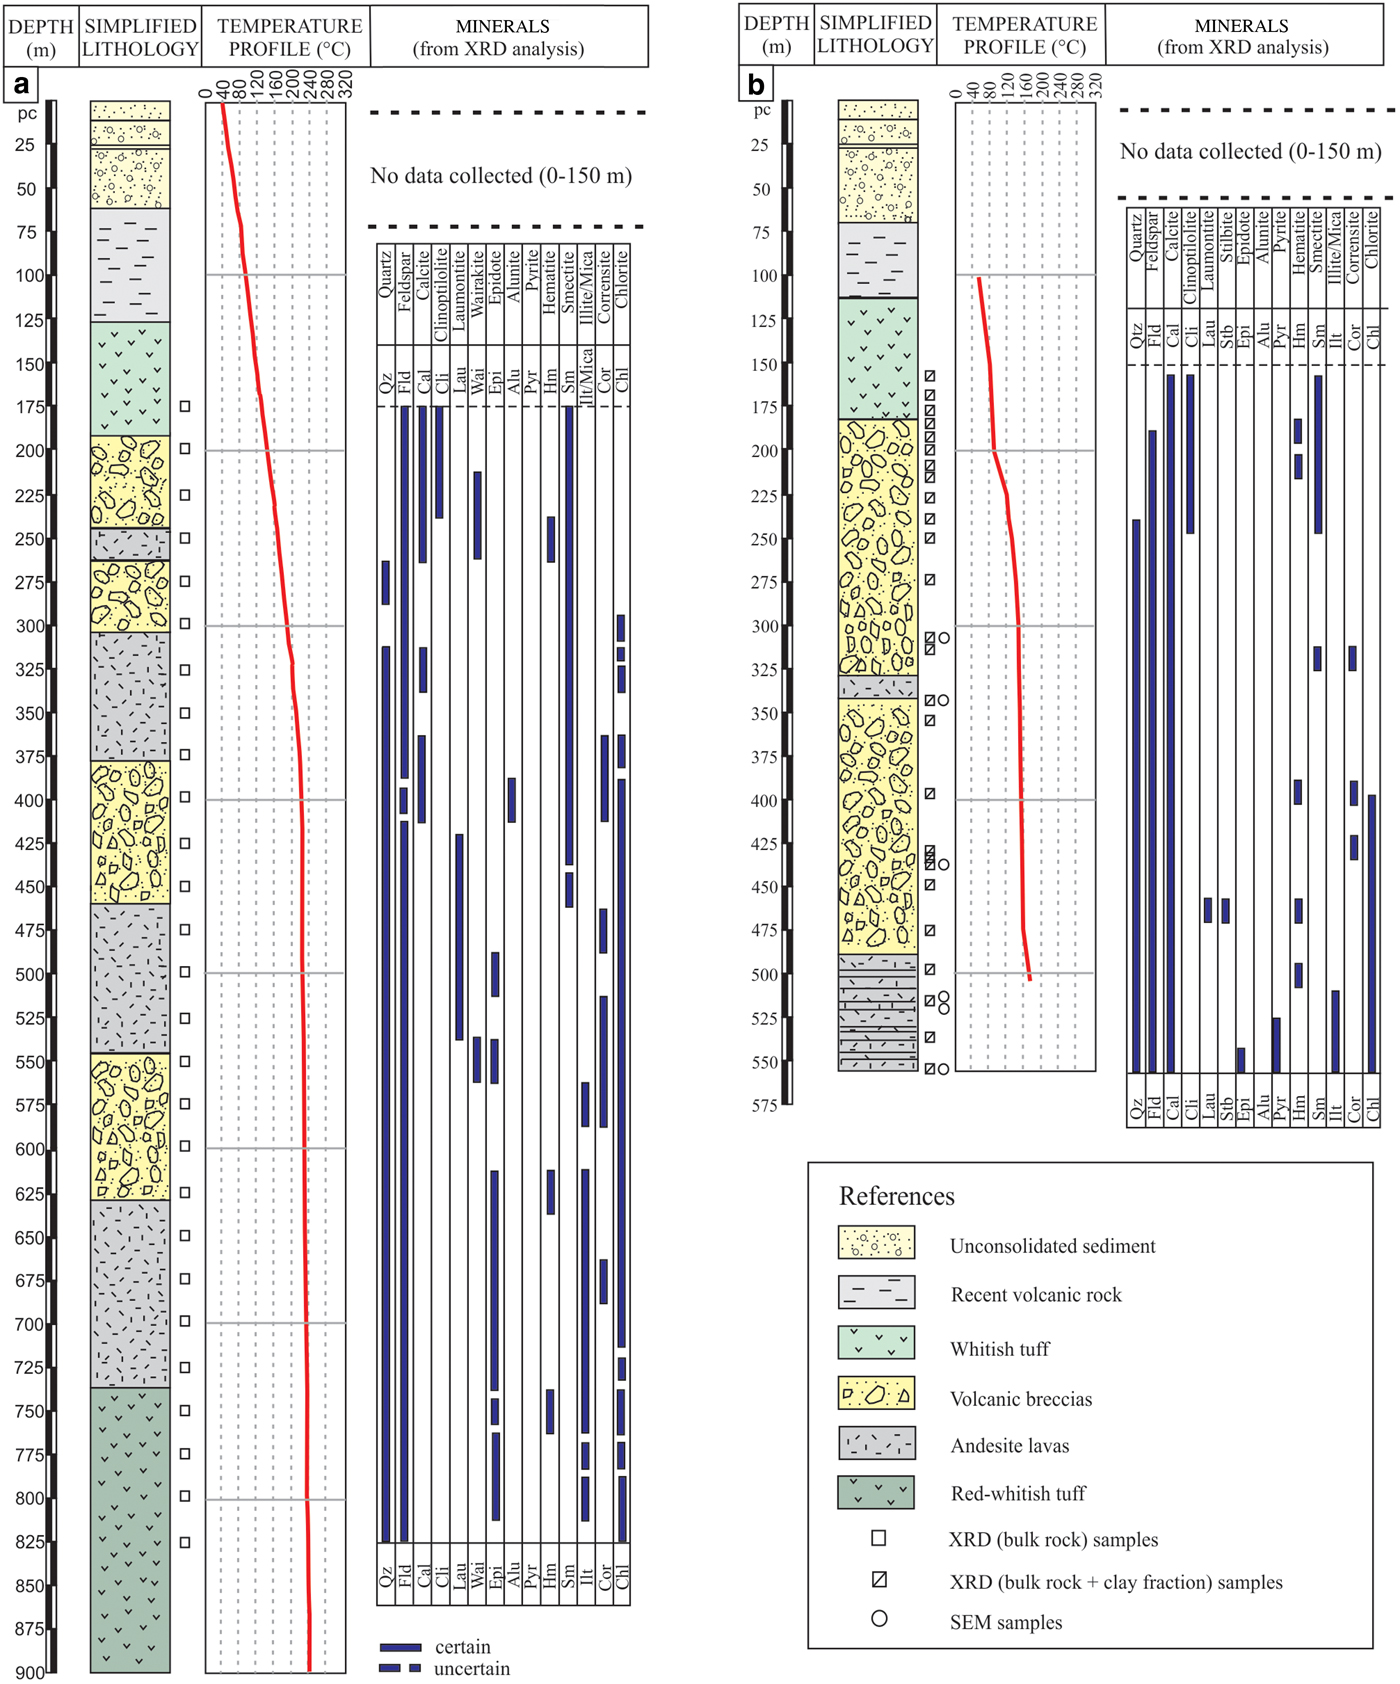
Fig. 2. Simplified lithological columns of the Cerro Pabellón geothermal field obtained from the CP-1 (a) and the PexAP-1 (b) wells, showing measured temperature profiles (°C) and the main alteration minerals identified through petrography and bulk-rock XRD.
The Kübler and Árkai indices were determined following the recommendations of Kisch (Reference Kisch1991) and Warr & Rice (Reference Warr and Rice1994). The values obtained were calibrated to CIS values (Warr & Rice, Reference Warr and Rice1994; Warr & Ferreiro Malhmann, Reference Warr and Ferreiro2015; Warr, Reference Warr2017) through the regression equation: IKCIS= 0.9192 x IK + 0.102. The b-parameter was calculated from (060) reflections obtained from thin sections in order to distinguish di- and trioctahedral clay minerals, using XRD traces over the range 50 to 70°2θ, with a 0.02° step size and 47.25 s counting time.
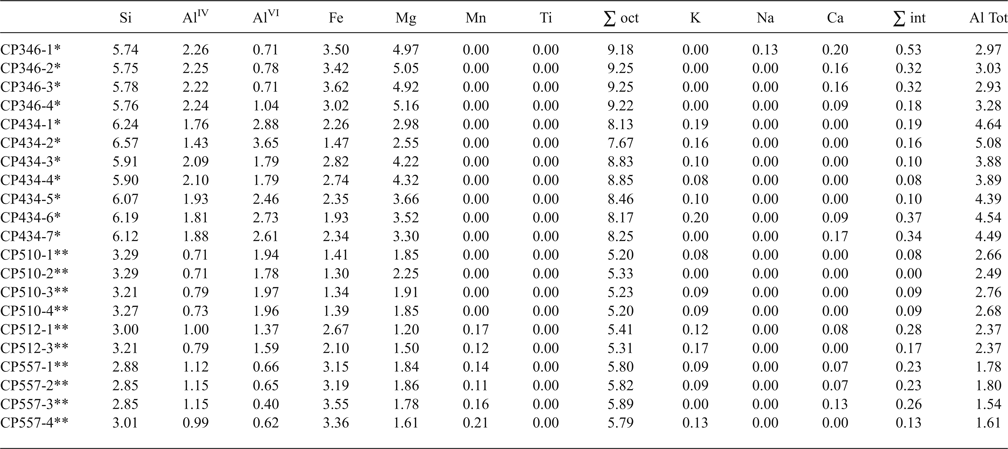
Six thin rock slides from PexAP-1 well were selected for textural and compositional study of the clay minerals using a FEI Quanta 250 SEM at the Department of Geology in the Facultad de Ciencias Físicas y Matemáticas of the Universidad de Chile (Chile). Samples were carbon coated and examined through backscattered electron (BSE) images. Energy dispersive X-ray spectrometry (EDS) analyses were performed on selected regions to obtain semi-quantitative clay-mineral compositions. For BSE and EDS the operating conditions were 15 keV accelerating voltage, a spot size of 5 µm, working distance of 10 mm, and a counting time of 60 s. The structural formulae of dioctahedral smectites, mixed-layer I-S and illites were calculated considering 22 oxygen atoms. A 0.80 Fe3+/Fetot ratio was taken into consideration until the depth of 450 m given the presence of hematite, while for the samples from deeper levels, a ratio of 0.4 Fe3+/Fetot was used given the presence of pyrite, ilmenite, chalcopyrite and galena (Guidotti et al., Reference Guidotti, Yates, Dyar and Taylor1994). The structural formulae of C-S and Cor were calculated considering 25, whereas C-Cor and chlorite were calculated considering 14 oxygens. A 0.20 Fe3+/Fetot ratio was assumed for these phases (Inoue et al., Reference Inoue, Kurokawa and Hatta2010).
RESULTS
Mineral paragenesis
Petrography and whole-rock XRD analysis
The stratigraphic sequence of both wells is summarized in Fig. 2. The different lithologies recorded from PexAP-1 and CP1 wells are comparable (Rivera et al., Reference Rivera, Morata and Ramírez2015): the first ~190 m consist of unconsolidated sediments (0–65 m), recent volcanic rocks (65–125 m) and whitish tuffs (125–190 m); from ~190 to 737 m the sequence is characterized by an alternation of breccias and andesitic lavas; from ~737 to 900 m red-whitish tuffs were recognized. Finally, from 900 to 1755 m a series of andesitic-dacitic lavas with intercalations of tuffs were distinguished. Secondary alteration minerals were studied in the continuous drill core PexAP-1 well and in the cuttings from the CP1 well (Fig. 2). Macroscopic and microscopic analyses of the drill core (PexAP-1) show that the andesitic rocks display intense and pervasive hydrothermal alterations, with the primary mineralogy being replaced completely, represented by sparse relicts of zoned and polysynthetic twinned plagioclase and clinopyroxene accompanied by scarce amphibole, biotite and olivine relicts. In general Na-Ca-plagioclase phenocrysts have been partly to completely dissolved and pseudomorphically replaced by Na-plagioclase and K-feldspar or by clay minerals. Primary mafic minerals are mostly pseudomorphed and replaced by clay minerals associated with hematite and variable amounts of quartz. At least two different microtextural types of veinlets, filled by quartz + calcite ± chlorite, were recognized (Fig. 3a–c) suggesting an intense, hot fluid–rock interaction. Rhombic calcite crystals, present in the centres of veinlets and vesicles, are overgrown by quartz displaying crustiform, colloform, zonal and mosaic (or jigsaw) textures. The proportions of clay minerals in veinlets are variable. Sparse relict amygdales, clast outlines, trachytic textures and brecciation features were preserved.

Fig. 3. Photomicrographs of representative samples taken from the shallow and deep zones from PexAP-1 well. Cal: calcite; Qz: quartz; Cli: clinoptololite; Epi: epidote. (a) Sample located at 212 m depth. Vein filled by zeolites, rhombic calcite, zonal and flamboyant quartz. The matrix has been replaced by clays minerals; (b) plane polarized and crossed polarized light photomicrographs showing clinoptilolite followed by rhombic calcite; (c) vein in sample located at 552 m depth consisting of Fe oxides and jigsaw and zonal quartz followed by rhombic calcite and a later generation of colloform and zonal quartz; (d) plane polarized and crossed polarized light photomicrographs of a sample located at 510 m depth. Plagioclase phenocryst replaced by epidote.
Similar mineral assemblages were recognized from XRD analyses along both wells (Fig. 2). Smectite is the main clay mineral in the ~165–250 m interval which is also characterized by the absence of quartz and the presence of clinoptilolite (Fig. 3d), calcite and hematite. From ~250 to 400 m, mixed-layer I-S and C-S linked to albite, calcite, hematite, quartz, stilbite and laumontite were identified. From ~400 m, chlorite is intimately associated with hematite, adularia, albite, calcite, quartz, epidote, while illite was identified from ~510 m. The Ca-zeolites (clinoptilolite-stilbite-laumontite-wairakite sequence) are present from 165 m in a relatively discontinuous way, mainly filling vesicles and voids (Fig. 3b). From ~475 m, it is possible to recognize epidote, sporadically at first and then more often from 625 m.
Clay mineralogy
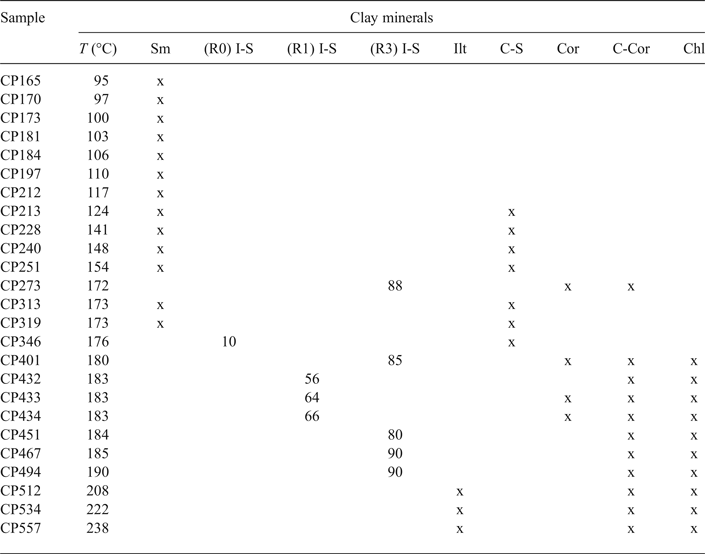
XRD of the <2 μm fraction. The clay minerals identified in the PexAP-1well were smectite, I-S, illite, C-S, corrensite, C-Cor and chlorite, showing a zonation with depth (Fig. 4, Table 1). Smectite is present continuously from the shallower parts of the borehole down to a depth of 251 m and reappears at a depth of 319 m (Table 1, Figs 2, 4a). At greater depths, smectite disappears and is replaced by mixed-layer I-S: R0-type I-S with ~10% illite layers at 346 m depth, R1-type I-S with 55–66% illite layers at ~433 m and R3-type I-S with >90% illite layers occurring continuously from depths of ~451 to ~493 m. Then, to the bottom of the well, R3 I-S (>90% illite) was identified.
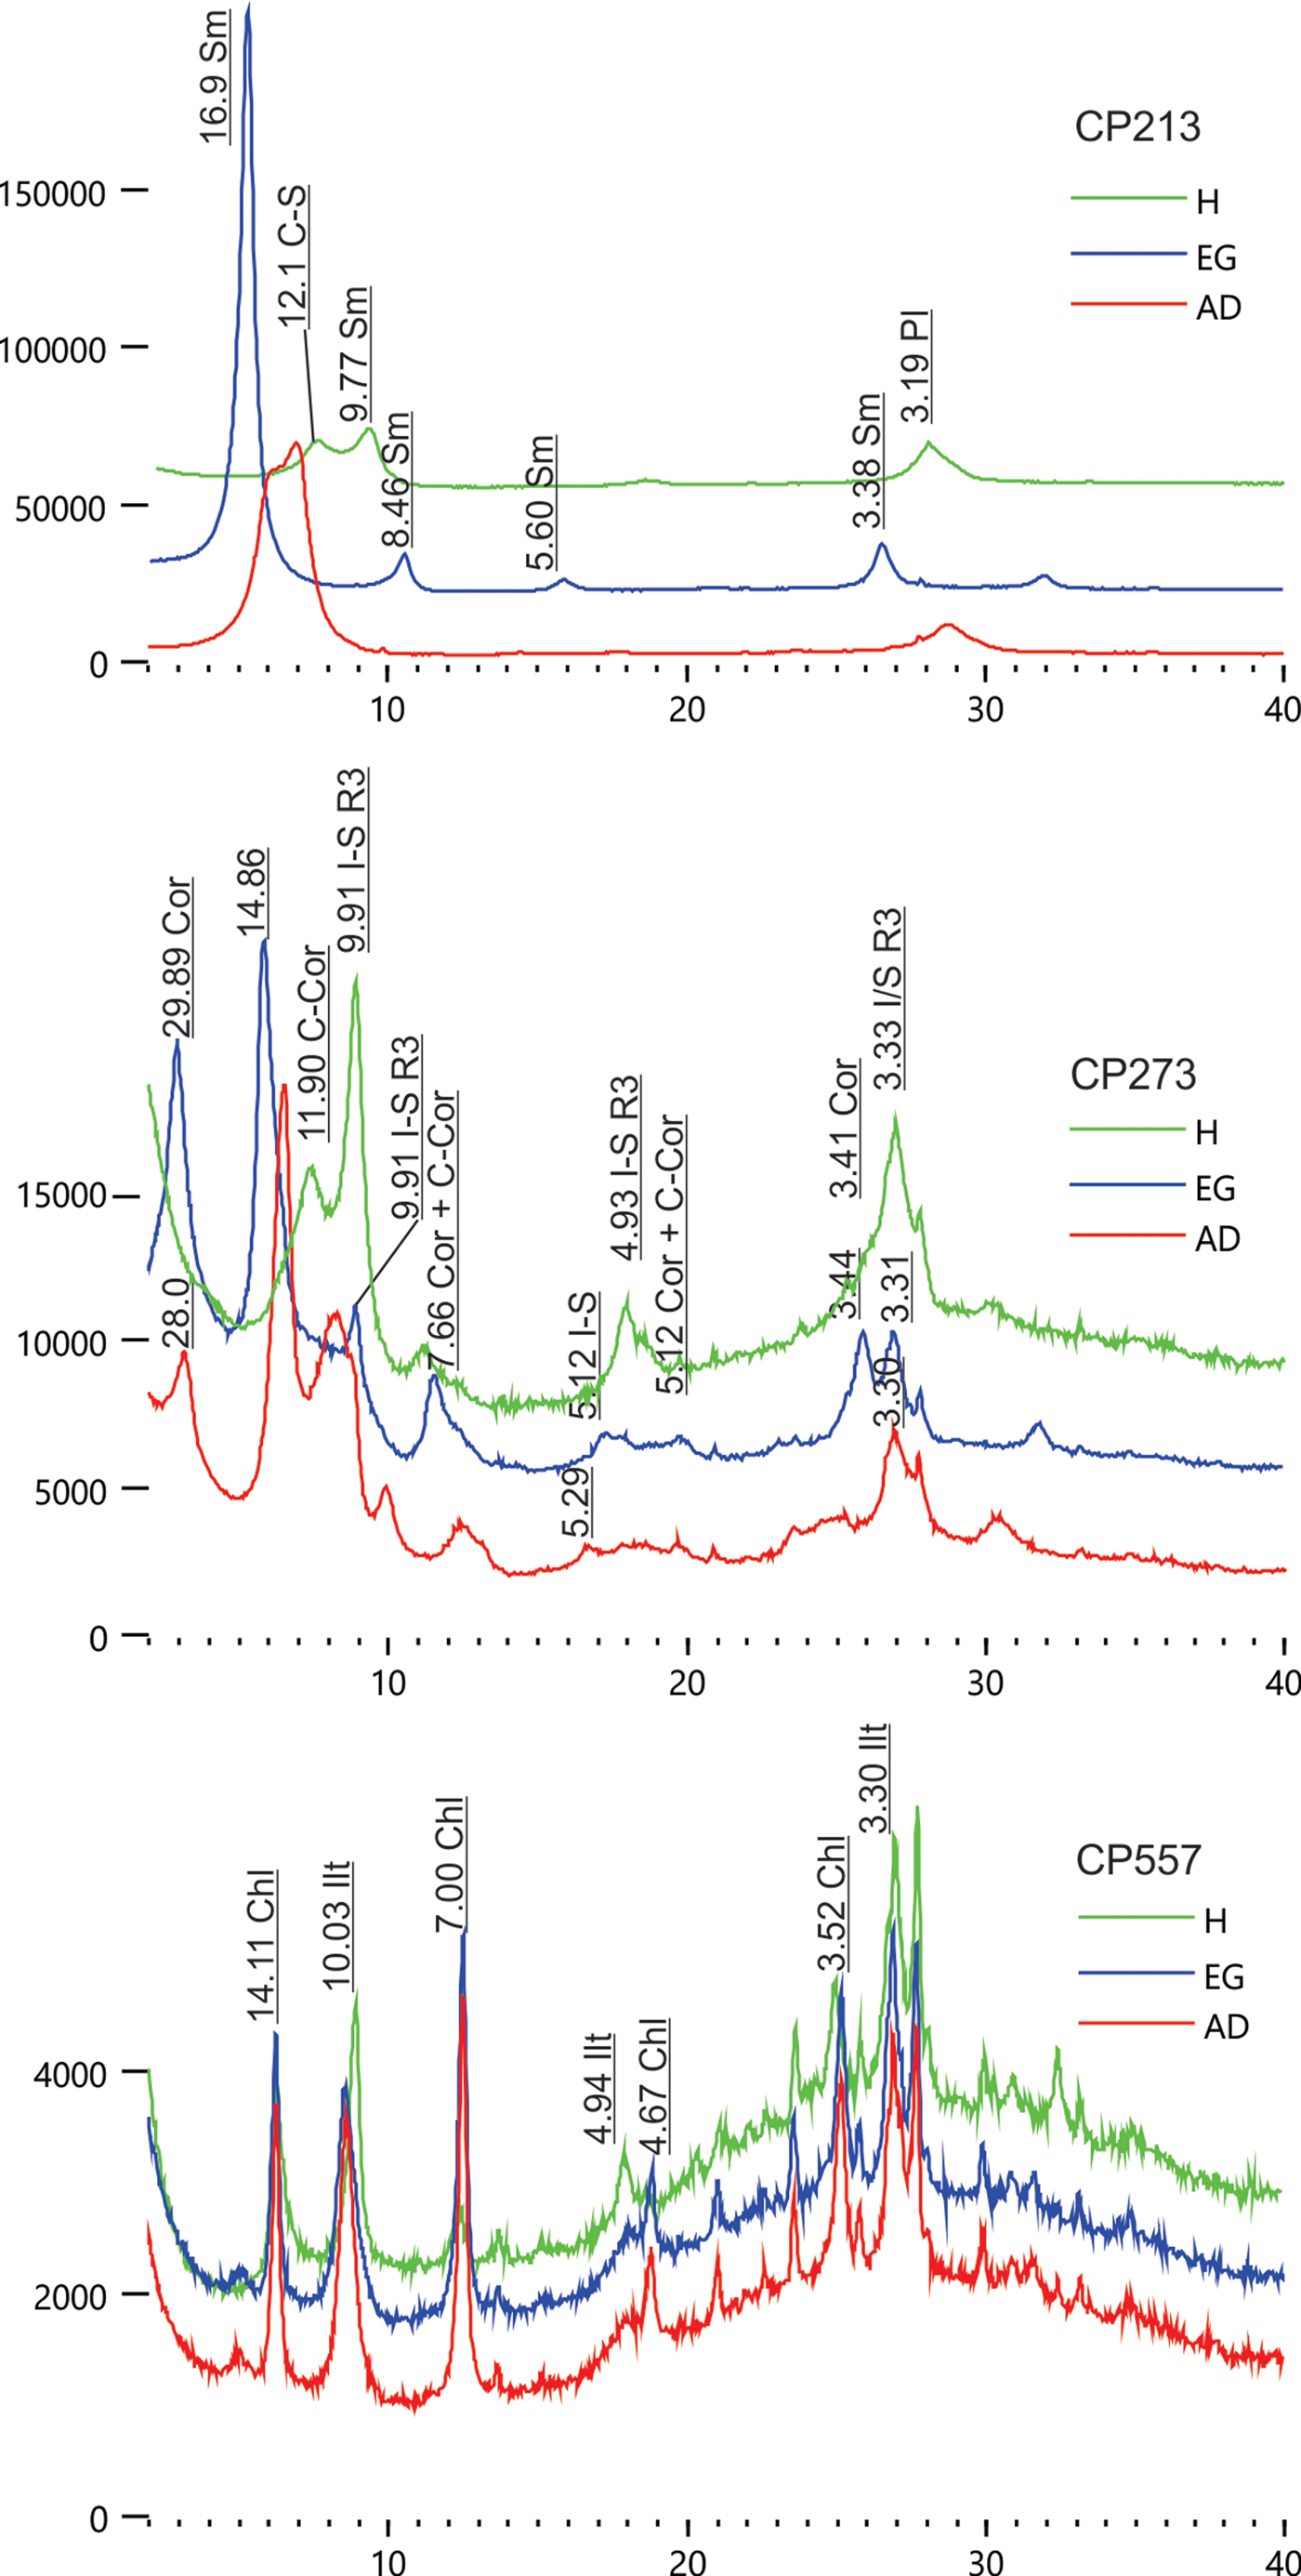
Fig. 4. XRD patterns in the <2 µm fraction of representative samples in the PexAP-1 well. Red: air dried; blue: after ethylene glycol solvation; green: heated at 500°C.
Table 1. Clay mineralogy of the PexAP-1 well. Sm: smectite; I-S: illite-smectite; Ilt: illite; C-S: chlorite-smectite; Cor: corrensite; C-Cor: chlorite-corrensite; Chl: chlorite. % of illite in I-S and in situ measured temperature are also shown.

Samples CP273 and CP401 contain R3-type I-S with illite contents which are not in agreement with those from the nearby samples. Mixed-layer C-S appears together with smectite in shallower levels between 213 and 346 m (Fig. 4a). Corrensite is also present discontinuously with R1 and R3-type I-S between 273 (Fig. 4b) and 434 m depth, whereas from 400 m to the bottom of the well, mixed-layer C-Cor coexists with chlorite and illite (Fig. 4c).
Kübler (KI) and Árkai indices
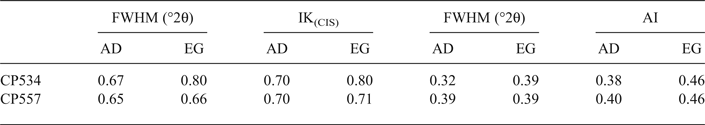
The KI(CIS) for illite-bearing samples from depths of 534 and 557 m (CP534 and CP557) shows a value of 0.70°∆2θ for AD samples and values of 0.80 and 0.71°∆2θ for EG samples (Table 2), indicative of temperatures of <200°C (diagenetic field) in sedimentary basins (Warr & Ferreiro Mahlmann, Reference Warr and Ferreiro2015). The small differences between the AD and EG preparations and the asymmetric form of the peak suggest illite interlayering with small amounts of R3-type I-S. Chlorite-bearing samples between depths of 534 and 557 m show Árkai indexes of 0.38 and 0.40°∆2θ for AD preparations and of 0.46 °∆2θ for EG preparations. The small variation between AD and EG preparations indicates that the presence of expandable layers in chlorite is negligible. The values obtained for Árkai indices are smaller than the KI(CIS) values obtained for the same samples.
Table 2. Kübler and Árkai index values of the samples from the PexAP-1 well.
Chlorite, white mica and smectite b-parameters
The positions of d 060 reflections for the samples studied from the top to the bottom of the well are shown in Fig. 5. For samples included within the interval recording mainly smectites, mixed-layer I-S and C-S (from CP313 to CP434), the d 060 spacings are 1.485–1.552 Å (Fig. 5), which correspond to b-parameter values of 8.91–9.312 Å consistent with the presence of both di- and trioctahedral phases (Beaufort et al., Reference Beaufort, Baronnet, Lanson and Meunier1997; Nieto, Reference Nieto1997; Moore & Reynolds, Reference Moore and Reynolds1997; Meunier, Reference Meunier and Meunier2005). In the samples from shallower depths, the b parameters are consistent with dioctahedral smectites and minor mixed-layer C-S (8.94 and 9.18 Å, respectively). The change of b parameters from ~8.94 Å (montmorillonite) towards 9.00 Å from CP313 to CP346 to CP434 might be related to the progressive appearance of R0 and R1-type I-S (Fig. 5). Reflections at 1.486 Å (b parameter = 8.92 Å) might be associated with the presence of some beidellitic compositions. For samples in the depth interval 534–557 m the b parameters indicate the occurrence of chlorite-bearing mixed layers (~9.3 and 9.18 Å, respectively) and dioctahedral micas (8.98 and 9.00 Å; Moore & Reynolds, Reference Moore and Reynolds1997; Nieto, Reference Nieto1997; Chemtob et al., Reference Chemtob, Nickerson, Morris, Agresti and Catalano2015).

Fig. 5. Positions of d 060 spacing for the studied samples from top to bottom of the PexAP-1 well. Sample numbers indicate depth below surface. Mont: montmorillonite; Bei: beidellite; Qz: quartz; C-S: chlorite-smectite; C-Cor: chlorite-corrensite; Ilt: illite; I-S: illite-smectite; Chl: chlorite.
Scanning electron microscopy
Typical SEM textures from each zone are shown in Figs 6 and 7. In the sample representative of the shallowest zone (CP313), widespread smectite replaces plagioclase, mafic phenocrysts and groundmass, or appears filling veins and showing a curved-lens morphology without preferred orientation (Fig. 6a,b). Moreover, smectite occurs filling small dissolution voids inside relict plagioclase and ferromagnesian minerals, showing a slightly crenulated to ribbon-like morphology, associated with Fe oxides and quartz, confirming an intense pervasive alteration (Gifkins et al., Reference Gifkins, Herrmann and Large2005). At 346 m depth (CP346, Fig. 6c,d) the clay minerals identified were mixed-layer I-S and C-S, with morphologies similar to those described for smectite in CP313. The C-S shows wavy to ribbon-like morphology; it appears filling veins or vesicles surrounded by thin ribbons of filamentous mixed-layer I-S (500–800 nm) and rimmed by quartz. Calcite is very frequent in veins surrounded by haloes of I-S and quartz (sample CP434, Fig. 6e,f). Mixed-layer C-S also appears as thin ribbons with a filamentous morphology; these were differentiated from I-S by their lighter grey tone, due to the greater average atomic number (Fig. 6c,d). From 510 m downwards, authigenic illite grows on phenocryst dissolution voids and veins showing a ribbon morphology, frequently in contact with chlorite (sample CP510, Fig. 7a–c). Chlorite forms clusters of ~1 µm long crystals, also filling voids (sample CP557; Fig. 7d). Phenocrysts replaced by illite and chlorite show titanite rims (Fig. 7d). Adularia (Fig. 7c) and sulfides, mainly pyrite, chalcopyrite and galena, appear from a depth of ~470 m, together with a decrease in Fe oxides, probably indicating a change in redox conditions.
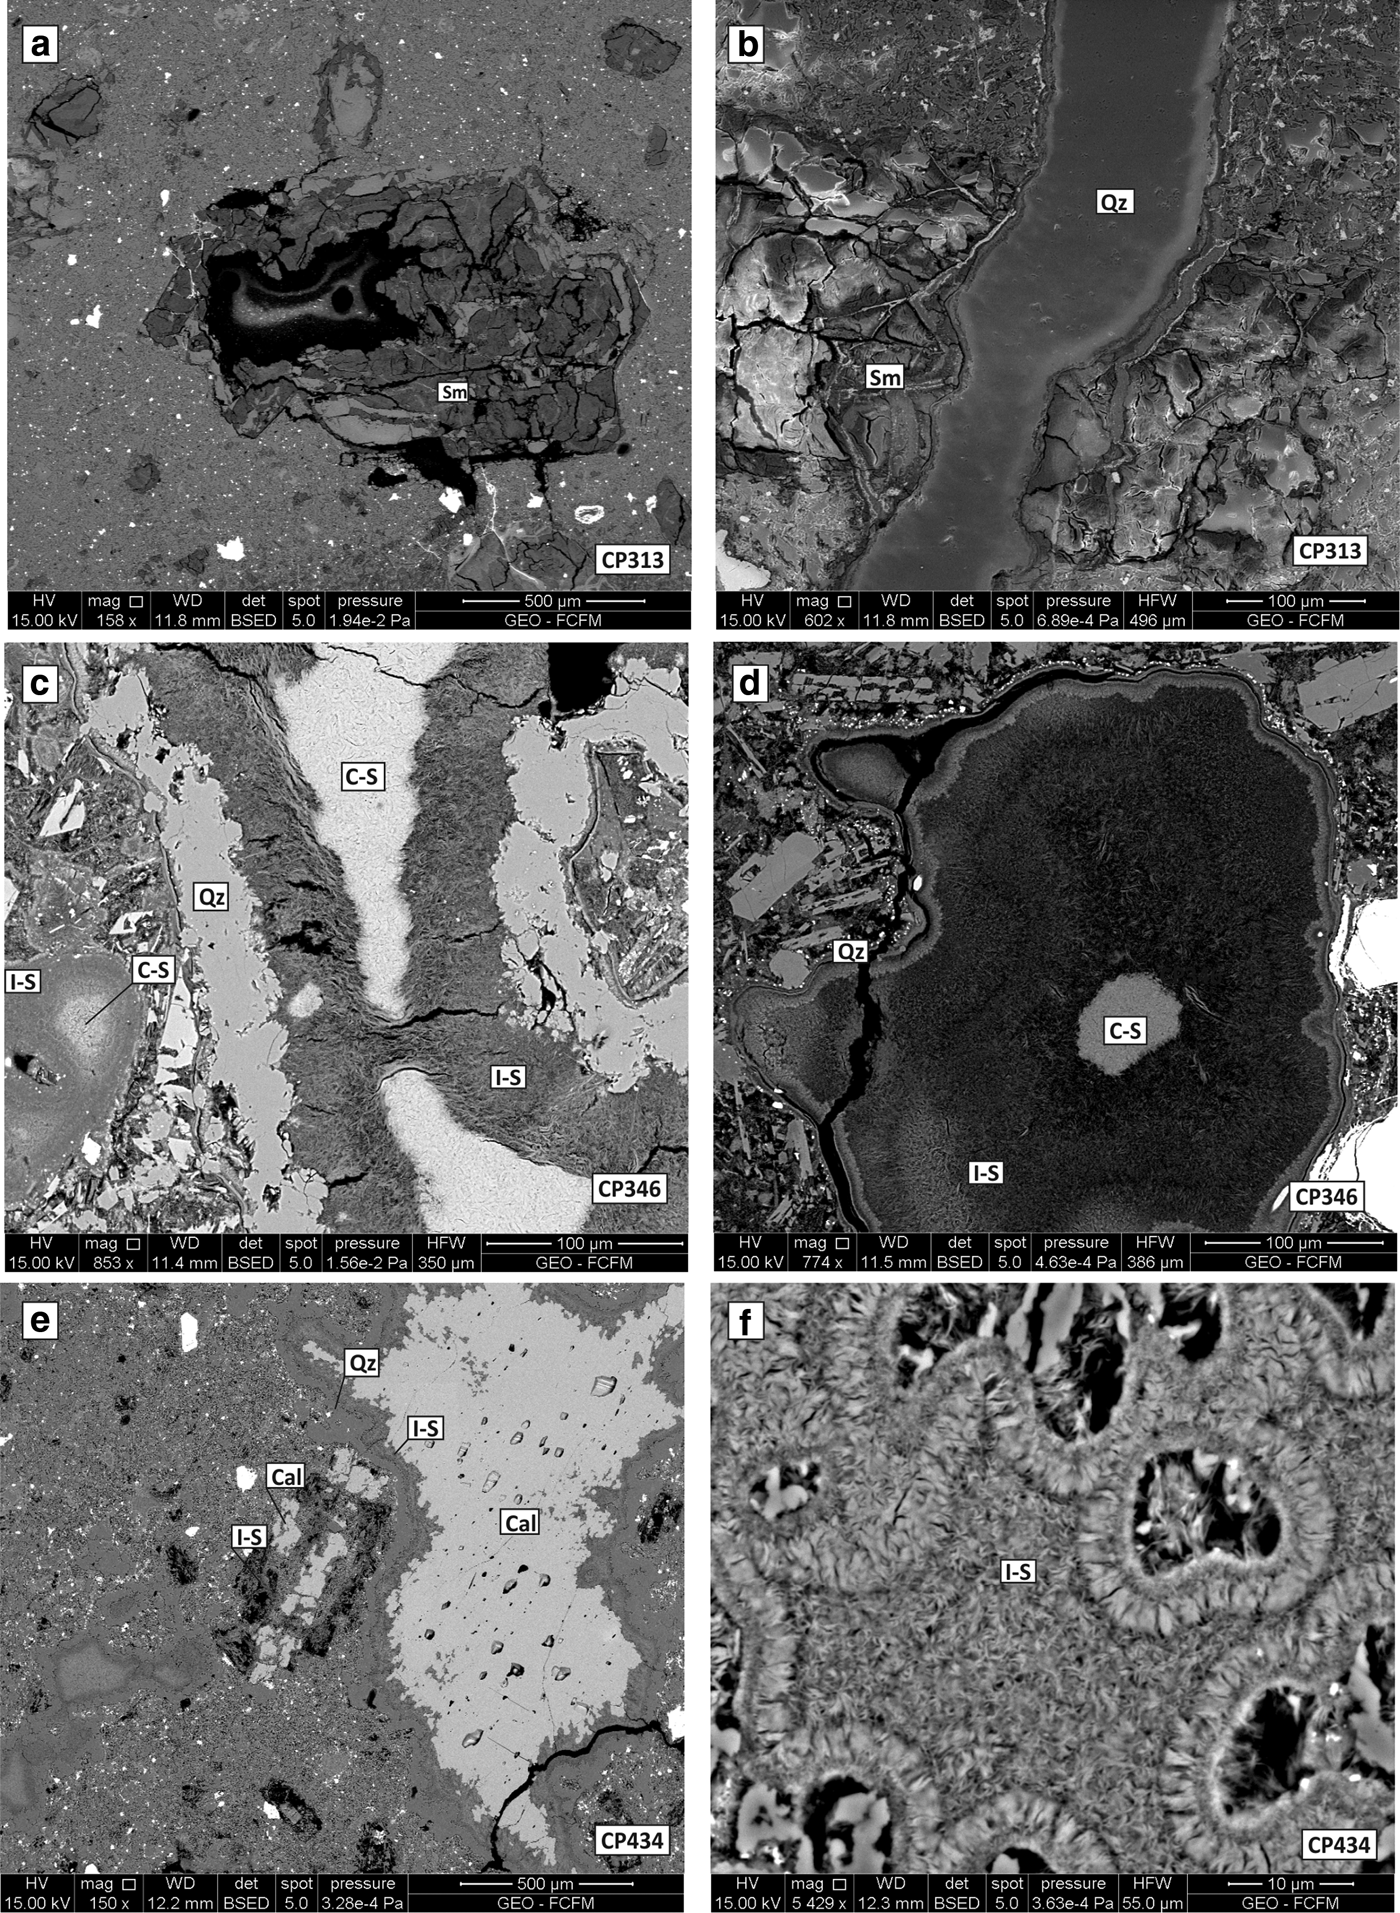
Fig. 6. Representative BSE images obtained using SEM from samples of the PexAP-1 well. (a) Slightly crenulated to ribbon-like smectite replacing plagioclase phenocrysts and the groundmass, associated with quartz and hematite; (b) vein consisting of quartz cross-cutting a smectitic matrix; (c) wavy to ribbon-like morphology of C-S filling veins and vesicles surrounded by thin ribbons of filamentous mixed-layer I-S and quartz rims; (d) vesicle consisting of mixed-layer C-S and I-S; (e) I-S and calcite replacing phenocryst and filling vesicle; (f) detail of (e) showing I-S ribbon-like morphology. Sm: smectite; Cal: calcite; C-S: chlorite-smectite; I-S: illite-smectite; Qz: quartz.
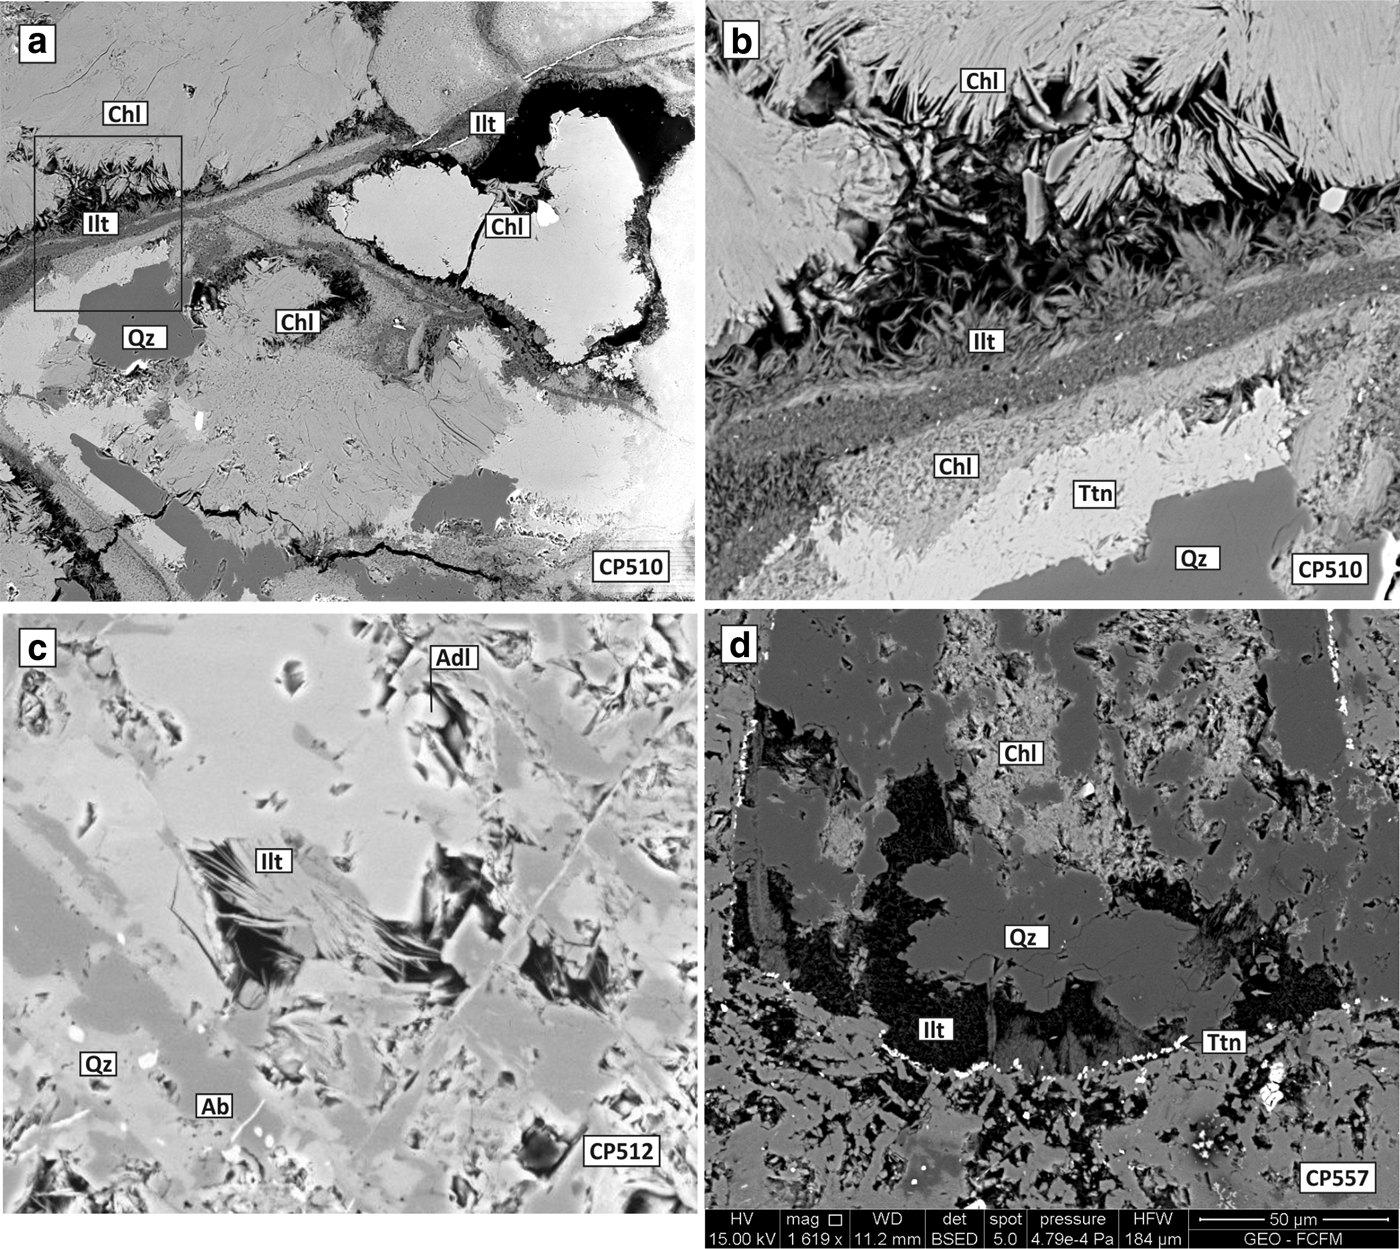
Fig. 7. Representative BSE images obtained using SEM from samples of the PexAP-1well. (a) Cluster of elongate chlorite in contact with illite; (b) detail of (a) showing ribbon morphology of illite in void and vein; (c) voids filled with filamentous illite and with quartz, albite and adularia crystals; (d) primary phenocrysts replaced by chlorite and illite with titanite rims. Qz: quartz; Ilt: illite; Tnt: titanite; Chl: chlorite; Adl: adularia; Ab: albite.
Chemical compositions
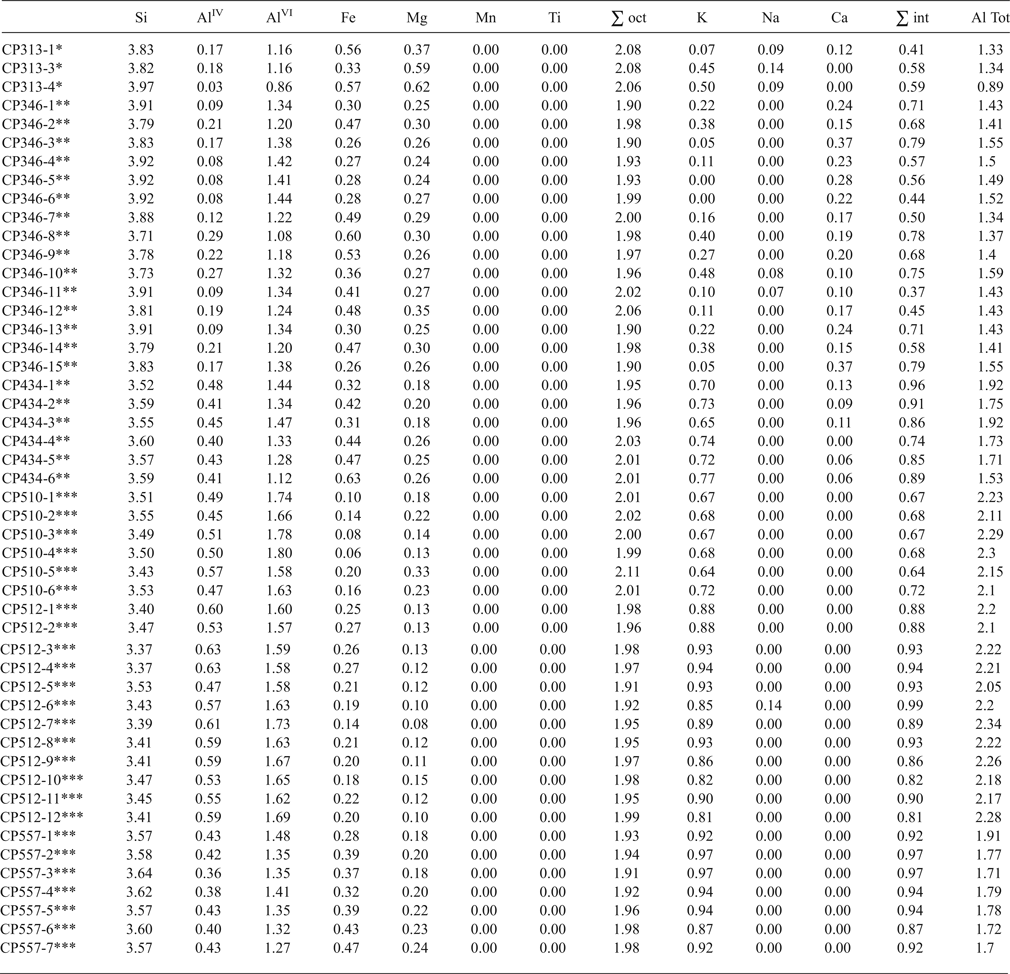
Dioctahedral clays
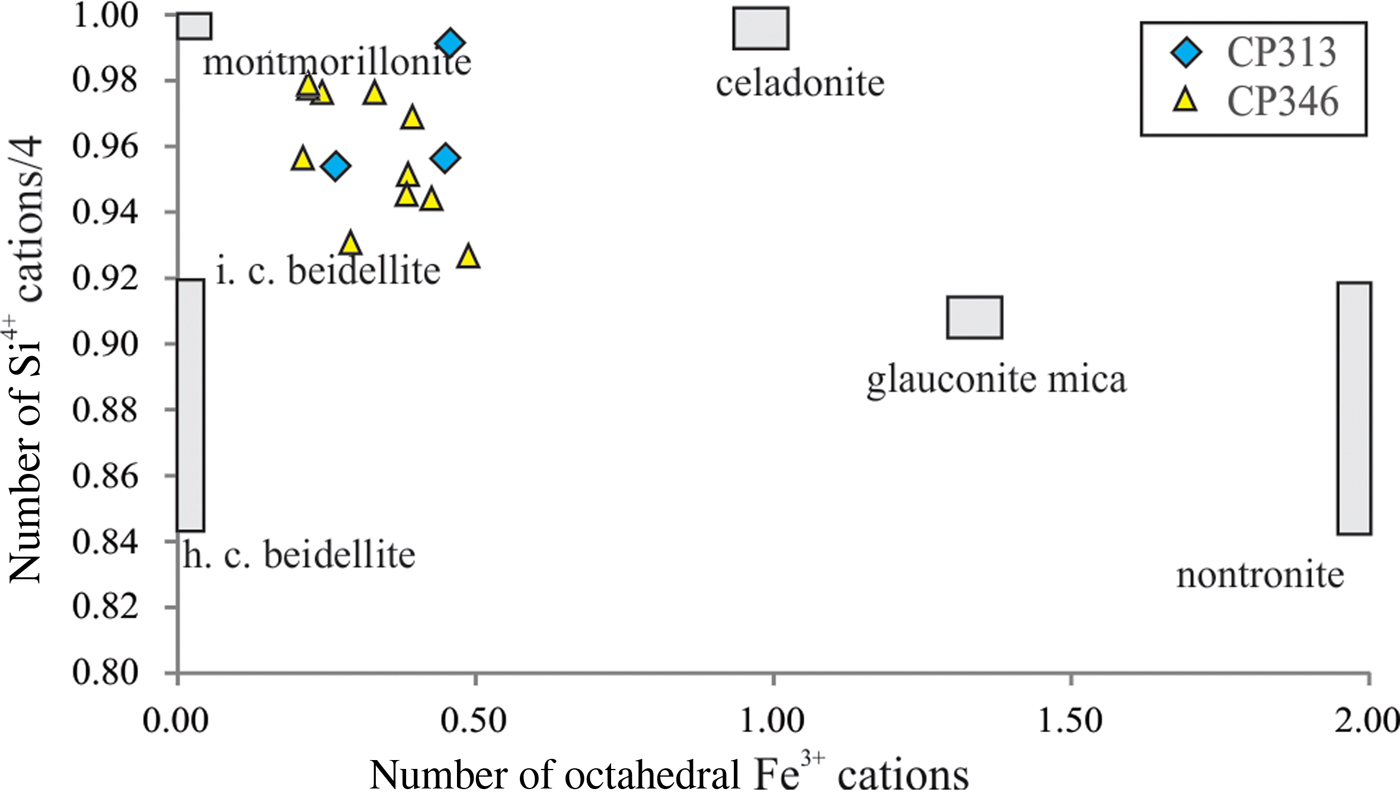
The structural formulae calculated from semi-quantitative EDS analysis corresponding to smectite, mixed-layer I-S and illite, which are compatible with dioctahedral types in all cases, with ∑oct ~2 a.p.f.u, are shown in Table 3. The shallowest sample (CP313), which consists mainly of smectites, according to XRD data, contains the most Si4+ and Mg2+, reflecting a montmorillonitic composition (Fig. 8), with Ca2+ and K+ being the major interlayer cations (0.41–0.59 a.p.f.u.). The presence of low octahedral occupancies in some places (Table 3) might indicate a mixture of dioctahedral clay minerals with other silicates from the matrix, e.g. quartz. In deeper samples (~346 m), where R0 I-S type is the main dioctahedral clay mineral, there is an increase in the Al3+ and K+ contents and a decrease in Si4+ and Ca2+ and a net increase in the interlayer charge (0.37–0.79 a.p.f.u.), which might be associated with the increase in illite layers in I-S (Figs 9, 10). The same trend was observed for samples with R1 I-S type and illites until a depth of 557 m. At a depth of 434 m, with prevailing R1 I-S, K+ is the dominant interlayer cation, with values varying between 0.65 and 0.77 a.p.f.u., and interlayer charges between 0.74 and 0.96 a.p.f.u. Between depths of 510 and 512 m, K+ ranges between 0.64 and 0.94 a.p.f.u., whereas interlayer charges are between 0.64 and 0.99 a.p.f.u., in accordance with the illite identified by XRD.

Fig. 8. Compositional diagram (number of octahedral Fe3+ vs. number of Si4+ cations/4 in a.p.f.u.) for the smectitic samples. Sample CP346, with I-S (R0) was also included.

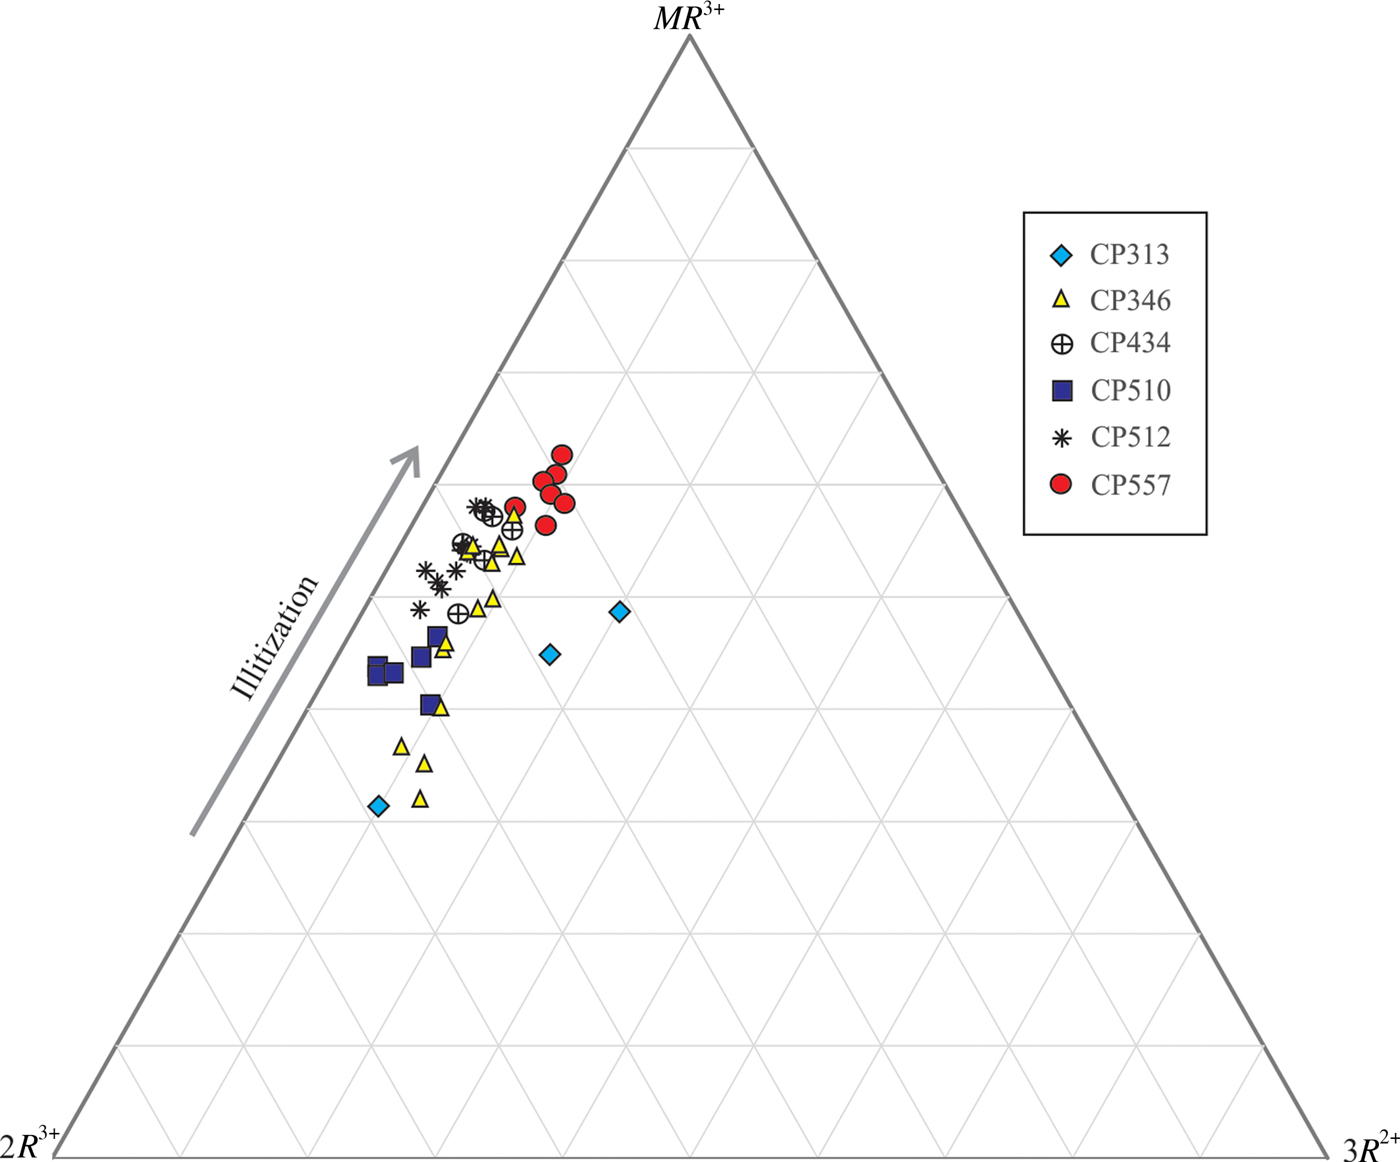
Fig. 9. MR3+-2R3+-3R2+ diagram (Velde, Reference Velde1985) showing the compositional evolution of smectite, I-S and illite. MR3+: Na++K++2Ca2+; 2R3+: (Al3++Fe3+-MR3+)/2; 3R2+: (Fe2++Mg2++Mn2+)/3.

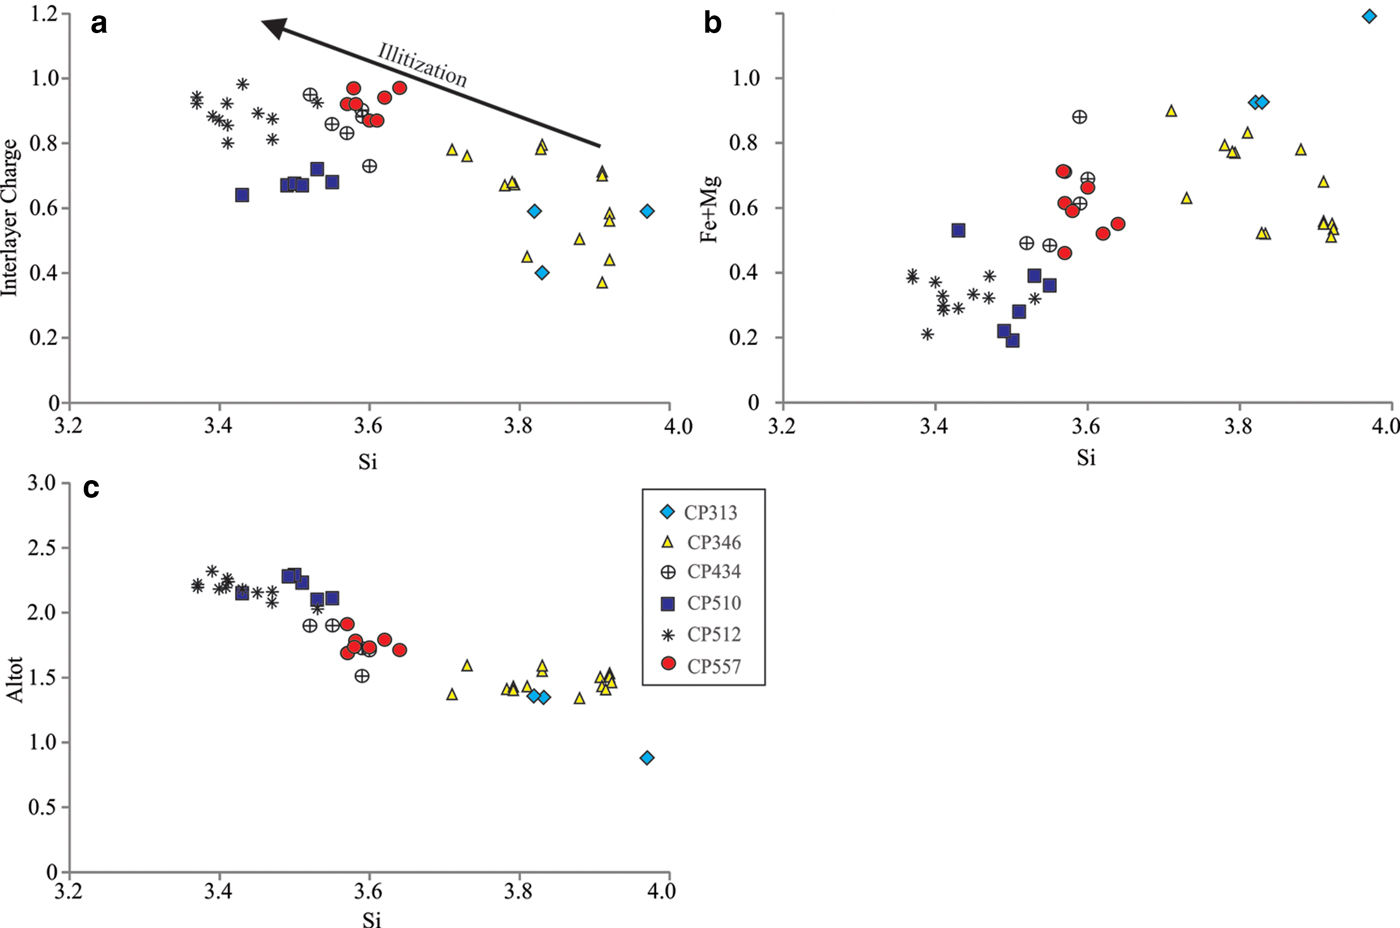
Fig. 10. SEM-EDS analyses of dioctahedral clays on: (a) Si vs. interlayer charge; (b) Si vs. Fe + Mg; and (c) Si vs. total Al diagrams.
Table 3. EDS analyses of smectites, mixed-layer I-S and illites normalized to O10(OH)2.
* Sm; ** I-S; *** illite.
The Fe + Mg content is greater in smectite and R0 I-S from samples CP313 and CP346 than in R1 I-S and illite until the depth of 557 m (Table 3; Fig. 10b). However, the deepest samples (557 m) do not follow this trend due to an increase in Si, Fe and Mg values and a decrease in Al (Fig. 10).
Trioctahedral clays
The structural formulae of chlorite-bearing mixed-layer phases are shown in Table 4. The relationships between M +–Si– and R 2+ cations are shown in Fig. 11. Trioctahedral clays from sample CP346 show compositions compatible with mixtures between pure chlorite and corrensite, as they depict lower Si/(Si + Al) ratios, interlayer charges and greater octahedral occupancies than corrensite. The Mg contents are greater than those of Fe and the main interlayer cation is Ca. At a depth of ~434 m (CP434), K+ is the main interlayer cation. From ~510 m depth downwards, the Fe2+ contents are greater than the Mg2+ contents in trioctahedral phases, consistent with the b-parameter values (~9.3 Å) that might be associated with chamositic chlorites (Nieto, Reference Nieto1997). Although the XRD analyses show that from depths of 451 m downwards there is a chlorite-rich domain, high Si4+ contents and interlayer charges up to 0.28 (K+, Ca+2) emphasize the presence of variable amounts of C-Cor (also identified through XRD; Table 1) and/or fine intergrowths of chlorite with other phyllosilicates (e.g. illite) below the resolution of EDS.

Fig. 11. M +-4Si-3R2+ diagram (Meunier & Velde, Reference Meunier and Velde1989) showing the compositional evolution of trioctahedral phases.
Table 4. EDS analyses of trioctahedral phases.

*C-S and Cor were normalized to O20(OH)10. ** C-Cor and Chl were normalized to O10(OH)8.
DISCUSSION
Distribution of secondary minerals and compositional evolution of clay minerals with depth
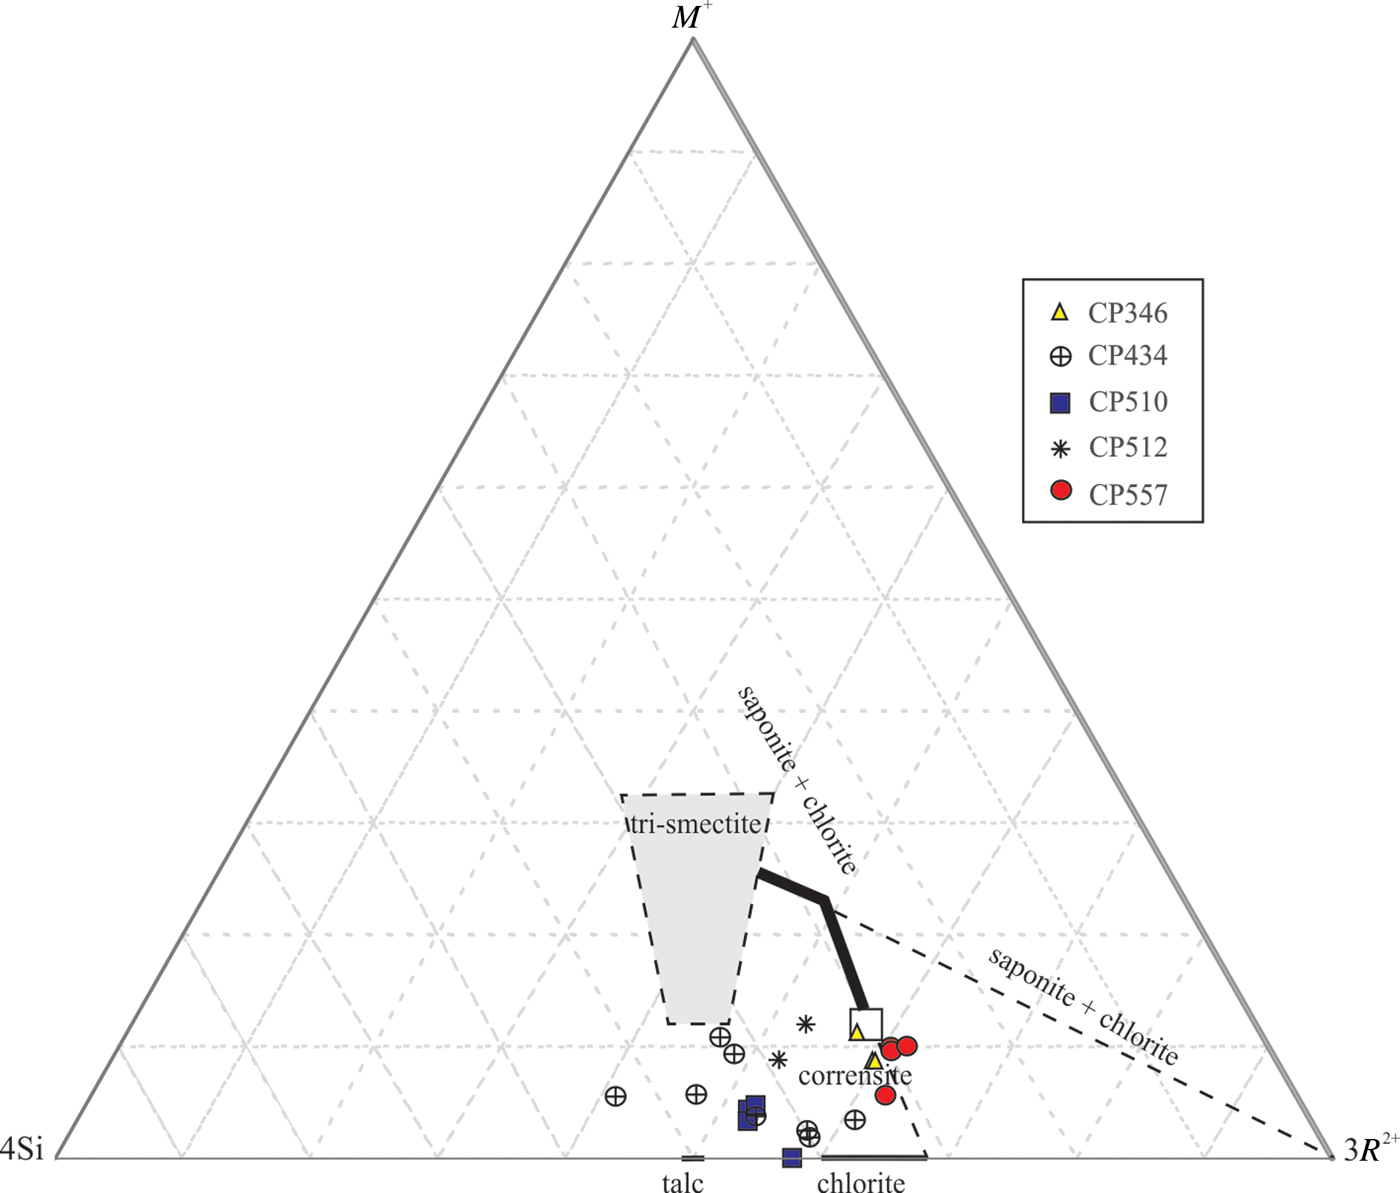
The present study differentiates several mineral assemblages down the wells that may be grouped into three main hydrothermal alteration zones (Fig. 12): (1) argillic zone; (2) sub-propylitic zone; and (3) propylitic zone. The argillic zone mainly affects the shallow part of the system, from 165 m to 315 m in the PexAP-1 well and from 175 m to ~360 m in the CP-1 well. In this interval, an intensive, pervasive alteration dominated by smectite replacing the phenocrysts and the groundmass is observed, associated with hematite, zeolites, calcite and quartz. The smectites mainly have a montmorillonitic composition (Figs 5 and 8; Table 3), typical of smectites associated with the early alteration products of volcanic glass (e.g. Bauluz et al., Reference Bauluz, Peacor and Ylagan2002; Guisseau et al., Reference Guisseau, Patrier-Mas, Beaufort, Girard, Inoue, Sanjuan, Petit, Lens and Genter2007), although some intermediate compositions between montmorillonite and beidellite cannot be ruled out, as is also suggested by XRD analyses (Figs 5, 8). Discrete smectite disappears completely at depths below 345 m, being replaced by I-S. The sub-propylitic zone operates over the depth interval 315–490 m in the PexAP-1 well and over 360–420 m depth in the CP-1 well. This zone is dominated by mixed-layer I-S with R0, R1 and R3 ordering, C-S, corrensite, C-Cor and chlorite, Na-plagioclase, quartz, calcite, hematite, stilbite and laumontite. The amount of expandable layers in I-S and C-Cor decrease with increasing depth and temperature (Table 1, Fig. 13), with random ordered R0 I-S type identified at 345 m depth, and regularly ordered R1 I-S type at 432–434 m depth. Some exceptions to this trend were observed, as illite-rich R3 I-S appears at ~270 and ~400 m depth (Table 1; Fig. 12). From a depth of 451 m until the propylitic zone (511 m) mixed-layer I-S with R3 ordering dominates. Finally, the propylitic zone, from depths of 490 to 557 m in the PexAP-1 well and from 420 to 825 m in the CP-1 well, is characterized by illite and chlorite as the main phyllosilicates, associated with mixed-layer C-Cor, epidote, Na-plagioclase, adularia, quartz, calcite, pyrite, chalcopyrite and titanite. The argillic and sub-propylitic zones, dominated mostly by clay minerals, represent a thick clay cap (~300 m thick), while the propylitic zone represents the beginning of the reservoir domain of the Cerro Pabellón geothermal system.
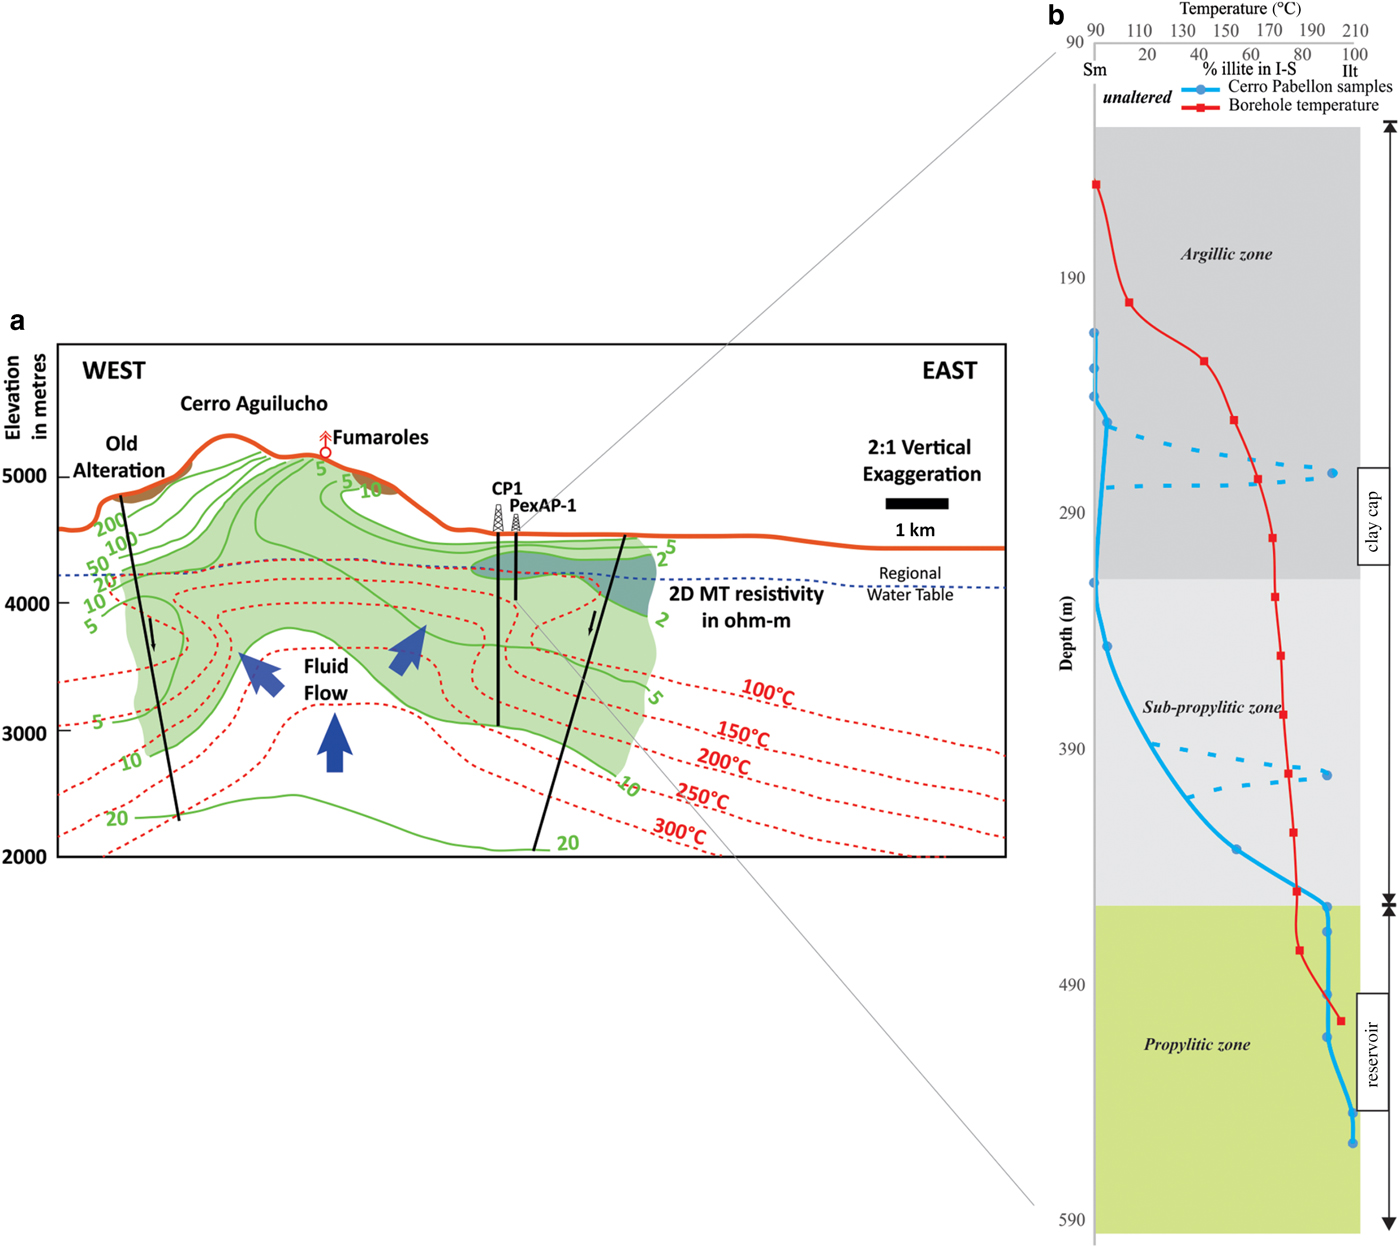
Fig. 12. Simplified conceptual model for the Cerro Pabellón geothermal system: (a) west to east simplified profile of the Cerro Pabellón area showing temperature isotherms and MT (magnetotelluric) resistivity data from Urzúa et al. (Reference Urzúa, Powell, Cumming and Dobson2002). Following these authors, the <10 ohm-m low resistivity layer was interpreted as a smectite clay cap overlying rocks at temperatures of >200°C as expected over geothermal reservoirs; the lowest (<2 ohm-m) resistivities detected in very shallow smectite clay zones were associated with parched fossil aquifers. (b) Clay-mineral evolution along the clay cap showing the variation in I-S content (blue line) and temperature (red line) along the profile.
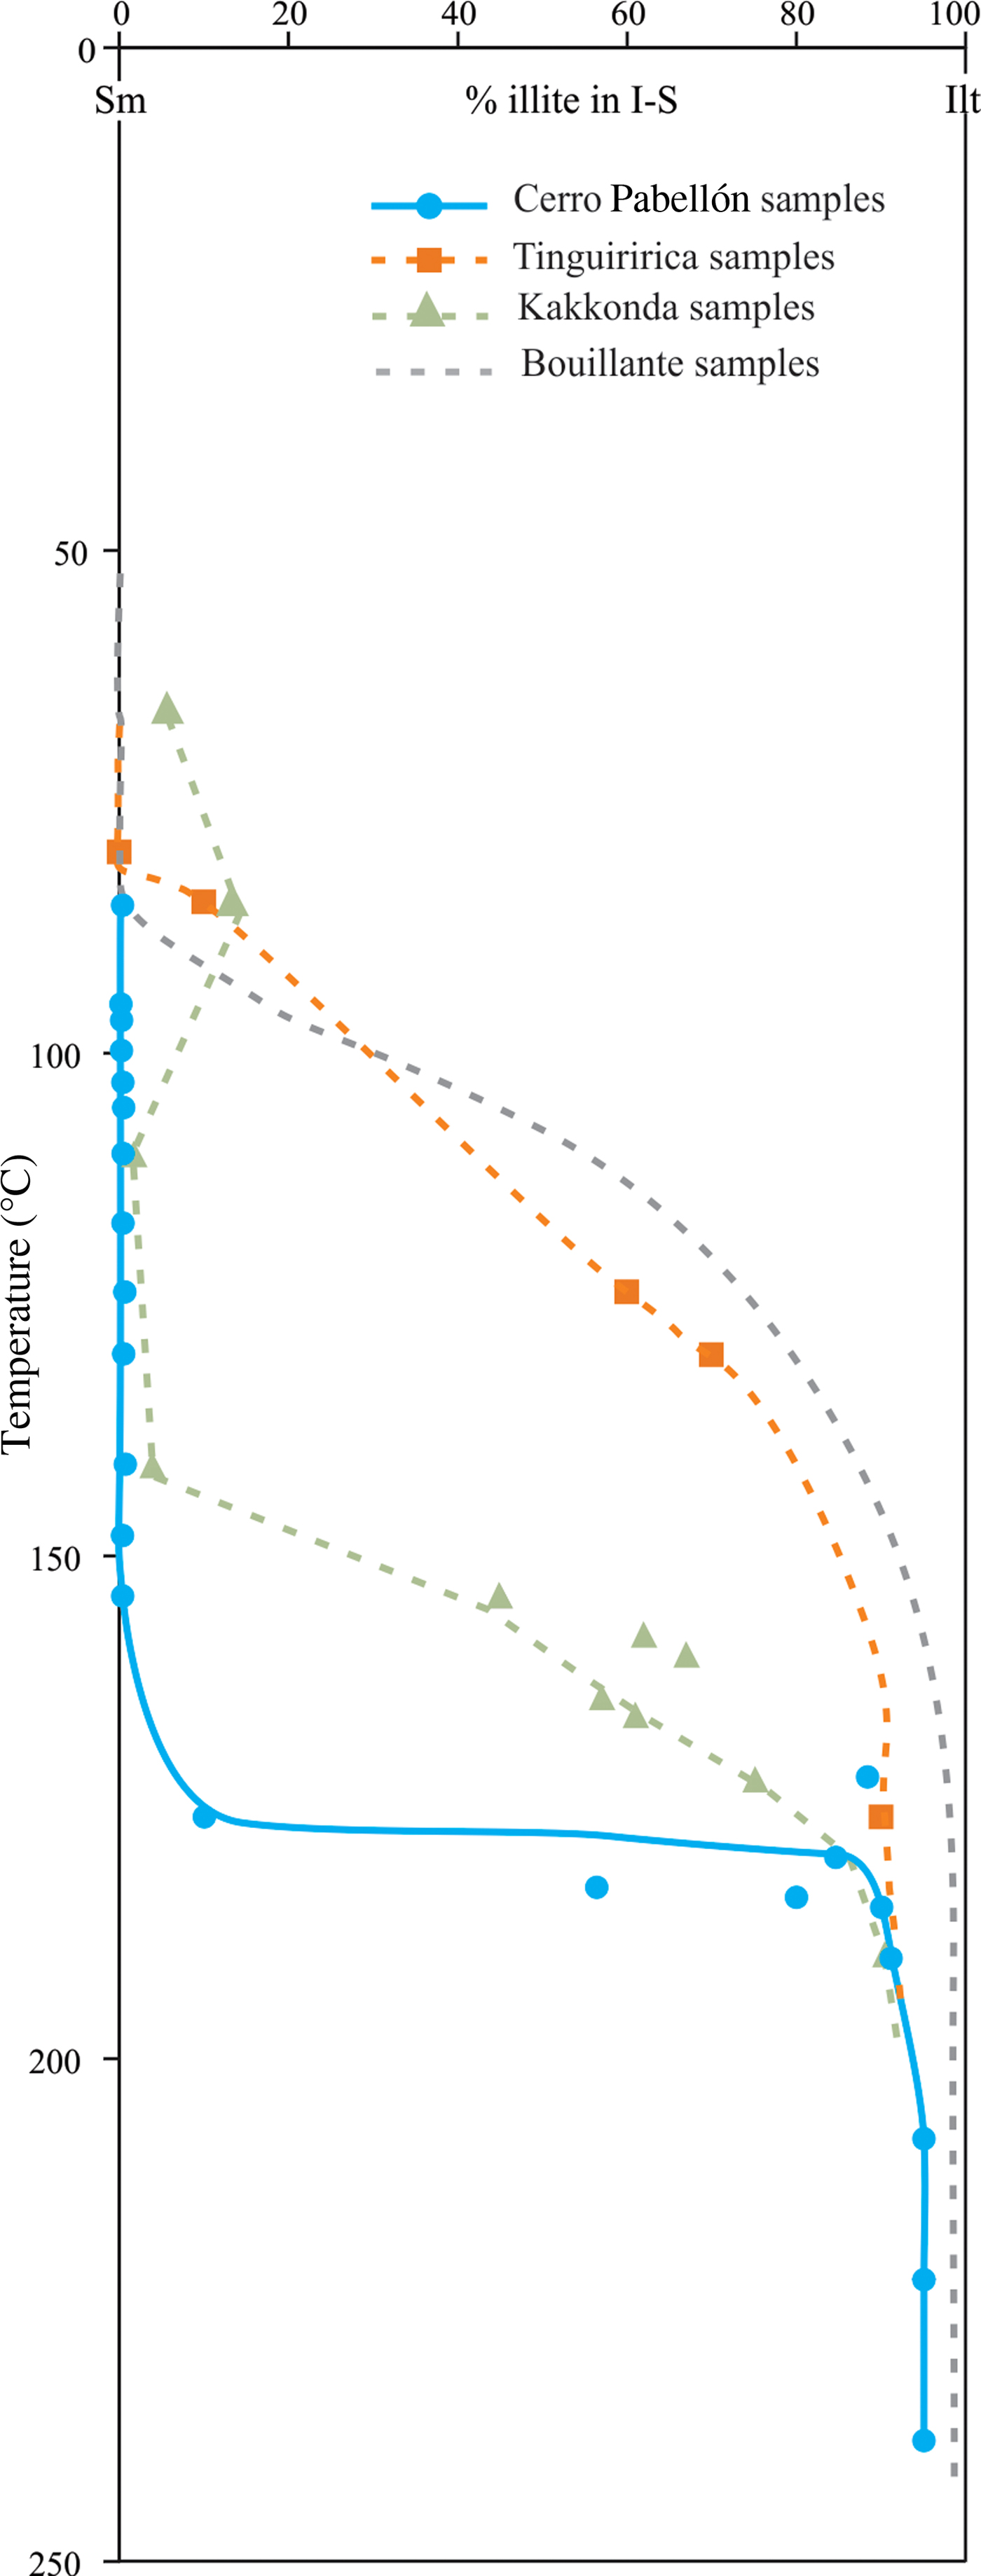
Fig. 13. Variation of % illite in I-S as a function of temperature in PexAP-1 drill core (Cerro Pabellon field), the Tinguiririca (Vázquez et al., Reference Vázquez, Nieto, Morata, Droguett, Carrillo-Rosúa and Morales2014), the Bouillante (Mas et al., Reference Mas, Guisseau, Patrier Mas, Beaufort, Genter, Sanjuan and Girard2006) and the Kakkonda (Inoue et al., Reference Inoue, Meunier and Beaufort2004) geothermal fields. Samples CP273 and CP401 are not included within the Cerro Pabellón trend.
X-ray diffraction analyses and the chemical compositions of smectites, mixed-layer I-S and illites show, with some exceptions, a progressive illitization with depth and through the three alteration zones (smectite → interstratified I-S → illite; Inoue et al., Reference Inoue, Meunier and Beaufort2004; Meunier & Velde, Reference Meunier and Velde1989). This trend is demonstrated by a decrease in Si4+ and an increase in interlayer charge with depth, which balances the tetrahedral charge due to the increase in Al3+ and decrease in Si4+ (Vázquez et al., Reference Vázquez, Bauluz, Nieto and Morata2016; Figs 9, 10). However, samples CP273 and CP401 contain R3-type I-S the illite contents of which are not in agreement with the progressive illitization trend. In those samples, R3-type I-S is associated with mixed-layer C-Cor. The illite b-parameter values (~8.98 Å) are compatible with the occurrence of dioctahedral clays with low Fe + Mg contents in the deepest levels (see Fig. 10; Moore & Reynolds, Reference Moore and Reynolds1997; Chemtob et al., Reference Chemtob, Nickerson, Morris, Agresti and Catalano2015), although a slight displacement to higher b parameters (greater Fe + Mg contents) was observed in the bottom of the well (sample CP557; 9.00 Å), in accordance with chemical data (see Fig. 10).
The evolution of trioctahedral clay phases in the PexAP-1 well begins with C-S in the shallower samples down to a depth of 345 m. Down to the bottom of the well, irregular C-S is replaced by corrensite associated with C-Cor with varying proportions of chlorite layers and chlorite between 401 and 434 m. An increase in Fe2+ and Al3+ contents relative to Mg2+ and Si4+, together with the presence of K+ as the dominant interlayer cation, is associated with these phase transitions. The increase in Fe contents occurs at temperatures >200 °C consistent with other published data (Beaufort et al., Reference Beaufort, Rigault, Billon, Billault, Inoue, Inoue, Patrier and Ferrage2015 and references therein).
Relationship between measured temperature and clay-mineral distribution
The transition of smectite to illite, via mixed-layer I-S has been reported widely in hydrothermal systems (Harvey & Browne, Reference Harvey and Browne1991, Reference Harvey and Browne2000; Mas et al., Reference Mas, Guisseau, Patrier Mas, Beaufort, Genter, Sanjuan and Girard2006; Vazquez et al., Reference Vázquez, Nieto, Morata, Droguett, Carrillo-Rosúa and Morales2014, Reference Vázquez, Bauluz, Nieto and Morata2016). On the other hand, the mineral transformation has also been considered to be the result of a thermally activated sequential transformation reaction proceeding via crystallization of mixed-layer I-S series (Meunier & Velde, Reference Meunier and Velde1989), or the result of simultaneous crystallization of the whole I-S via direct precipitation from solution (Inoue et al., Reference Inoue, Meunier and Beaufort2004). As already mentioned, dioctahedral clay minerals have been used to constrain temperatures in many geothermal systems (Harvey & Browne, Reference Harvey and Browne1991; Inoue et al., Reference Inoue, Kurokawa and Hatta2010), as the transition between the two end-member clays involved changes in chemical composition that might be related to temperature.
In geothermal systems, the ranges of temperature recorded for the appearance of smectite, I-S and illite are ~75–220°C, ~130–220°C and ~130–300+°C (Wohletz & Heiken, Reference Wohletz and Heiken1992; Day-Stirrat et al., Reference Day-Stirrat, Dutton, Milliken, Loucks, Aplin, Hillier and van der Pluijm2010; Vázquez et al., Reference Vázquez, Nieto, Morata, Droguett, Carrillo-Rosúa and Morales2014). At Cerro Pabellón, the clay cap consists of the argillic and sub-propylitic zones, characterized by low permeability and temperatures lower than ~190°C. The argillic zone is characterized by the occurrence of clinoptilolite and smectite as index minerals and temperatures between 90 and 175°C (from depths of 165 to 315 m; Fig. 12). The transition from the argillic to the sub-propylitic zones, with the replacement of smectite for R1 I-S, takes place at 180–185°C. The sub-propylitc zone (315 and 490 m depth; Fig. 13), characterized by (R1-R3) I-S, is related to borehole temperatures between 175 and 190°C. Finally, the propylitic zone, with illite (from 490 m downwards), records temperatures >190°C (Fig. 12).
Despite having comparable geothermal gradients, the temperature at which the replacement of smectite for R1 I-S takes place in Cerro Pabellón (180–185°C), is higher than those reported for other similar geothermal fields such as the Tinguiririca geothermal field of Central Chile (80–120°C; Vazquez et al., Reference Vázquez, Nieto, Morata, Droguett, Carrillo-Rosúa and Morales2014) and the Bouillante geothermal field of Guadeloupe island (110–160°C; Mas et al., Reference Mas, Guisseau, Patrier Mas, Beaufort, Genter, Sanjuan and Girard2006; Fig. 12). Similar temperatures (~180°C) were described for the appearance of R3 I-S in the three geothermal fields. On the other hand, the relationship between the distribution of dioctahedral phases and temperatures in the PexAP-1 well is comparable to those observed in other geothermal systems such as Kakkonda (Japan; Inoue et al., Reference Inoue, Meunier and Beaufort2004; Fig. 13). These systems are characterized by an abrupt change from smectite to R1 I-S type, with negligible presence of R0 ordering phases (Bethke & Stephen, Reference Bethke and Stephen1986), showing a sigmoidal variation of the illite layers in I-S.
The different temperatures at which the smectite–R1 I-S transition takes place at Cerro Pabellón, Tinguiririca and Bouillante geothermal fields have been attributed to differences in temperature, fluid composition, fluid/rock ratio, permeability, time, oxygen-activity conditions (fo2) and chemical composition of the precursor material (Meunier, Reference Meunier and Meunier2005; Vidal et al., Reference Vidal, Lanari, Munoz, Bourdelle and Andrade2016), together with variations in the formation mechanisms. The fluid composition is intimately related to the composition of the rocks (availability of K+, Na+, Al3+, Si4+; Inoue et al., Reference Inoue, Meunier and Beaufort2004). For Cerro Pabellón, Tinguiririca and Bouillante geothermal fields, the XRD bulk-rock analysis and textural study and EDS analysis of samples from the argillic and sub-propylitic zones, show that clay minerals form mainly by direct precipitation from fluids after leaching of K+ from dissolution of volcanic glass or feldspar, so the availability of K+ might not explain the recorded differences itself. The observed differences might indicate at least in part, the efficiency of the clay cap in restricting the circulation of fluids of hydrothermal origin. In Cerro Pabellón, the clay cap constitutes a low-permeability environment that is responsible for the absence of surface manifestations. Differences might also be related, at least partially, to the short time interval from the beginning of the hydrothermal processes to the present. Although the influence of time on these systems is controversial (Meunier, Reference Meunier and Meunier2005; Inoue et al., Reference Inoue, Meunier and Beaufort2004), the time span during which the illitization processes have been developed should not be discounted as a possible cause of the different transition temperatures; Ji & Browne (Reference Ji and Browne2000) postulated that time may explain the differences observed between the Waiotapu and Ohaaki-Broadlands active geothermal systems in New Zealand that have comparable potassium content and permeability. Inoue et al. (Reference Inoue, Meunier and Beaufort2004) also mentioned the influence of short periods on the evolution of hydrothermally altered rocks of geothermal systems.
Wide temperature ranges have been recorded for the presence of trioctahedral phases in geothermal systems. Corrensite has been recorded at between 100 and 200°C (Inoue & Utada, Reference Inoue and Utada1991). The complete conversion of corrensite to discrete chlorite is completed above 240°C (Keith & Bargar, Reference Keith and Bargar1988; Beaufort et al., Reference Beaufort, Patrier, Meunier and Ottaviani1992; Inoue, Reference Inoue and Velde1995). In the case of the PexAP-1 well, corrensite appears at between 172 and 183°C, while the C-Cor and chlorites are present from 180°C. The complete disappearance of corrensite takes place at 183°C. Unlike dioctahedral phases, these temperatures are comparable with those recorded in the Tinguiririca geothermal system, in which the association of low-charge corrensite and discrete chlorite was recorded between 140 and 215°C (Vázquez et al., Reference Vázquez, Nieto, Morata, Droguett, Carrillo-Rosúa and Morales2014). This might be attributed to the greater availability of Fe2+ and Mg2+ relative to K+, which are related directly to initial composition of the fluids, lithology and fluid:rock ratios and temperature of the fluids entering the system.
Although the Kübler index was developed as a tool for measuring reaction progress in low-grade metamorphism (see Abad et al., Reference Abad, Nieto, Gutierrez-Alonso, Do Campo, Lopez-Munguira and Velilla2006 and Warr & Ferreiro Mahlmann, Reference Warr and Ferreiro2015 for reviews), it was also applied to characterize the clay minerals associated with hydrothermal fields (cf McDowell & Elders, Reference McDowell and Elders1980; Ji & Browne, Reference Ji and Browne2000; Li et al., 2005; Franchini et al., Reference Franchini, Impiccini, Meinert, Grathoff and Schalamuk2007; Prasetyo et al., Reference Prasetyo, Sardiyanto, Koestono and Thamrin2015; Maydagan et al., Reference Maydagan, Franchini, Impiccini, Lentz, Patrier and Beaufort2018). KI(CIS) values of 0.70°2θ obtained from samples from the propylitic zone are related to borehole temperatures of 220–240°C (interpolated for each depth according to direct temperature measurement in boreholes; Tables 1 and 2). These KI(CIS) values are comparable with those reported for active geothermal fields in New Zealand (KI(CIS) values of 0.6-0.71°2θ, Ji & Browne, Reference Ji and Browne2000) and Indonesia (Prasetyo et al., Reference Prasetyo, Sardiyanto, Koestono and Thamrin2015), with temperatures of between 220 and 255°C. In both cases the borehole temperatures are higher than those suggested for the diagenesis to anchizone boundary in burial environments, in which the index was developed (~200°C Merriman & Peacor, Reference Merriman, Peacor, Frey and Robinson1999). On the other hand, chlorites show Árkai index values which are less than the KI(CIS) values (Table 2). Although the geotectonic context is substantially different, similar relationships were recorded for pelites corresponding to zeolite facies from the South Island (New Zealand, Warr & Cox, Reference Warr and Cox2016), which show KI(CIS) values of 0.52 and 0.32°2θ correlating with Árkai indexes of 0.41 and 0.31°2θ, respectively. In addition to temperature, the availability of K+, in the case of illite, and of Mg2+ and Fe2+ in the case of chlorite, should strongly influence both the reaction paths and rates of crystal growth (Huang et al., Reference Huang, Longo and Pevear1993; Jahren & Aagaard, Reference Jahren and Aagaard1989).
In the PexAP-1 well two levels at 273 and 400 m containing R3 I-S are outside the observed illitization trend. Sample CP273 belongs to the argillic zone, dominated by smectites, whereas sample CP400 corresponds to the sub-propylitic zone in the transition from R0 to R1 I-S. There is no relationship between the lithological variations in the well and the appearance of R3 I-S at these levels; moreover, the K+ and Ca2+ contents, mainly associated with K-feldspar and calcite, display similar variations throughout the well (Fig. 3). The occurrence of R3 I-S in these levels, >100 m apart on the vertical scale, might be explained by local fluctuations in fluid:rock ratios, mentioned above as a significant variable in the formation of clay minerals. The andesitic levels at which the specific R3 I-S occurs are interlayered in an area dominated by polymictic breccias, possibly leading to zones of greater permeability in the system, associated with hydrostatic fracturing. The veins and fractures described in the drill core are mostly sub-vertical. On the other hand, the brecciation zones would be more susceptible to alteration gradually reducing its permeability and thus the capacity of fluids and heat transmission. It is also possible that these local outflows were developed earlier than the upflows, precisely in these localized andesitic zones favourable for fluids, and thus heat circulation, so the time associated with the mineral transformations would have been longer. A less likely alternative is that these levels represent relics of a higher-temperature, older upflow system, the system currently being in a cooling stage, although there is no clear textural evidence to support this interpretation.
CONCLUSIONS
The blind nature of the Cerro Pabellón geothermal system might be related to the thickness and low permeability of the clay cap (~300 m). Two main clay-minerals reaction series were detected in this clay cap: the smectite to illite and the smectite to chlorite transformations. In fact, the final phases of both reaction series, illite and chlorite, only prevail in rock samples from the reservoir domain, where mixed-layer I-S and C-S are almost absent. In both reaction series, a continuous and slow reduction of the proportion of smectite layers in mixed layers with depth was observed. The discrepancy observed between increase in temperature with depth and the negligible variation in the mixed-layer I-S in the clay cap might be explained by a kinetic rather than a temperature-controlled reaction progress. The impermeability of the clay cap of the Cerro Pabellón blind geothermal field, would not favour the advance of I-S and C-S reaction series. Thus the replacement of smectite by R1 I-S takes place at ~180–185°C, i.e. at higher temperatures than other geothermal fields. In contrast, in the reservoir domain, where permeability is much greater than in the clay cap, the appearance of chlorite and illite really fit with those temperatures recorded in the literature. Detailed study by XRD of clay minerals might help to understand the formation processes of the hydrothermal minerals and how these mineralogical transformations might be controlled not only by temperature (and depth) but also by kinetics related to permeability/porosity that might enhance (or impede) mineral transformations. Consequently, detailed studies of alteration minerals in continuous drill cores should improve the data available for better understanding of the processes that control the development of alteration zones in active geothermal fields and thus the reliability of conceptual models.
ACKNOWLEDGEMENTS
The present study was supported by the Fondap-Conicyt project 15090013 “Centro de Excelencia en Geotermia de Los Andes (CEGA)”. M.T., E.C. and M.P. are grateful for financial support from the University of Urbino (M.T.) and CONICYT (Chile, E.C. & M.P.) for their respective, PhD grants. G.C. acknowledges financial support from PUE 2016 - CONICET – CICTERRA and ANPCyT. The authors are particularly grateful to Guido Cappetti (Geotérmica del Norte – GDN- and ENEL Green Power Chile) for provision of the facilities used to carry out this study and for samples of the exploratory drill-core material. Reviews by Margarita DoCampo, Fernando Nieto and an anonymous reviewer are also acknowledged sincerely; they helped to improve this work.