


High-quality clays are abundant in Tunisia, and due to their chemical and mineralogical composition, they find a wide range of applications in brick manufacturing, pottery and the ceramics industry, particularly the production of earthenware and stoneware. The desired industrial application depends on the physicochemical and mineralogical characteristics and thermal behaviour of the clays. Previous studies have focused on the suitability of Tunisian clays as raw materials for traditional ceramics (Baccour et al., Reference Baccour, Medhioub, Jamoussi, Mhiri and Daoud2008; Felhi et al., Reference Felhi, Tlili, Gaied and Montacer2008; Jeridi et al., Reference Jeridi, Hachani, Hajjaji, Moussi, Medhioub and Lòpez-Galindo2008; Mahmoudi et al., Reference Mahmoudi, Srasra and Zargouni2008, Reference Mahmoudi, Srasra and Zargouni2010; Hajjaji et al., Reference Hajjaji, Hachani, Moussi, Jeridi, Medhioub and López-Galindo2009; Ben M'barek-Jemaï et al., Reference Ben M'barek-Jemaï, Karoui-Yaakoub, Sdiri, Ben Salah, Azouzi and Duplay2015; Bennour et al., Reference Bennour, Mahmoudi, Srasra, Boussen and Htira2015, Reference Bennour, Mahmoudi and Srasra2018; Boussen et al., Reference Boussen, Sghaier, Chaabani, Jamoussi and Bennour2016; Ben M'barek-Jemaï et al., Reference Ben M'barek-Jemaï, Sdiri, Ben Salah, Ben Aissa, Bouaziz and Duplay2017). The thermal behaviour, the firing properties and ceramic applications of some Tunisian clays have also been investigated (Mahmoudi et al., Reference Mahmoudi, Srasra and Zargouni2010; Bennour et al., Reference Bennour, Mahmoudi, Srasra, Boussen and Htira2015). Indeed, ceramic properties are linked to the chemical and mineralogical composition of the raw clay materials. The presence of impurities affects the firing behaviour, triggering the sintering process at low temperatures. Significant transformations can occur as a result of endothermic and exothermic reactions, which take place in several distinct steps (depending on the temperature): first is the dehydroxylation of clay minerals, mainly kaolinite, illite and smectite; this is followed by recrystallization, which results in the formation of metakaolinite; then the transformations of illite and smectite into their anhydrous forms occur after the release of water by condensation of the OH groups; and, finally, we have the formation of spinel-type phases and amorphous SiO2 (Nigay et al., Reference Nigay, Cutard and Nzihou2017) The presence of structural iron, which substitutes for Al in the clay structure, may cause mineral speciation and contributes to the formation of hematite after firing at 900°C. Mullite first appears at ~950°C and continues to develop up to 1100°C. Clayey materials containing calcite first form gehlenite as a metastable intermediate phase from metakaolinite and calcium oxide, which transforms into anorthite at higher temperatures. Amorphous SiO2 released during mullite formation and partial quartz melting occurs at high firing temperatures, contributing to the glassy phase. Consequently, the formation of both crystalline and glassy phases promotes densification at low temperatures and improves the mechanical properties of ceramic bodies (Baccour et al., Reference Baccour, Medhioub, Jamoussi and Mhiri2009).
This study focused on valorization of the Miocene clay materials in Cap Bon Basin. The aim is to evaluate their firing properties based on physical–chemical and mineralogical characterization to determine their suitability for ceramic applications. Representative clay samples were collected from the Miocene clay deposits in the Cap Bon region (Fig. 1). Thereafter, three clay mixtures (M1, M2 and M3) were prepared and fired at 900°C, 1000°C and 1100°C. Finally, the physical–mechanical properties of the fired products were evaluated by assessing their linear shrinkage (LS), water absorption (WA) and flexural strength (FS).

Fig. 1. (a) Map locations of studied areas (Tazoghrane, Tamozrat and El Mida), (b) geological cross-section (b) and (c) lithostratigraphic column of the studied clay formation with sample positions.
Materials and methods
Materials and sampling
The raw clay materials used in this study were obtained from the Middle to Upper Miocene sedimentary formations in the Cap Bon region, northern Tunisia, which are differentiated by their large outcrops exposed over large areas and organized into three large clay sequences. The lower clays, identified in the Tazoghrane area, are grey, low-plasticity clays with some intercalated sandstone levels. Four samples (Tazh1–4) were obtained from this clay series. The overlying clays, cropping out in the Tamozrat area, are grey-green, moderately plastic clays. Three samples (Tamz1–3) were taken through this clay sequence. The overlying clays, identified in the El Mida area and known as potters’ clays, are green plastic clays. Two samples (Elm1 and Elm2) were collected from this series. These clays may be used for the production of ceramics as they have a suitable mineralogical composition with kaolinite and illite as the major phases in addition to smectite and minor mixed-layer illite-smectite. These clays often contain abundant CaO, Fe2O3 and K2O, which are advantageous for the densification of ceramic products at low temperatures, helping to improve the ceramic properties. Thus, studying the ability of these clay materials to yield ceramic products with low porosity and high mechanical performance for stoneware production is fundamentally important to the development of the ceramics industry in Tunisia and to the raw materials supply.
Sampling was performed with a manual shovel at 0.5 m depth to avoid weathered material at the surface. This was performed according to the availability, extension and homogeneity of the clayey series in the Tazoghrane, Tamozrat and El Mida areas, and the collected samples are depicted in Fig. 1. A total of ~5 kg was collected for each sample, which is considered representative of the respective clay series. The samples were then homogenized to produce three representative clay samples denoted as M1, M2 and M3. A total of ~1 kg of the samples was ground and sieved over a 1 mm sieve and kept in Kraft bags prior to use. A total of ~100 g of each sample was taken for further analyses.
Characterization techniques
To evaluate the clay characteristics and to predict the transformations, crystalline-phase development after thermal treatment and firing properties, physical–chemical, mineralogical and thermal analyses of the clay samples combined with physical–mechanical tests of the fired products were conducted using various techniques. Mineralogical analysis was done by means of XRD on all bulk and oriented clay samples at room temperature using a PANalytical X'Pert Pro with Cu-Kα radiation. Oriented samples were prepared from the <2 μm clay fraction in three preparations, namely air drying, ethylene glycol saturation and heating to 550°C for 4 h, to distinguish the clay mineral phases. Mineral-phase semi-quantitative analysis was carried out using the X'Pert HighScore Plus software. Fourier-transform infrared (FTIR) spectra were recorded for the M1, M2 and M3 samples in the 400–4000 cm−1 region with an EQUINOX Model 55 FTIR spectrometer using the KBr pellet technique. A total of ~2 mg of the samples was mixed with 200 mg of KBr to prepare the pellets.
The Na, K, Ca, Mg, Fe and Si contents of all samples were determined by inductively coupled plasma atomic emission spectroscopy (ICP-AES) and the Al contents were determined by inductively coupled plasma mass spectrometry (ICP-MS). The loss on ignition was acquired by calculating the difference in mass between samples heated to 100°C and then 1000°C. Differential thermal analysis (DTA) and thermogravimetric (TG) analysis were performed for the M1, M2 and M3 clay samples using a SETARAM SETSYS EVOLUTION-1750 coupled device at up to 1000°C under an inert atmosphere at a heating rate of 10°C min−1 using α-Al2O3 as a reference material. Dilatometric analysis was performed for the M1, M2 and M3 samples at up to 1200°C with a heating rate of 5°C min−1 using an air atmosphere.
Plasticity was determined using Atterberg limits tests of the liquid limit (LL), plastic limit (PL) and plasticity index (PI) for all of the samples. The PI was determined by calculating the difference between the LL and PL values. The particle-size distribution was analysed using a Malvern laser analyser. For technological ceramic tests, the M1, M2 and M3 clay samples were homogenized and moistened through sufficient hand mixing, sieved to pass through 1 mm until homogeneous agglomerates with 7% water contents were obtained (ISO 13006, 1998) and finally pressed (250 bar, 70 mm × 40 mm × 5 mm) using a laboratory press. Ceramic bodies were dried overnight at 110°C and then fired at 900°C, 1000°C and 1100°C for 3 h at a heating rate of 10°C min−1. Finally, the firing parameters were recorded. The linear shrinkage (LS) is based on the variation in length of the specimen before (Lo) and after (L) firing. The LS was calculated according to the ISO 10545-4 (2004) standard using the following formula:
 $$\lpar {\lpar {{\rm Lo\ }\ndash {\rm L}} \rpar /{\rm Lo}} \rpar \times 100.$$
The WA values, determined according to the AFNOR EN 99 (1982) standard, were calculated from weight differences between the fired and water-saturated samples (immersed in boiling water for 24 h) using the following formula:
 $$\lpar {\lpar {{\rm Mw\ }\ndash {\rm Ms}} \rpar /{\rm Ms}} \rpar \times 100\comma \;$$
where Mw and Ms are the masses of the water-saturated and the original sample, respectively. The FS was determined using a three-point flexural method according to the ISO 10545-4 (2004) standard.
Results and discussion
Characterization of the clay materials
Chemical analysis
The studied clay materials are rich in SiO2 (50.5–55.5%), Al2O3 (16.0–18.8%) and Fe2O3 (5.4–7.9%) (Table 1). Furthermore, the M1 sample is the most siliceous and the richest in Fe2O3, with average contents of 53.9% and 7.4%, respectively. M2 has the greatest Al2O3 content (17.8%) and the smallest Fe2O3 content (6.4%), while M3 has the smallest Al2O3 content with a significant Fe2O3 content (~6.8%). The SiO2/Al2O3 ratios range from 2.90 to 3.16, which are greater than the typical value of pure kaolinite (1.18) due to the presence of quartz and illite (Boussen et al., Reference Boussen, Sghaier, Chaabani, Jamoussi and Bennour2016). The presence of a large Fe2O3 content is due to the presence of structural iron from the substitution of Al3+ in the octahedral sheets of clay minerals, especially illite. According to Murray (Reference Murray2007), an Fe2O3 content >5% contributes to the reddish colour of fired ceramic bodies. The CaO (1.5–5.0%), MgO (<3.0%), K2O (1.8–3.0%), Na2O (≤0.7%) and SO3 (≤1.0%) contents are relatively small and may be related to the presence of minor quantities of feldspar, carbonates and gypsum. The presence of these oxides in the raw clays is advantageous because they can act as fluxes, reducing the sintering temperature. Based on previous studies (Mahmoudi et al., Reference Mahmoudi, Srasra and Zargouni2008; Baccour et al., Reference Baccour, Medhioub, Jamoussi and Mhiri2009), besides Al2O3 and SiO2, optimal amounts of Fe2O3, K2O, CaO and MgO are beneficial and act as fluxes, promoting densification at low temperatures. According to Konta (Reference Konta1980), the amounts of earth alkali oxides (CaO, MgO), alkali oxides (K2O, Na2O) and iron oxides (Fe2O3) influence the firing temperature, the degree of vitrification and the texture of fired ceramic tiles.
Table 1. Chemical composition (wt.%) of the clay samples.

X-ray diffraction
The mineralogical compositions of the studied clay materials are listed in Table 2. Figures 2 and 3 show the XRD traces of bulk samples and of the <2 μm clay fractions for the M1, M2 and M3 clay mixtures. The bulk mineralogical compositions revealed that the raw clay materials contain mainly kaolinite (24–37%) and illite (30–44%) and minor smectite (0–15%) or mixed-layer illite-smectite (0–5%). More specifically, the M1 sample is a kaolinite-rich clay consisting mainly of kaolinite (36%), illite (30%) and minor mixed-layer illite-smectite (5%). M2 is illite-rich, containing 40% illite and 30% kaolinite. Finally, M3 is composed of illite (34%), kaolinite (24%) and abundant smectite (15%). The main non-clay minerals are quartz (18–24%), calcite (1–5%) and feldspar (0–4%).
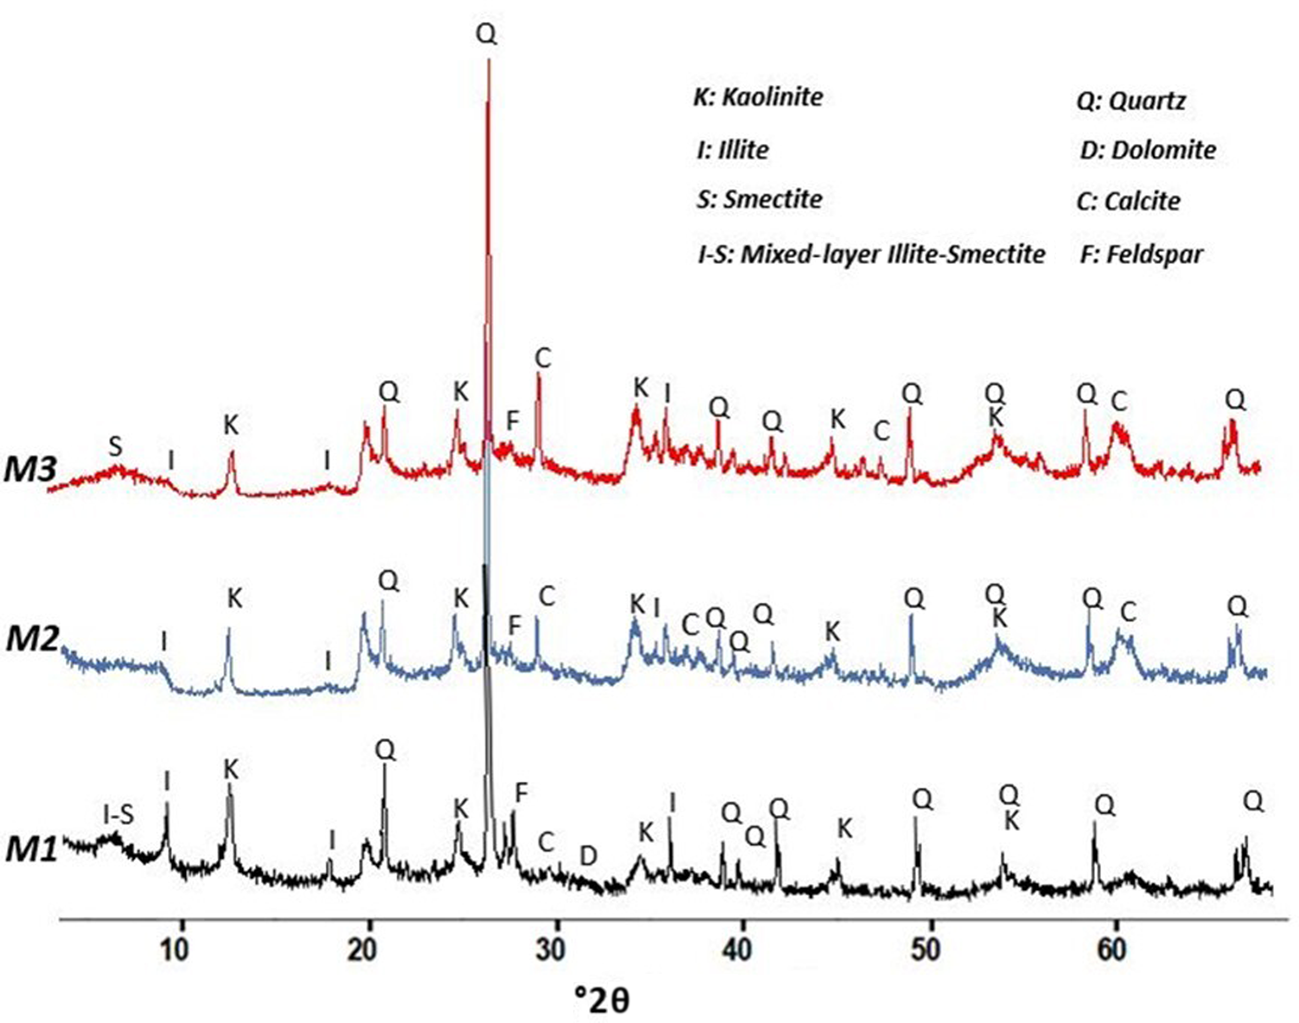
Fig. 2. XRD traces of the studied clays (bulk samples).

Fig. 3. XRD traces of the studied clays (clay fraction <2 μm).
Table 2. Mineralogical composition (wt.%) estimated from XRD.

Infrared spectroscopy
The FTIR spectra confirm the XRD results and indicate that clay minerals such as kaolinite and illite are present in almost all of the samples (Fig. 4). The bands at ~3692, 3676 and 3656 cm−1 correspond to OH-stretching bands characteristic of kaolinite (Russel & Fraser, Reference Russel, Fraser and Wilson1994), derived from the inner surface OH-groups of the octahedral sheets that form hydrogen bonds with the oxygen in the next tetrahedral sheet, while the band at 3620 cm−1 corresponds to inner hydroxyls (Schroeder, Reference Schroeder, Rule and Guggenheim2002; Ramasamy et al., Reference Ramasamy, Rajkumar and Ponnusamy2009). The stretching and bending vibrations of physisorbed water molecules are observed at 3436 and 1636 cm−1, respectively (Petit et al., Reference Petit, Madejová, Decarreau and Martin1999). The Si–O stretching bands in the 1110–1000 cm−1 range and the Al–O bending band at 913 cm−1 are characteristic of kaolinite and illite. More specifically, the band at 1036 cm−1 is assigned to Si–O in-plane stretching and the band at ~1110 cm−1 to the out-of-plane Si–O stretching vibration. The bands observed at 470 and 536 cm−1 are attributed to Si–O–Si and Si–O–Al deformation vibrations, characteristic of aluminosilicate minerals. The presence of quartz in the studied clayey materials was confirmed by the Si–O stretching and bending vibrations at ~464, 694, 778 and 798 cm−1. The band at 1436 cm−1 is due to C–O stretching in calcite.

Fig. 4. Infrared spectra of the studied clays: wavenumbers ranging between 400 and 4000 cm−1.
Particle-size distribution and Atterberg limits
The particle-size distribution (Table 3) shows that most samples (62–79%) correspond to the silt fraction. The proportion of the clay fraction is moderately high, varying between 16% and 38%. When plotted in a ternary diagram, the M1 and M2 clayey materials are mostly within the clayey silt zone, whereas the M3 sample has a silty texture (Fig. 5). These results are similar to those for some local clays, which are suitable raw materials for the ceramics industry (Mahmoudi et al., Reference Mahmoudi, Srasra and Zargouni2008). The PI and LL range between 18–25% and 42–50%, respectively (Table 3), in agreement with the ranges defined in the literature for ceramic production (Boussen et al., Reference Boussen, Sghaier, Chaabani, Jamoussi and Bennour2016). M1 has the lowest PI and LL values at 18% and 42%, respectively. The M2 sample has slightly lower PI and LL values than the M3 sample. This may be explained by the presence of free quartz and illite in the two samples. M3, which contains ~15% smectite, has the largest PI value, 25%, and a LL of 50%. According to their PI and LL values, the clays plot within the moderate plastic zone in the diagram of plasticity and are considered appropriate for the production of structural ceramics, similar to the Sejnène clays (Bennour et al., Reference Bennour, Mahmoudi, Srasra, Boussen and Htira2015). There are various factors affecting the plasticity of clays such as origin of geological formation, particle-size distribution, clay mineral phases, impurities (non-clay fractions) and organic matter (Bergaya et al., Reference Bergaya, Theng and Lagaly2006; Hajjaji et al., Reference Hajjaji, Hachani, Moussi, Jeridi, Medhioub and López-Galindo2009). A small amount of quartz and the presence of swelling clays such as smectite yielded greater plasticity. Smectite may improve plasticity, but its presence in large amounts would provide undesirable shrinkage and drying properties (Bergaya et al., Reference Bergaya, Theng and Lagaly2006).
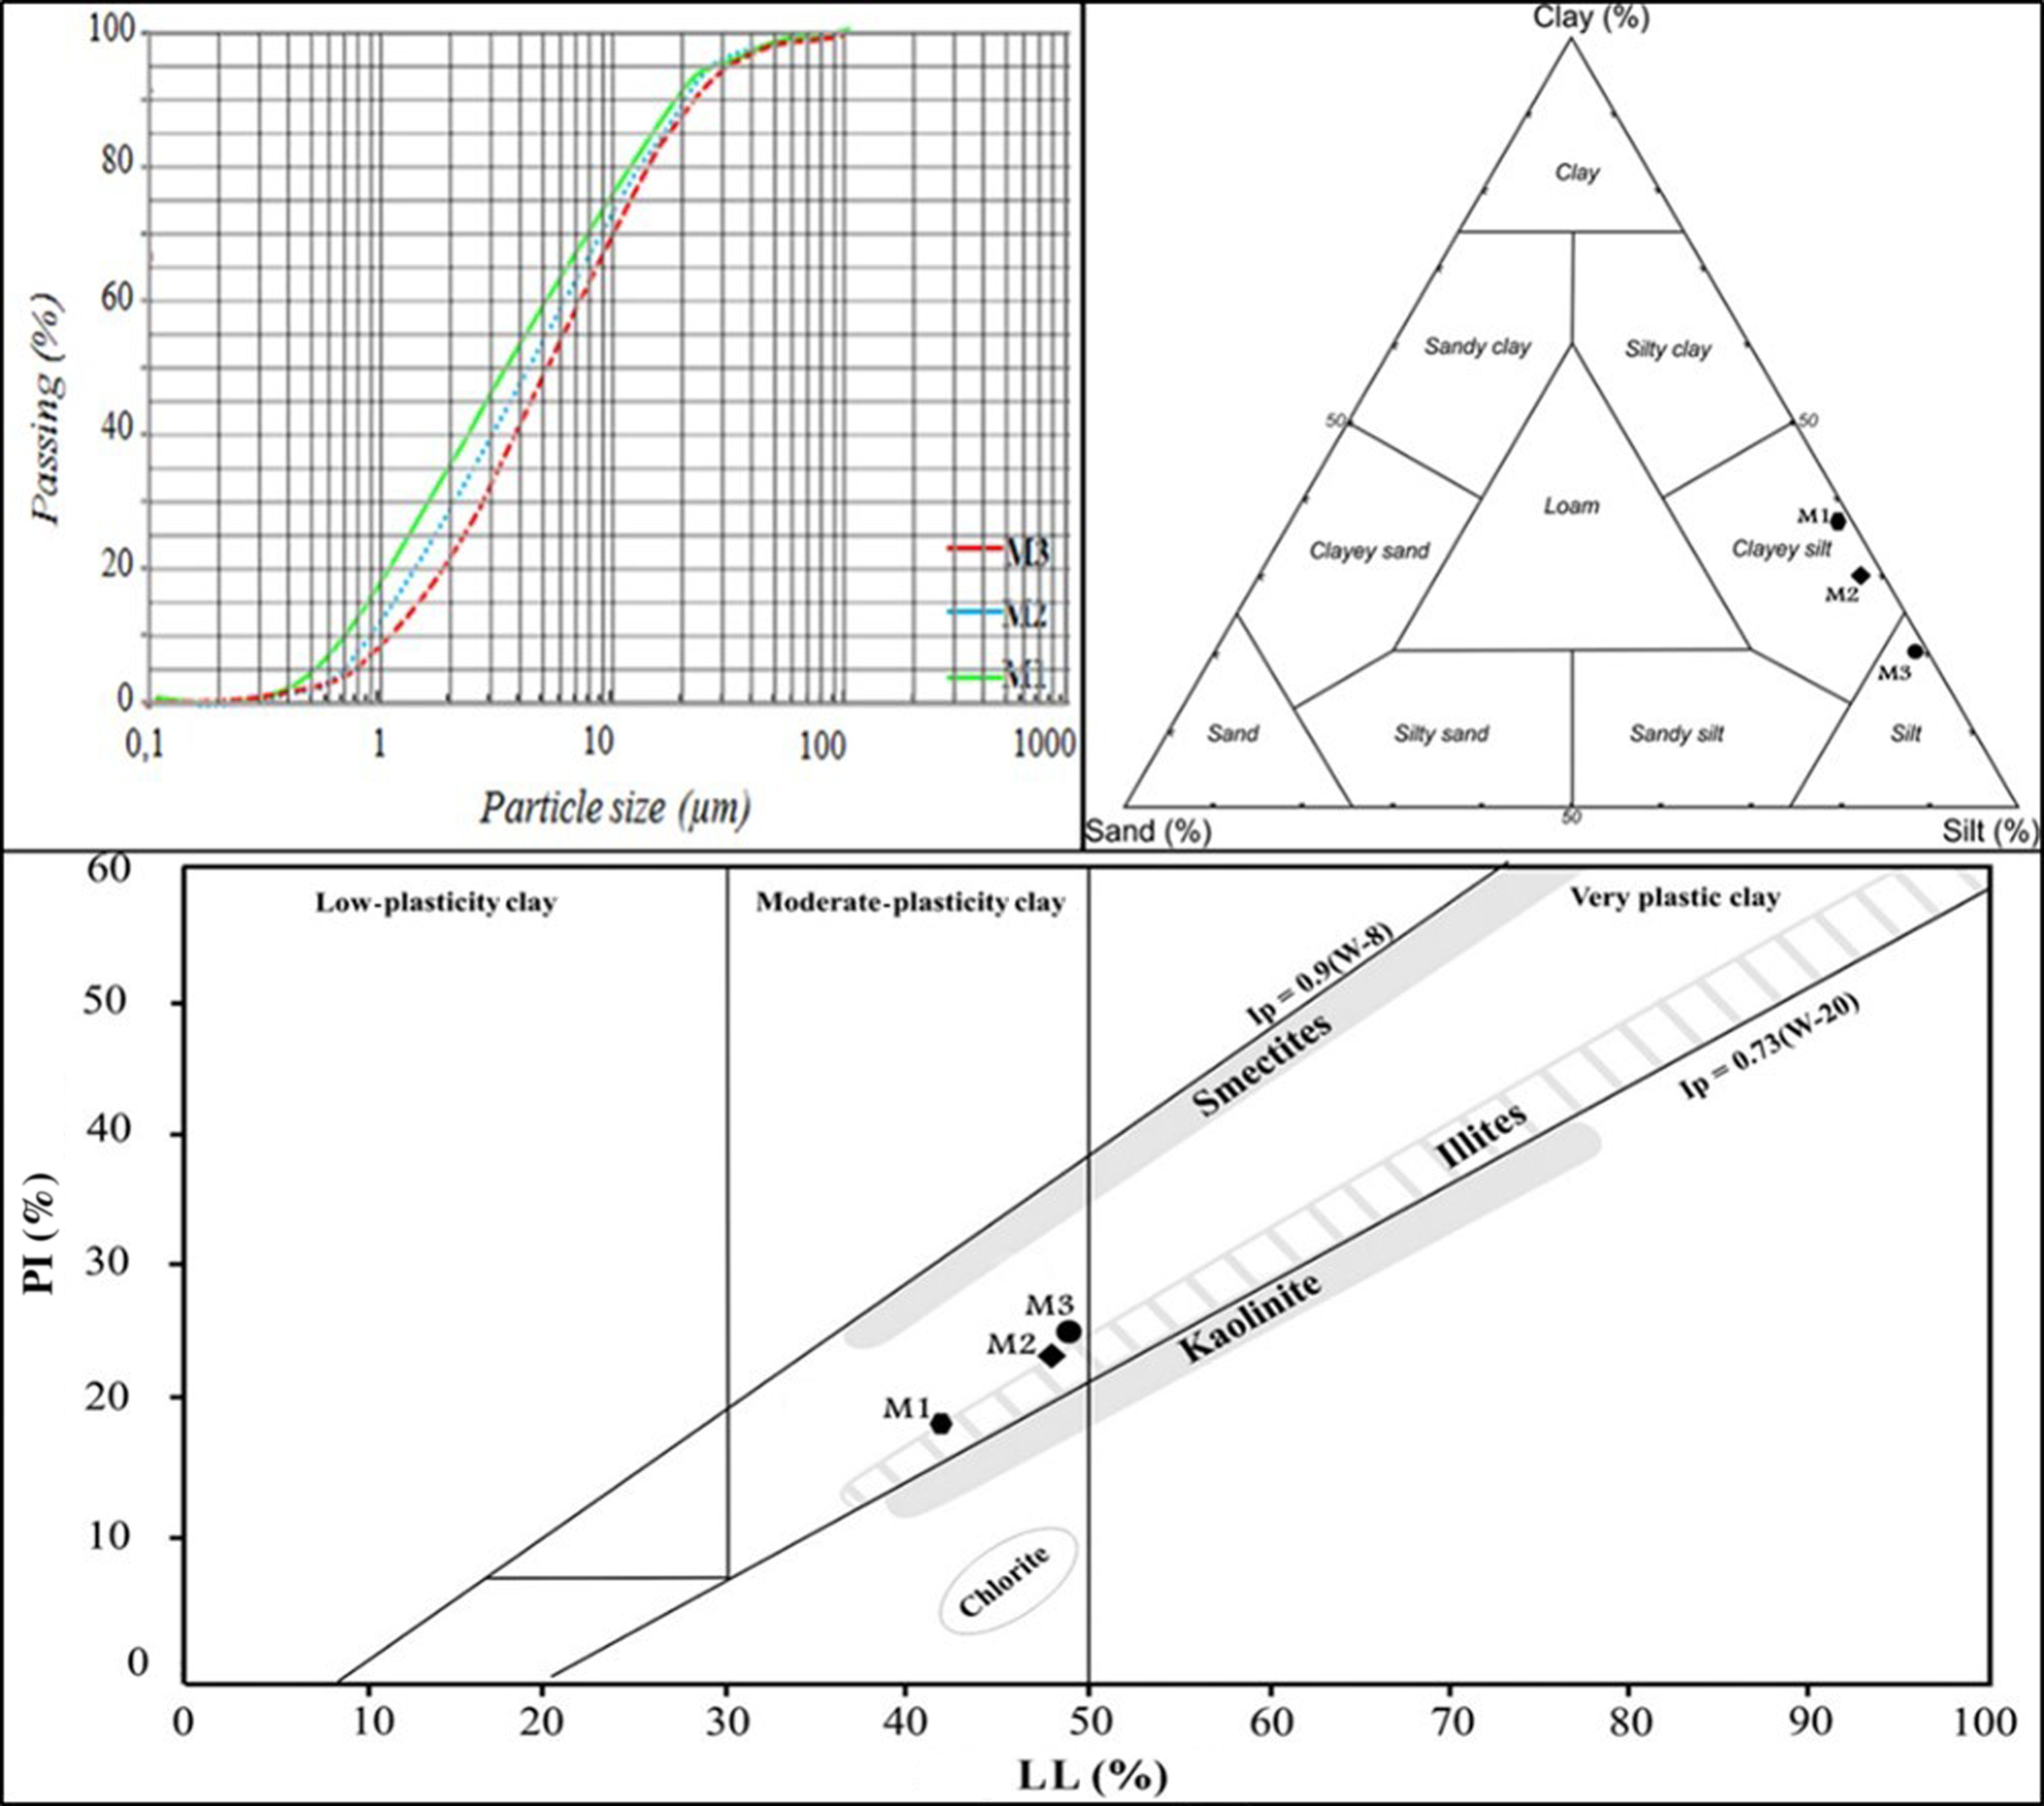
Fig. 5. Particle-size distributions of clay (<2 μm), silt (2–63 μm) and sand (>63 μm) and plasticity of the studied clays.
Table 3. Physical characteristics of the clay samples.

Table 4. Physical and mechanical properties of the M1, M2 and M3 sintered ceramics.

Suitability for ceramics applications
Kaolinite is the most widely used clay mineral in ceramics because of its high melting point and its whitish colour after firing (El Ouahabi et al., Reference El Ouahabi, Daoudi, Hatert and Fagel2015). The presence of illite and smectite might impart good workability and extrusion. Illite is used widely as a fluxing material in traditional ceramics (Baccour et al., Reference Baccour, Medhioub, Jamoussi, Mhiri and Daoud2008), favouring the formation of a liquid phase at a lower temperatures, and thus it contributes to the formation of denser structures (Ngun, Reference Ngun2011). Smectite is generally considered to be a problematic mineral for shaping and drying (Blanco Garcia et al., Reference Blanco Garcia, Rodas, Sanchez, Dondi and Alonso-Azcarate2005). Small amounts of smectite may be tolerated as they might improve plasticity. In contrast, large amounts would provide undesirable shrinkage and drying properties. Quartz facilitates the drying step by diminishing the drying shrinkage and contributing to the glassy-phase formation during the sintering step, wherein mullite would be crystallized (Lahcen et al., Reference Lahcen, Elboudour, Saadi, Albizane, Bennazha and Waqif2014). The glass formed reduces the porosity of the sintered samples.
The ternary diagram that uses the abundances of clay minerals, quartz, feldspars and carbonates (Fig. 6a) links mineralogical composition with ceramic applications (Strazzera et al., Reference Strazzera, Dondi and Marsigli1997). The raw clays plot slightly outside of the domain for structural clay products, which indicates that all of the samples are extremely rich in clay minerals. It is possible, of course, to reduce the relative amount of clay minerals present in the raw clays by adding coarse materials such as quartz and feldspar to improve processing and to improve the properties of the final product at the same time. In the ternary diagram of Fabbri & Fiori (Reference Fabbri and Fiori1985), all of the samples may be used as raw materials for stoneware, as they are projected in the field of red bodies (Fig. 6b). Clays containing >5% Fe2O3 yield red firing bodies, and those with <1% Fe2O3 provide white firing bodies (Lahcen et al., Reference Lahcen, Elboudour, Saadi, Albizane, Bennazha and Waqif2014). Particle-size data reported in the diagram of Winkler (Reference Winkler1954) show that the clays examined are suitable for roofing tiles and masonry brick production (Fig. 7a). The results of this study are similar to those for two other Tunisian clays that are suitable as raw materials for ceramic tile production (Bennour et al., Reference Bennour, Mahmoudi, Srasra, Boussen and Htira2015; Boussen et al., Reference Boussen, Sghaier, Chaabani, Jamoussi and Bennour2016). From the diagram of Bain & Highley (Reference Bain, Highly, Mortland and Farmer1978), used to evaluate the extrusion behaviour of clayey materials, the studied clays are quite suitable for bricks or pottery. Sample M1 showed optimal moulding behaviour, and samples M2 and M3 showed acceptable moulding properties (Fig. 7b). From the results of the present study, all of the samples show satisfactory chemical, mineralogical and physical characteristics similar to other clays that are currently used in Tunisia as raw materials for ceramic production.
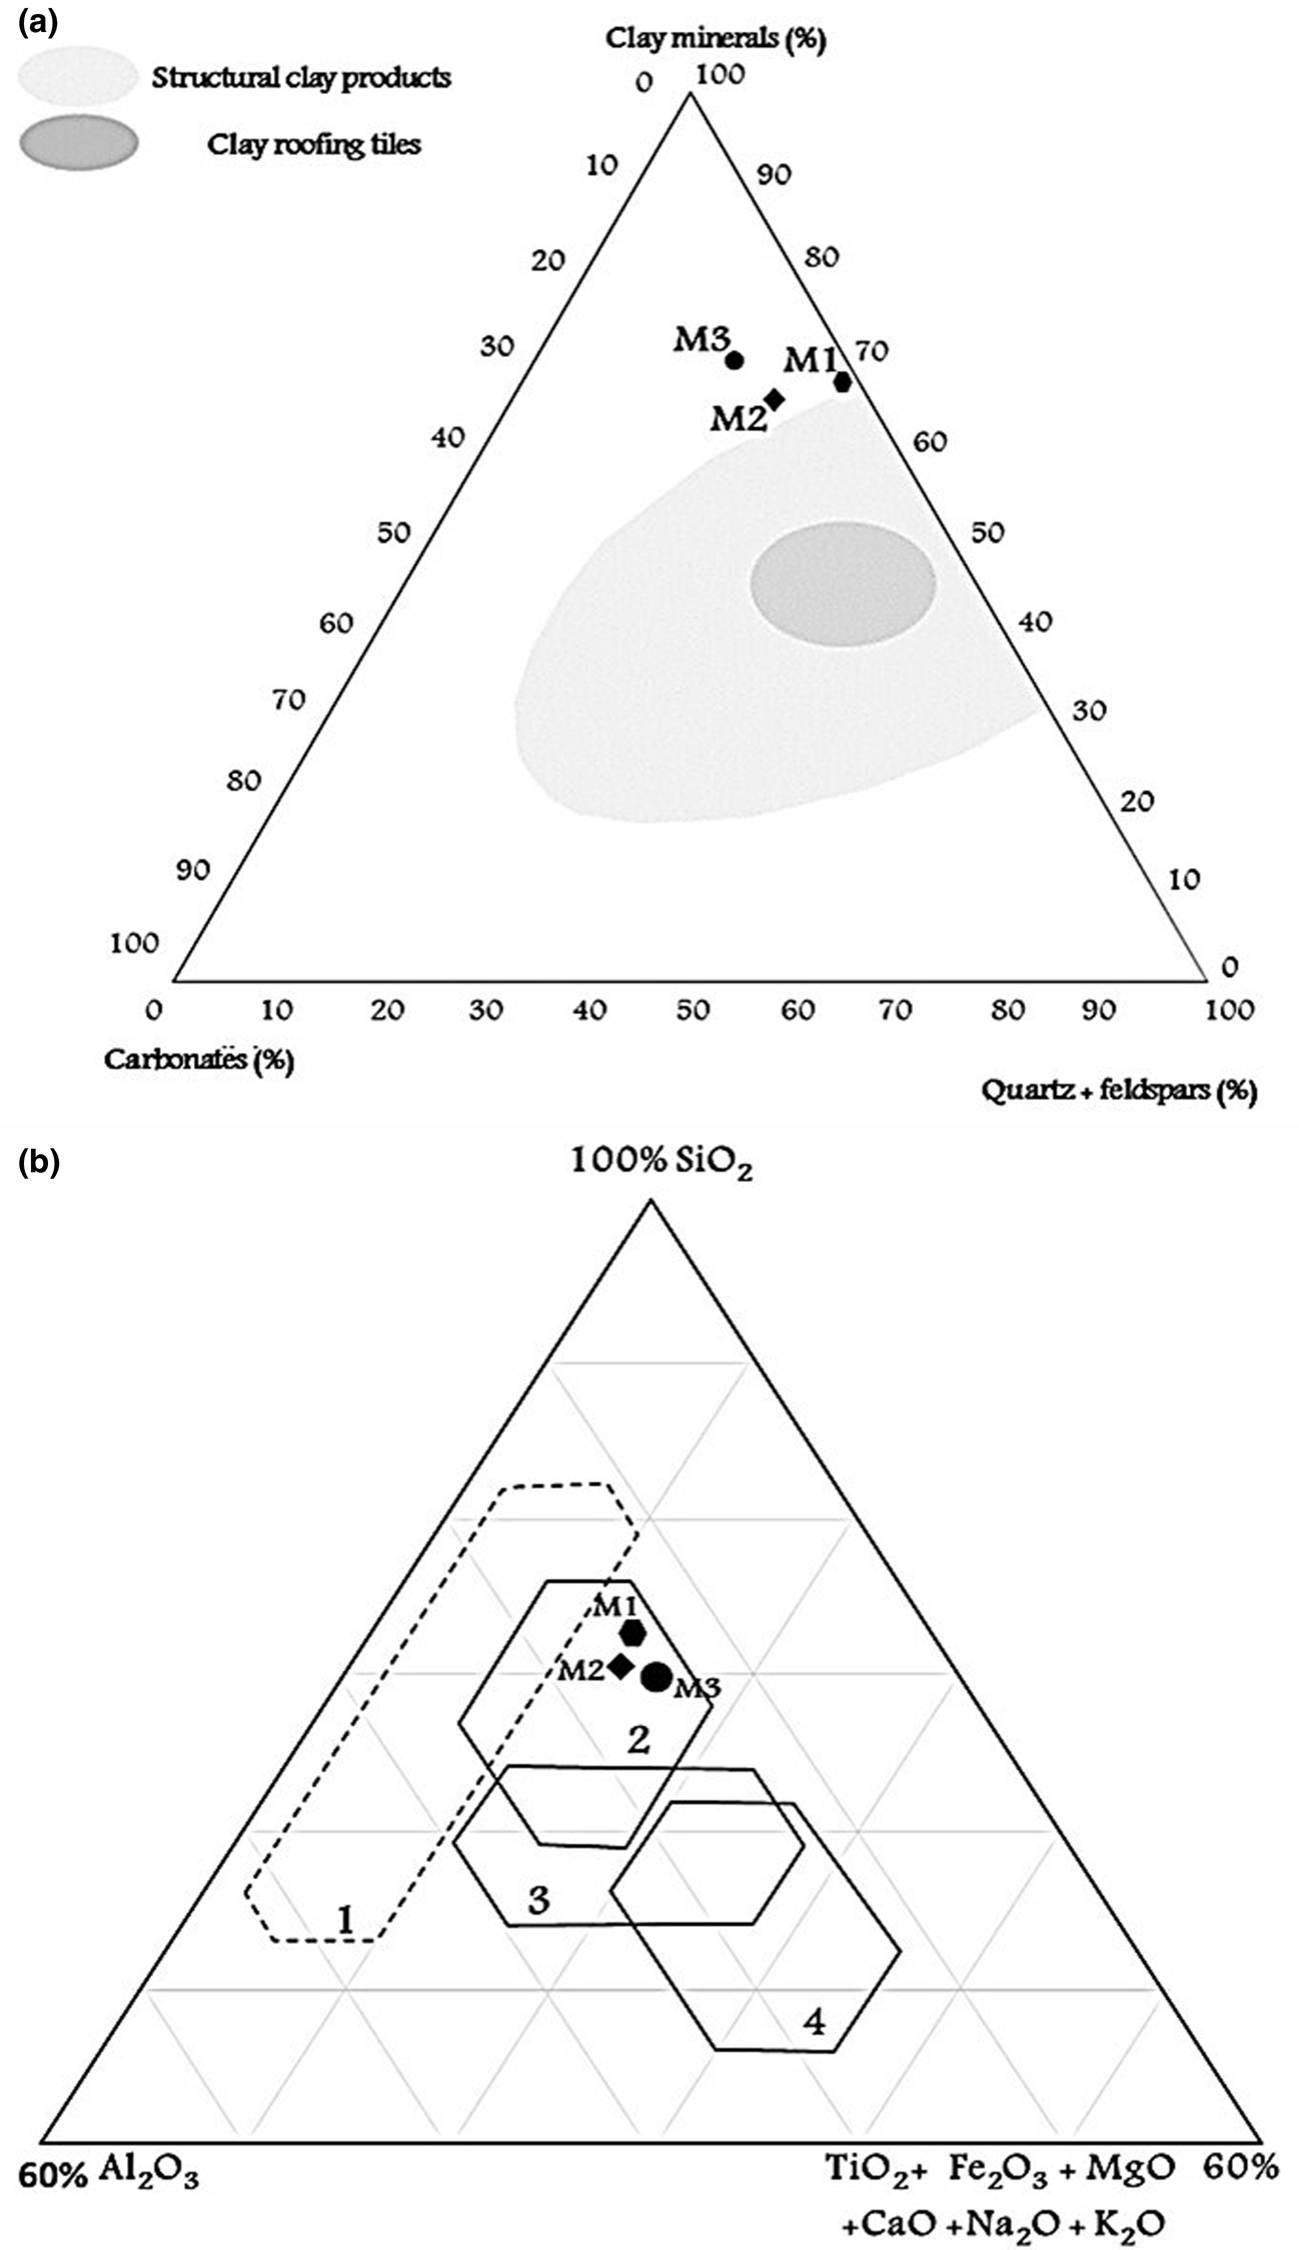
Fig. 6. Classification of the studied clays based on (a) the mineralogical composition according to Strazzera et al. (Reference Strazzera, Dondi and Marsigli1997) and (b) chemical composition domains for preparing stoneware tiles (1 = white bodies; 2 = red bodies) and porous tiles (3 = cottoforte; 4 = majolica) according to Fiori et al. (Reference Fiori, Fabbri, Donati and Venturi1989).

Fig. 7. (a) Ternary diagram classification of the studied clays according to Winkler (Reference Winkler1954) (I = common bricks; II = vertically perforated bricks; III = roofing tiles and masonry bricks; IV = hollow products) and (b) clay workability chart of Bain & Highly (Reference Bain, Highly, Mortland and Farmer1978).
Thermal behaviour of the studied clays
DTA/TG analysis
The DTA/TG curves show four consecutive endothermic peaks and one exothermic peak for all of the clayey materials (Fig. 8). The first endothermic peak at ~100°C, due to the loss of adsorbed water by the clay minerals, is followed by a second endothermic peak without significant mass loss in the 150–350°C temperature range, which corresponds to the dehydration of illite and smectite through the release of interlayer water molecules (Drits & McCarty, Reference Drits and McCarty2007). The weight loss was ~3.5% for M1, 5.8% for M2 and 6.5% for M3. A third endothermic peak is observed in the 450–600°C temperature range with a maximum at ~550°C. This is attributed to the release of the OH groups during the dehydroxylation of clay minerals, mainly kaolinite and its transformation into metakaolinite (Grim, Reference Grim1947; Mackenzie, Reference Mackenzie1957; Gualtieri et al., Reference Gualtieri, Bellotto, Artioli and Clark1995; Carty & Senapati, Reference Carty and Senapati1998). The associated weight loss ranges from 5% to 6%, which is due to the kaolinite present. A fourth endothermic peak with a weight loss of <2%, observed at >750°C in all of the DTA curves, was probably related to the complete dehydroxylation of illite and smectite (Earnest, Reference Earnest1991) and/or in accordance with the carbonate decomposition, mainly of calcite and dolomite (Lahcen et al., Reference Lahcen, Elboudour, Saadi, Albizane, Bennazha and Waqif2014; Bennour et al., Reference Bennour, Mahmoudi, Srasra, Boussen and Htira2015). At higher temperatures (920–950°C), a small exothermic peak without mass loss of was observed. This is attributed to the spinel-type aluminosilicate-phase and mullite formation (El Ouahabi et al., Reference El Ouahabi, Daoudi, Hatert and Fagel2015).

Fig. 8. Thermal analysis (DTA/TG curves) of the studied clays.
Dilatometric analysis
The dilatometric analysis highlights the volume variations (expansion–shrinkage) as a function of temperature. Variations in linear expansion (up to 550°C) and shrinkage (>550°C) between these three clays were related to the quartz and kaolinite contents. The pattern that M1 exhibits is typical of kaolinite-rich clays, whereas the dilatometric curves of M2 and M3 exhibit patterns similar to those of illite-rich clays (Fig. 9). All of the dilatometric curves have three consecutive events up to 1000°C. The first important event due to rapid expansion between 550°C and 573°C corresponds to the dehydroxylation of clay minerals, especially kaolinite, and to the transformation of α- to β-quartz polymorphs at 573°C. The second important change observed at ~850°C with sharp shrinkage is attributed to the beginning of sintering reactions. At this temperature, the thermal expansion and contraction are more sensitive to kaolinite–illite interactions (Lecomte et al., Reference Lecomte, Bonnet and Blanchart2011; Escalera et al., Reference Escalera, Tegman, Antti and Odén2014). The presence of illite slightly inhibited kaolinite contraction in the 550–900°C temperature range, whereas quartz inhibited kaolinite contractions in the 550–650°C temperature range. The third event with significant shrinkage is observed in the 900–1000°C temperature range due to recrystallization (Baccour et al., Reference Baccour, Medhioub, Jamoussi and Mhiri2009). At temperatures >1000°C, the inflexion point is related to recrystallization, and >1050°C, the rapid densification is due to liquid-phase formation during sintering (Escalera et al., Reference Escalera, Tegman, Antti and Odén2014).

Fig. 9. Dilatometry analysis of the studied clays. dl/lO = shrinkage rate (derivative of dilatation).
Firing properties
Mineralogical transformations and crystalline-phase development
Figure 10 shows the XRD traces of the samples fired at 900°C, 1000°C and 1100°C. The mineralogical transformations during firing were assessed from the intensity of the diffraction peaks for each crystalline phase, which are accompanied by the formation of an amorphous phase, identified from the background of the XRD traces. The first transformation corresponds to the disappearance of kaolinite and its transformation to metakaolinite, which reorganizes at higher temperatures to form a spinel aluminosilicate phase (Drits, Reference Drits, Besson and Muller1995; Jordan et al., Reference Jordan, Boix, Sanfeliu and De la Fuente1999; Kamsen & Leonelli, Reference Kamsen and Leonelli2007). Indeed, the spinel phase resulted from thermal transformation of metakaolinite at >900°C as an unstable intermediate phase not detected by XRD. Illite still appears in all of the samples and it transforms into its anhydrous form at temperatures up to 900°C via the release of OH groups, and it undergoes total dehydroxylation at 950°C (Bennour et al., Reference Bennour, Mahmoudi, Srasra, Boussen and Htira2015). At the former temperature, carbonates (mainly calcite and dolomite) undergo thermal decomposition to form calcium and magnesium oxide with the release of carbon dioxide, which is consistent with the DTA results (Fig. 8). The second transformation corresponds to hematite formation at ~900°C. The appearance of hematite indicates a slight destruction of the illite structure. Hematite begins to crystallize at 800°C and continues to develop up to 1200°C (Jordan et al., Reference Jordan, Sanfeliu and De la Fuente2001; Manoharan et al., Reference Manoharan, Sutharsan, Dhanapandian, Venkatachalapathy and Mohamed Asanulla2011). Finally, mullite begins to crystallize at 1000°C and develops up to 1100°C. Bennour et al. (Reference Bennour, Mahmoudi, Srasra, Boussen and Htira2015) suggested mullite formation at 1200°C in a ceramic body from kaolinite-rich clay. The formation of mullite at a lower temperature in this study might be explained by the greater flux content of the studied clays, which favours recrystallization at low temperatures. Quartz is present at all firing temperatures, although the intensity of the peaks decreases at >1100°C, indicating partial dissolution concomitant with the formation of the liquid phase. Thereafter, transformation of the remaining quartz into cristobalite begins at this temperature.

Fig. 10. Powder XRD traces of M1, M2 and M3 fired at 900°C, 1000°C and 1100°C.
Furthermore, gehlenite and anorthite begin to form at 1000°C in all of the samples that are originally rich in calcite. Therefore, after the decomposition of calcite, the released CaO reacts with metakaolinite to produce gehlenite and anorthite (Jouenne Reference Jouenne1984; Trindade et al., Reference Trindade, Dias, Coroado and Rocha2009; El Ouahabi et al., Reference El Ouahabi, Daoudi, Hatert and Fagel2015). At 1100°C, anorthite continues to develop, but gehlenite disappears due to reaction with metakaolinite to form anorthite. Gehlenite is metastable and may transform into anorthite with adequate Si through firing at up to 1200°C (Trindade et al., Reference Trindade, Dias, Coroado and Rocha2009).
The FTIR spectra are presented in Fig. 11. Firing at up to 1100°C causes total collapse of the kaolinite and illite structures, decomposition of carbonates and the advance of sintering reactions. Therefore, the sharp OH bands in the typical OH-stretching band range (3000–4000 cm−1) disappeared completely at 600°C, indicating the collapse of the clay mineral structure. The bands at 1110 and 1033 cm−1 (Si–O stretching) and those at 913, 756 and 537 cm−1 disappear, indicating the destruction of the Si–O–Al network of clay minerals, mainly kaolinite. The bands at 1430 cm−1 related to C–O stretching also disappear, suggesting the decomposition of carbonates.

Fig. 11. Infrared spectra of the unfired and fired M1 sample: wavenumbers ranging between 400 and 4000 cm−1.
Physical and mechanical properties
The LS, weight loss (LOI), WA and FS values are listed in Table 4. The variations of these parameters with temperature are shown in Fig. 12. Significant variations are observed in the 900–1100°C temperature range with a significant concomitant increase in LS and FS and a notable decrease in WA. This behaviour may be explained by the densification of fired bodies. Therefore, densification is a fundamental parameter affecting the mechanical strength of the ceramic products (Baccour et al., Reference Baccour, Medhioub, Jamoussi and Mhiri2009; Mahmoudi et al., Reference Mahmoudi, Srasra and Zargouni2010). The LS is ~3% at 900°C and it increases to 8.3% at 1100°C. The WA is >10% at 900°C, indicating high porosity, and significantly decreases to <3% at ~1100°C. The gradual decrease in WA values in the 900–1100°C temperature range is due to the open porosity reduction because of the sintering reactions taking place at >900°C, promoting vitrification (Baccour et al., Reference Baccour, Medhioub, Jamoussi, Mhiri and Daoud2008; Medhioub et al., Reference Medhioub, Hajjaji, Hachani, Lopez-Galindo, Rocha, Labrincha and Jamoussi2012; Mahmoudi et al., Reference Mahmoudi, Srasra and Zargouni2014; Bomeni et al., Reference Bomeni, Njoya, Ngapgue, Wouatong, Yongue Fouateu, Kamgang Kabeyene and Fagel2018). During formation of the liquid phase, the liquid surface tension and capillarity bring particles closer together and reduce porosity (Ngun, Reference Ngun2011). An increase in FS was noticed in all of the samples with increasing firing temperature. At 1100°C, the highest FS was registered for M3 (41.7 MPa), while the lowest was recorded for M2 (30.4 MPa). At high temperatures, up to 1100°C, the products obtained showed high FS without deformation or defects due to the presence of Si-rich, Al-rich and Ca-rich components in the raw clays that formed new crystalline phases such as anorthite, mullite and cristobalite, which reinforced the mechanical resistance of the ceramic materials. This is confirmed by the XRD traces, which indicate an increase in the intensity of the reflections at 1100°C corresponding to newly formed phases. Previous work showed that mullite and cristobalite substantially strengthened the mechanical resistance of the fired products (Felhi et al., Reference Felhi, Tlili, Gaied and Montacer2008; Jeridi et al., Reference Jeridi, Hachani, Hajjaji, Moussi, Medhioub and Lòpez-Galindo2008; Mahmoudi et al., Reference Mahmoudi, Srasra and Zargouni2008, Reference Mahmoudi, Srasra and Zargouni2010; Hajjaji et al., Reference Hajjaji, Hachani, Moussi, Jeridi, Medhioub and López-Galindo2009; Bennour et al., Reference Bennour, Mahmoudi, Srasra, Boussen and Htira2015; Ben M'barek-Jemaï et al., Reference Ben M'barek-Jemaï, Karoui-Yaakoub, Sdiri, Ben Salah, Azouzi and Duplay2015).

Fig. 12. Comparison between LS, WA and FS for the M1, M2 and M3 sintered ceramics from 900°C to 1100°C.
The anorthite phase formed from kaolinite-rich clays with the addition of calcite increases the mechanical strength (Traoré et al., Reference Traoré, Ouédraogo, Blanchart, Jernot and Gomina2007). It is suggested that some changes during firing are influenced by the mineralogical and chemical composition (Fe2O3, K2O, CaO, MgO, etc.). These oxides control densification and might accelerate sintering reactions to form new crystalline phases accompanied by the formation of a vitreous phase at low temperatures, which fills the open porosity (Baccour et al., Reference Baccour, Medhioub, Jamoussi and Mhiri2009; Diko et al., Reference Diko, Ekosse, Ayonghe and Ntasin2011).
The ceramic tile specifications were achieved by heating up to 1100°C for all of the clay mixtures, which display good properties and may be suitable for the manufacture of some ceramic products, such as stoneware. According to Dondi et al. (Reference Dondi, Raimondo and Zanelli2014), the studied clays can be classified between classes Ib and IIa (WA <3%) (Fig. 13), corresponding to vitrified ceramic bodies distinguished by their red colour, which is explained by the Fe2O3 content (>5% Fe2O3) of the raw clays, which is dissolved in the glassy phase formed at higher temperatures (Moussi et al., Reference Moussi, Medhioub, Hatira, Yans, Hajjaj and Rocha2011; Lahcen et al., Reference Lahcen, Elboudour, Saadi, Albizane, Bennazha and Waqif2014).

Fig. 13. Typologies of ceramic tiles obtained with clay materials from the Cap Bon region according to body colour (mostly depending on the Fe2O3 content) and compactness (expressed by WA) and their classification in agreement with the ISO 13006 (1998) standard (for acronym definitions, see Dondi et al., Reference Dondi, Raimondo and Zanelli2014).
Effects of clay contents on ceramic properties
The fired samples M1, M2 and M3 with various clay mineral contents developed different LS, FS and WA values at the maximum firing temperature of 1100°C. These results are in agreement with recent work that reported that variations in the mineralogical compositions of starting materials mainly affected physical and mechanical properties (Semiz Reference Semiz2017; Bennour et al., Reference Bennour, Mahmoudi and Srasra2018; Temga et al., Reference Temga, Mache, Balo Madi, Basga, Nguetnkam and Bitom2019). First, the FS, which is >8%, is high for all of the fired clays. This high value is probably due to the argillaceous nature (high clay- and silt-fraction content) of these materials and the presence of swelling clays (mainly smectite), which are characterized by significant shrinkage at high temperatures. According to Abdelmalek et al. (Reference Abdelmalek, Bouazi, Bouftouha, Bouabsa and Fagel2017), the greatest linear firing shrinkage may be explained by the smectite content and the high PI value. When smectite is exposed to high temperatures, the layers are dehydrated and this affects the properties of ceramics, leading to undesirable shrinkage (Temga et al., Reference Temga, Mache, Balo Madi, Basga, Nguetnkam and Bitom2019). Ultimately, a decrease in the WA and an increase in the FS was noted for all of the samples. These are more pronounced in the M3 sample, which is characterized by the greatest illite and smectite contents. This effect is due to the greater formation of the liquid phase at ~1100°C. High illite and smectite contents favour the formation of the liquid phase, suggesting that vitrification of these clays occurs at low temperatures. The liquid phase reduces porosity and improves mechanical strength (Ngun, Reference Ngun2011; Lahcen et al., Reference Lahcen, Elboudour, Saadi, Albizane, Bennazha and Waqif2014). The lowest FS values in M2 were probably due to the poor cohesion of this sample, which is related to its lower kaolinite content compared to the other samples.
Correspondingly, Fe2O3 and CaO contents influence densification and mechanical properties. Furthermore, an increase in CaO content promotes the progressive formation of anorthite, which increases the mechanical strength of the materials and contributes to the formation of the vitreous phase that fills the open porosity (Diko et al., Reference Diko, Ekosse, Ayonghe and Ntasin2011). Clay samples from waste brick additives at 70/30 mass ratio with an optimal CaO content of ~8% had the greatest tensile strength at 1100°C (Bennour et al., Reference Bennour, Mahmoudi, Srasra, Boussen and Htira2015; Zouaoui & Bouaziz, Reference Zouaoui and Bouaziz2017). Therefore, the CaO released after the decomposition of calcite reacted with the SiO2 and Al2O3 present in clays to favour the formation of anorthite at high temperatures, which improved the mechanical strength. Moreover, CaO from CaCO3 decomposition promotes the formation of the liquid phase at lower temperatures during sintering, which fills the pores, resulting in significant densification of the ceramic materials. On the other hand, the presence of iron in the illite structure favours the formation of the liquid phase at low temperatures, which then facilitates the densification process. This result is in accordance with Jiang et al. (Reference Jiang, Lia, Zhaoa and Canga2017), who suggested that a high Fe2O3 content of up 5% will cause densification at low temperatures. An Fe2O3 content of up to 9% may produce ceramics with desirable properties (Boussen et al., Reference Boussen, Sghaier, Chaabani, Jamoussi and Bennour2016).
Conclusion
The clay materials from Tunisia examined in this study contain major kaolinite and illite and minor quartz and calcite and have high concentrations of iron oxides. These clays are characterized by a large fine-grained fraction, and they are moderately plastic and thus are good for ceramic applications. After firing, significant changes were detected due to dehydroxylation of the clay minerals, decomposition of the carbonates and crystallization of the mineral phases. The main mineralogical transformations were observed after firing up to 1000°C. Hematite, gehlenite and anorthite are the major phases formed, while mullite and cristobalite formed at 1100°C. At this temperature, significant densification of the fired samples occurred. The fired bodies displayed improvements in their physical and mechanical properties, marked by a decrease in WA of up to 3% and an increase in the FS of >30 MPa. The good firing properties of the tested clay mixtures suggest that the raw clays are suitable for structural ceramic products and may represent an important resource for producing stoneware tiles.
Acknowledgements
The authors acknowledge the National Office of Mines (ONM) and the Laboratory of Composite Materials and Clay Minerals (CNRSM) from Tunisia for their logistical and technical support of this research study. We thank Mr Ezzedine Srasra, Director of the Laboratory of Composite Materials and Clay Minerals, for assistance and for comments that greatly improved the manuscript. The academic contribution of the faculty of sciences of Bizerte is acknowledged.


