Refractory (ceramic) materials are materials other than metals and alloys (but not excluding those with a metallic constituent) that are physically and chemically stable up to at least 1500°C (Jourdain, Reference Jourdain1966; Kolli et al., Reference Kolli, Hamidouche, Fantozzi and Chevalier2007; Porier, Reference Poirier2011). Based on the chemical and mineralogical composition of the initial raw materials, refractories are classified into three main groups, namely: acid refractories (Al refractories, Si refractories and Al–Si refractories), basic refractories (mainly magnesia, dolomite and chromite refractories) and special refractories (carbons, carbides, nitrides, spinel, zircon) (Aliprandi, Reference Aliprandi1979; Lapoujade & Le Mat, Reference Lapoujade and Le Mat1986; Staphen & Gordon, Reference Staphen and Gordon1992; Routschka, Reference Routschka2004; Amrane et al., Reference Amrane, Ouedraogo, Mamen, Djaknoun and Mesrati2011). The Al–Si refractories are numerous and have many applications (Routschka, Reference Routschka2004). They are used in metallurgy, ceramics and glass industries. Fireclay refractories are manufactured from natural clay materials. Their cost of fabrication is relatively small compared to other bricks manufactured from synthetic materials (Lapoujade & Le Mat, Reference Lapoujade and Le Mat1986). Fireclays might be used as building materials for furnaces, vessels and reactors for various applications such as fabrication of pottery, earthenware, cement for metallurgy, etc.
In addition, they are produced by mixing fine raw clay particles (bonding phase) with large particles (aggregates) referred to as chamotte particles. Chamotte is obtained by pre-firing raw clays, grinding, sieving and classifying grains to obtain particle-size distributions of 0.5 to several millimetres. Previous studies have characterized fireclay refractory bricks from some Cameroonian raw materials (Djangang et al., Reference Djangang, Elimbi, Melo, Lecomte, Nkoumbou, Soro, Bonnet, Blanchart and Njopwouo2007, Reference Djangang, Elimbi, Melo, Lecomte, Nkoumbou, Soro, Bonnet, Blanchart and Njopwouo2008, Reference Djangang, Lecomte, Elimbi, Blanchart and Njopwouo2010; Tchamba et al., Reference Tchamba, Melo, Yongue and Njopwouo2011). The present study focused on the characterization of clays of the Koutaba and Mayouom deposits and their assessment for the production of refractory bricks. Knowledge of the thermal behaviour of clays is necessary both for chamotte fabrication and for their use as a bonding phase in final materials, and it is a prerequisite for further developments.
MATERIALS AND METHODS
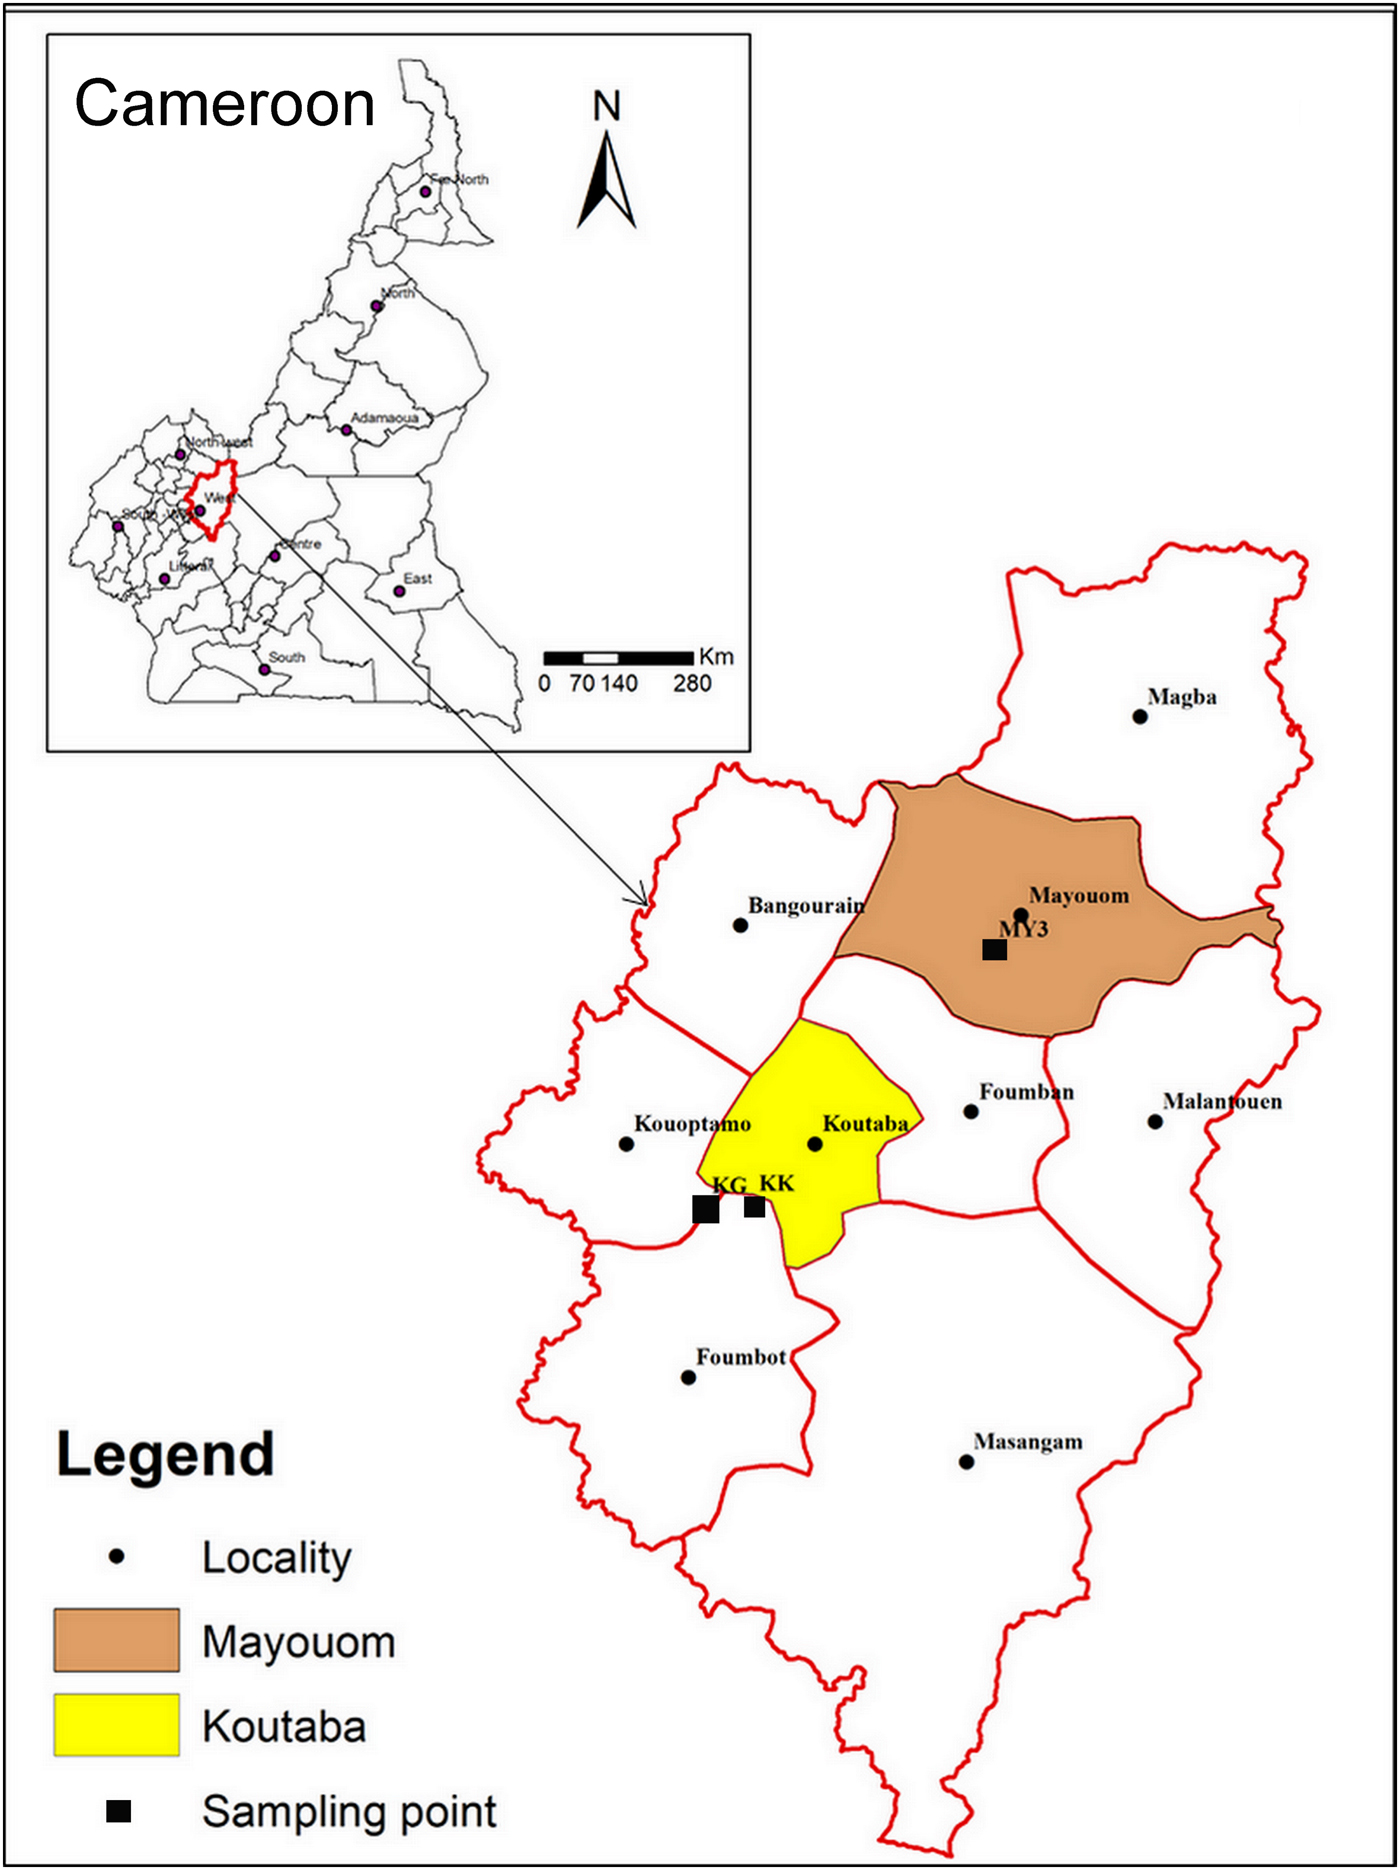
The samples investigated are from two clay deposits in west Cameroon: Koutaba (KK-white and KG-greyish) and Mayouom (MY3-white). Koutaba is situated ~20 km south of Foumban at 5°35′ north latitude and 10°41′ east longitude. Mayouom is ~30 km north of Foumban at 5°51′ north latitude and 10°59′ east longitude (Fig. 1). The clayey materials KK and MY3 are of residual origin and result from the alteration of granites (Nkalih et al., Reference Nkalih, Njoya, Yongue, Tapon, Nzeukou, Mache, Siniapkine, Flament, Melo, Ngono and Fagel2015) and mylonites (Njoya, Reference Njoya2007), respectively. KG is a hydromorphic clay found in a large alluvial plain (Nkalih et al., Reference Nkalih, Njoya, Yongue, Tapon, Nzeukou, Mache, Siniapkine, Flament, Melo, Ngono and Fagel2015). The selection of these deposits was based on previous studies that indicated their sufficient extent for industrial exploitation (Njoya et al., Reference Njoya, Nkoumbou, Grosbois, Njopwouo, Njoya, Courtin, Yvon and Martin2006; Njoya, Reference Njoya2007; Tassongwa et al., Reference Tassongwa, Nkoumbou, Njoya, Njoya, Tchop, Yvon and Njopwouo2014; Nkalih et al., Reference Nkalih, Njoya, Yongue, Tapon, Nzeukou, Mache, Siniapkine, Flament, Melo, Ngono and Fagel2015). These sites are also attractive due to their good road access.

Fig. 1. Map of Cameroon showing the locations of the materials studied (after Nkalih, Reference Nkalih2016).
The raw clays were sampled at various depths from 0.3 to 1.8 m using hand augers. They were oven dried until they reached constant mass at 110°C, ground manually and sieved at 100 µm.
The chemical composition was determined by X-ray fluorescence (XRF). Samples were prepared by fusion with lithium tetraborate and lithium bromide in platinum crucibles (Bennett et al., Reference Bennett and Oliver1976) and casted to form glass beads. The analysis of the mineralogical phases was performed by X-ray diffraction (Bruker D8 Advance diffractometer) using monochromatic Cu-Kα radiation (l = 1.5406 Å) over the range 2–70°2θ in steps of 0.020° operated at 40 kV and 25 mA (Reynolds & Moore, Reference Reynolds and Moore1989).
The particle-size analysis of the samples was performed at the Laboratory of Geotechnologies at the University of Yaoundé I. The samples were dry-sieved to obtain the ≥100 µm fraction. The fraction of <100 µm was obtained by gravity sedimentation according to Stoke's law. Plasticity was characterized by the Atterberg limits (plastic limit [PL], liquid limit [LL] and plasticity index [PI]) determined with the Casagrande method (American Society for Testing Materials [ASTM] norm D-4318).
The thermal linear expansion was measured on pressed cylindrical clay samples with a connecting rod dilatometer. Specimens were heated from 20 to 1400°C for KK and from 20 to 1300°C for MY3 and KG at 5°C/min heating and cooling rates. To investigate the thermal behaviour of the samples, 3 cm × 3 cm cylindrical specimens were pressed uniaxially at 42 MPa using a hydraulic press. These specimens were fired at 1300, 1400 and 1500°C for 4 h in an electric furnace with heating and cooling rates of 5°C/min.
The fired products were characterized by their linear shrinkage (El Yacoubi et al., Reference El Yacoubi, Aberkan and Ouadia2006), their bulk density, water absorption, open porosity and compressive strength, and by phase analysis. Bulk density, water absorption and open porosity were determined using the hydrostatic method (Seynou et al., Reference Seynou, Flament, Sawadogo, Tirlocq and Ouedraogo2013). Compressive strength was calculated from the maximum load obtained during a test on fired products using a hydraulic press.
The mineralogical composition of fired products sintered at 1300 to 1500°C was determined by XRD using a Philips PW 1729 diffractometer operating at 40 kV, 40 mA using graphite monochromatic Cu-Kα radiation. The XRD patterns were treated with CRYSTAL software to determine the mineralogy. The microstructure was determined on the polished surface of fired products with optical microscopy.
RESULTS AND DISCUSSION
Raw material characterization
Chemical composition
The chemical compositions of the samples are listed in Table 1. Sample KK is richest in SiO2 and poorest in Al2O3, whereas samples KG and MY3 have similar SiO2 and Al2O3 contents. The presence of fluxing agent such as TiO2, Fe2O3, alkalis, CaO and MgO may contribute to decrease of the melting temperature and increase in the appearance of vitreous phases. The large SiO2 content in sample KK is due to the large sand fraction (Table 1). The Al2O3 content ranges between 10% and 30% and the SiO2 content is <85%. Therefore, KK, KG and MY3 may be considered for manufacturing low-alumina fireclay refractory materials (LF10 group) (ISO 10081-1, 2003).
Table 1. Chemical composition (wt.%) of the clays.
bdl = below detection limit; LOI = loss on ignition.
Mineralogy
The XRD traces of the KK, KG and MY3 clays are shown in Fig. 2. Sample KK consists mainly of kaolinite, illite, quartz and goethite. The high quartz content is in good agreement with the particle-size distribution and chemical analyses. Sample KG contains kaolinite, quartz, montmorillonite and anatase as the main phases. The presence of montmorillonite explains the high plasticity of this clay. MY3 consists of kaolinite, quartz, illite, goethite and anatase. The presence of anatase in KG and MY3 is in good agreement with the TiO2 content (Table 1). In summary, the three materials contain kaolinite associated with illite or montmorillonite and quartz.
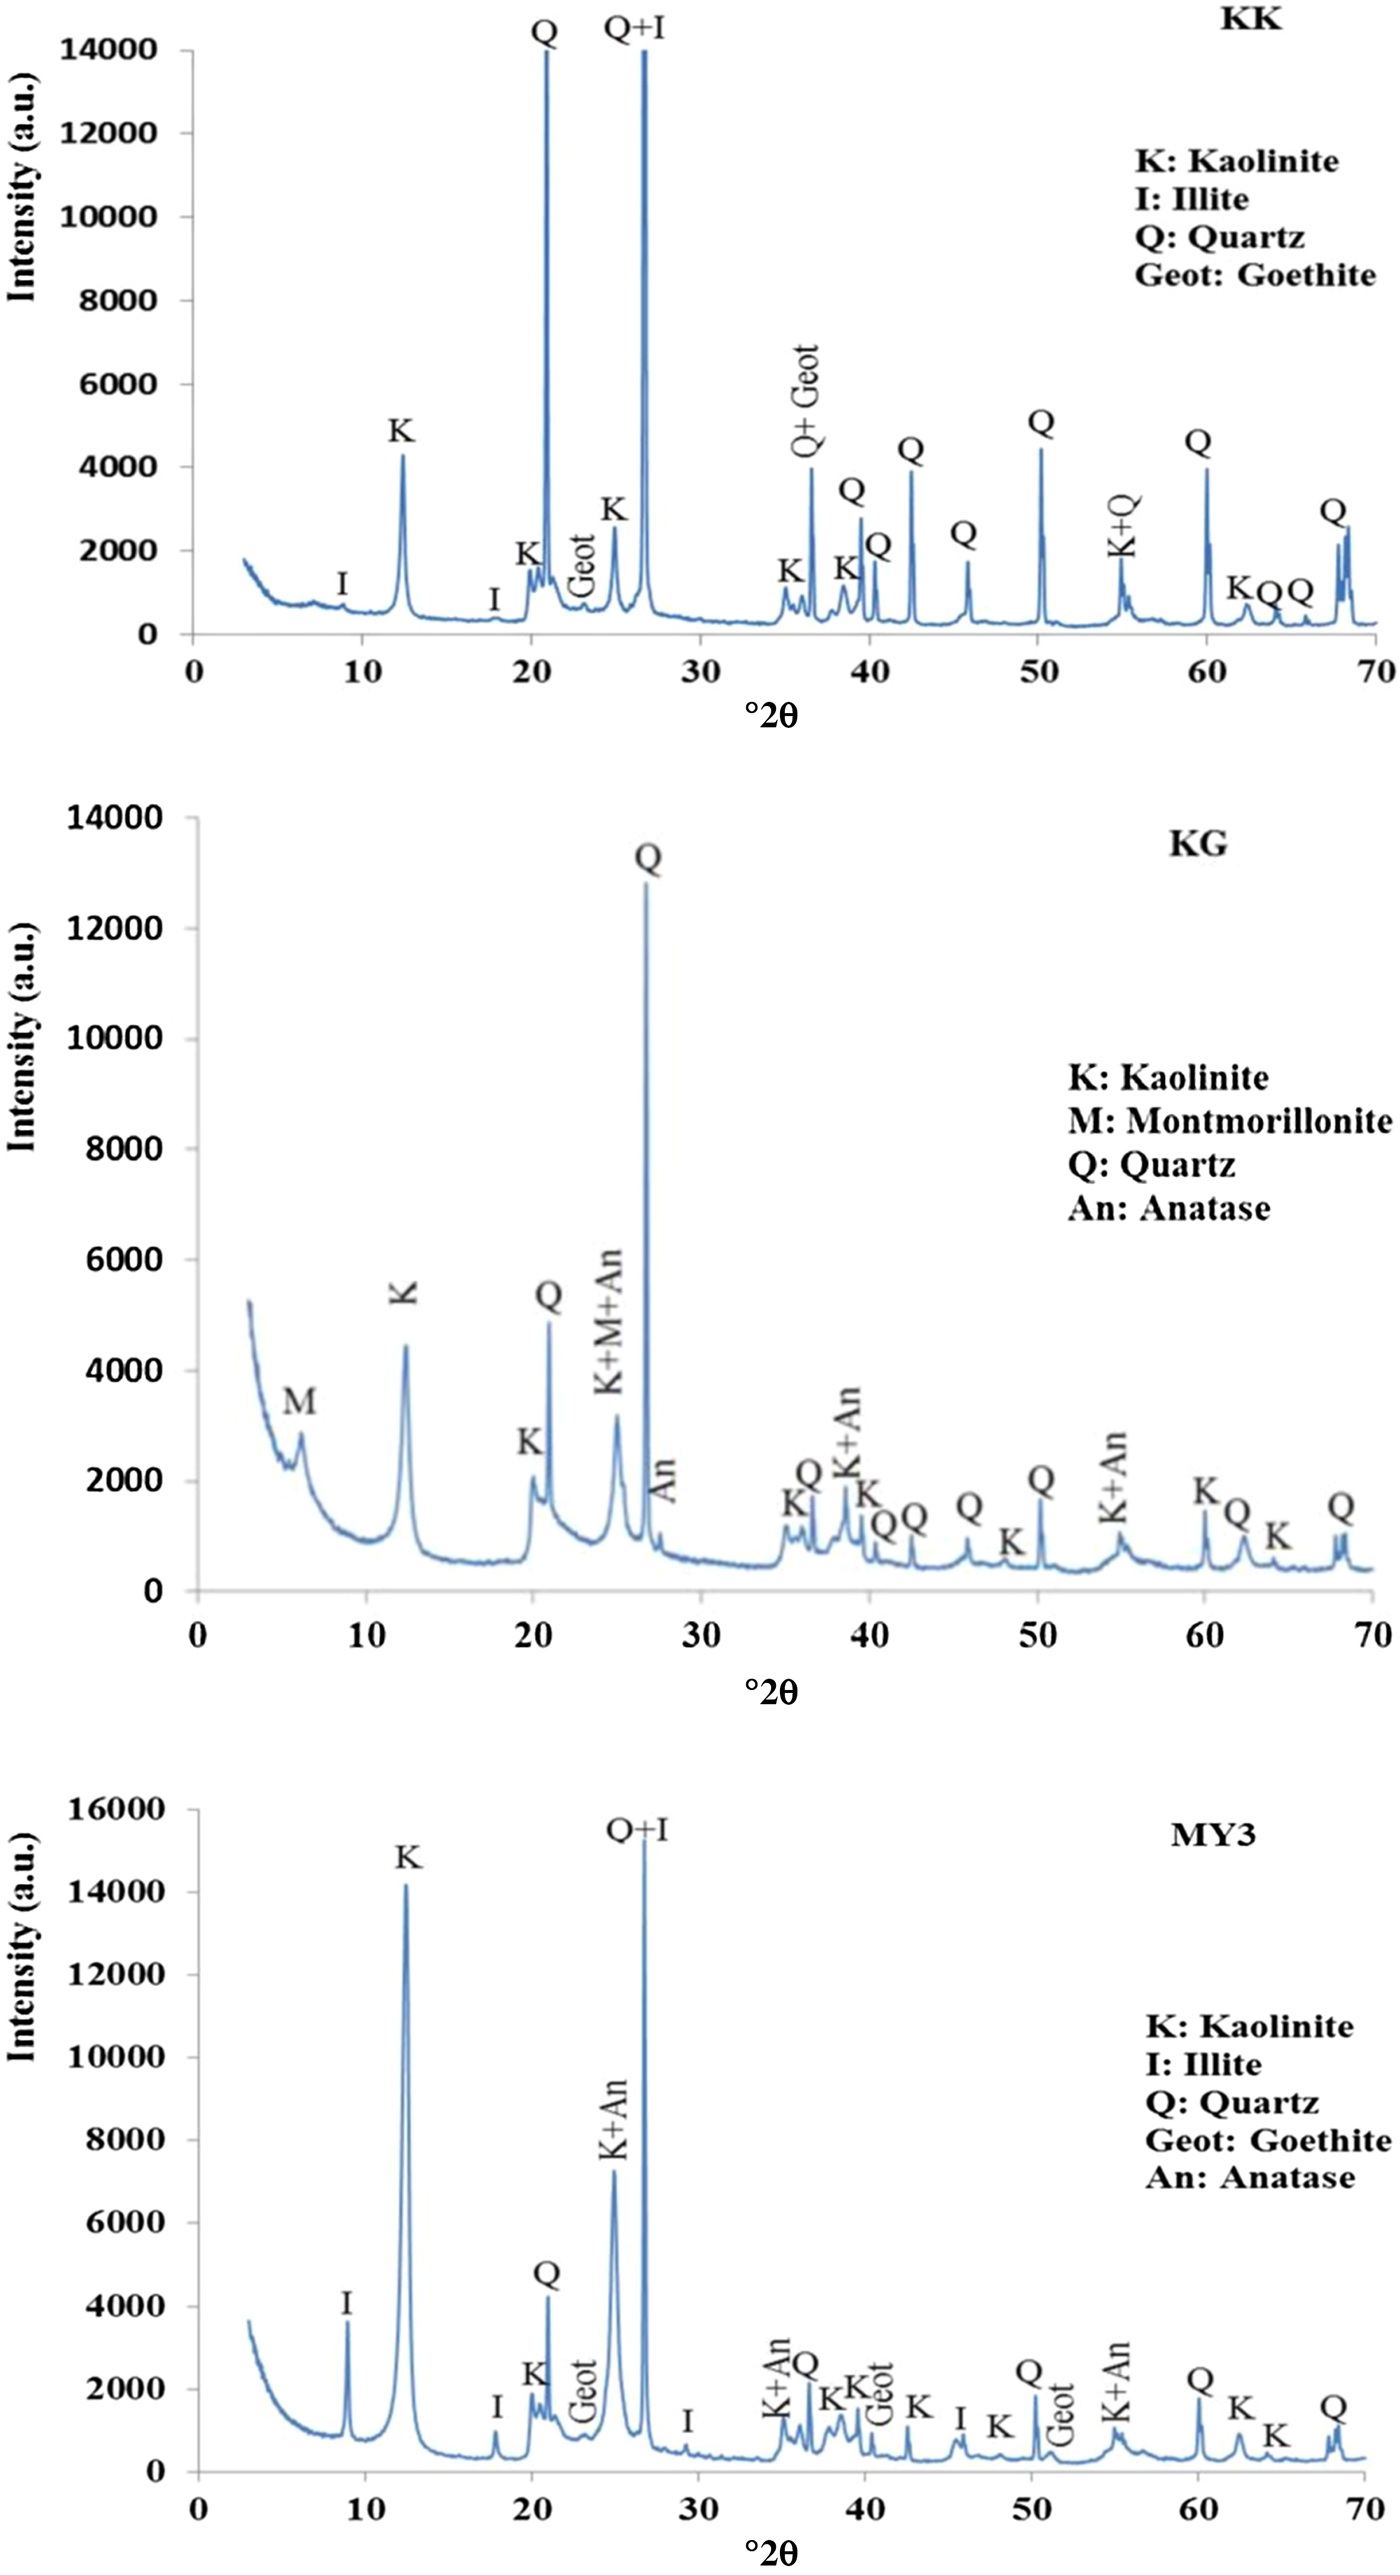
Fig. 2. XRD traces of samples KK, KG and MY3.
Particle-size distribution and plasticity
The particle size distribution of the raw materials is listed in Table 2. The silt fraction predominates in the clayey materials KK and MY3, whereas clay fraction predominates in KG. Specimen KK has the largest sandy fraction and the smallest clay fraction.
Table 2. Particle-size distribution of the raw materials.
Table 3 lists the results of the Atterberg limits (PL, PP and PI) of the three samples. KK has the smallest PL and LL values of the three samples; hence, it requires a smaller water content to be plastic and to flow without external force. PI corresponds to the water content of a clay necessary to allow it to be plastic: the more plastic the clay, the more water that is retained without the clay becoming fluid (Jouenne, Reference Jouenne1984). The PI of the KG clay (39%) is very large compared to those of MY3 (18%) and KK (7%). The PI is linked to the clay-mineral content (Kornmann & Ingénieurs du Centre Technique des Tuiles et Briques, Reference Kornmann2005).
Table 3. Atterberg limits of the clays.
Plasticity is an important parameter in industrial processes. After mixing with large chamotte grains, raw clay only acts as the bonding phase of the materials and only small quantities of water may be added for the classical dry-pressing method. Plasticity is necessary for the extrusion process of fabrication. A high plasticity allows the clay to lubricate and facilitate displacement and densification of the chamotte particles and to reduce friction along the steel mould. This parameter was not investigated in the present laboratory work. In industrial practice, KG clay might be used to increase the plasticity of the raw material mixtures, if necessary.
Thermo-dilatometric analysis
Figure 3 displays the dilatometric curves of the three clays. Up to 500°C, the three clays exhibit a small expansion due to the thermal activation associated with heating. Sample KK exhibits expansion at temperatures of >575°C, whereas samples MY3 and KG exhibit sharp shrinkages between 575 and 600°C. The KK expansion may be explained by the α → β quartz phase transition associated with a large volume expansion. The greater quartz content and the smaller clay-mineral content of this sample is in accord with this interpretation. The shrinkage of MY3 and KG is explained by the dehydroxylation of kaolinite, which results in metakaolinite formation (Djangang et al., Reference Djangang, Lecomte, Elimbi, Blanchart and Njopwouo2010; Bakr, Reference Bakr2011; Zerbo et al., Reference Zerbo, Sorgho, Kam, Soro, Millogo, Guel, Traoré, Gomina and Blanchart2012; Sadik et al., Reference Sadik, El Amrani and Albizane2014).
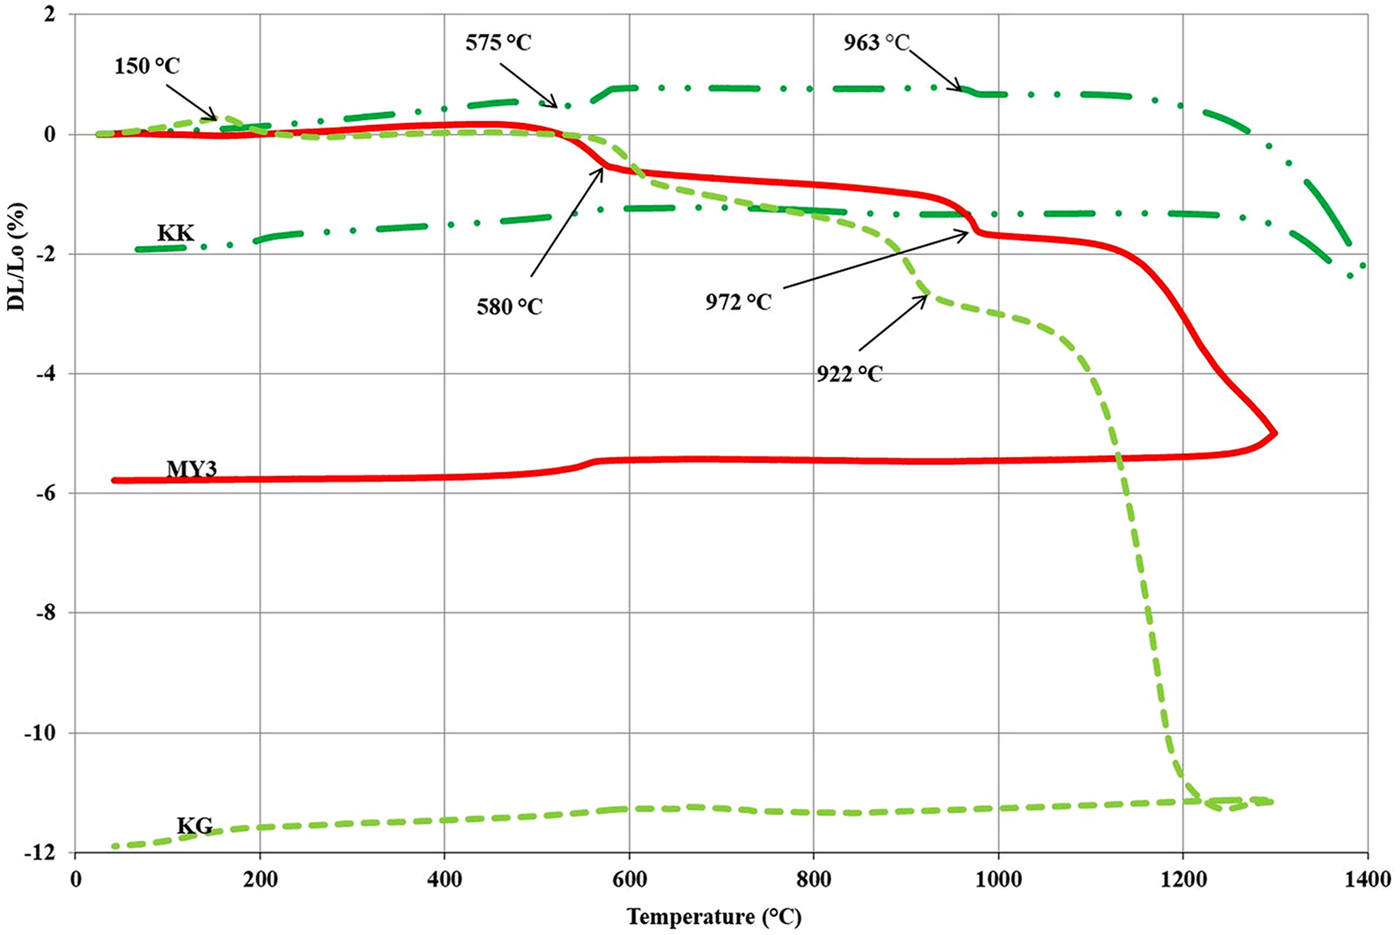
Fig. 3. Dilatometric curves of the clays. Lo = initial length of the brick sample; DL = length of the same sample measured at a specific temperature during firing; DL/Lo = the rate of material expansion/shrinkage.
The next sharp shrinkage was observed at between 900 and 975°C in the KG and MY3 samples and is related to the breakdown of metakaolinite and the reorganization of the system (Ribeiro et al., Reference Ribeiro, Tulyagavov, Ferreira and Labrincha2005; Pialy et al., Reference Pialy, Tessier, Njopwouo and Bonnet2009). The intensity of this event may be related to the clay-mineral content. It is larger for the KG sample than for the MY3 sample.
Above this temperature range, the dilatometric curves (Fig. 3) exhibit a small negative slope, which may be related to a slow sintering associated with shrinkage. At 1000°C (KG) and 1050°C (MY3), the curves indicate a sharp shrinkage indicating acceleration of sintering. The KK sample exhibits greater refractoriness because the sharp shrinkage appears at ~1200°C. Sintering is due to solid and/or liquid diffusion. At lower temperatures, sintering is mainly due to solid diffusion and/or a small amount of the liquid phase. At higher temperatures, the sharp shrinkage may be explained by the sudden appearance of a large quantity of the liquid phase, promoting greater diffusion and flowing into the pores. Firing shrinkage is largely controlled by the finer, most ‘active’ particles: the clay minerals and fluxing agents. Depending on their nature and abundance, they promote the appearance of larger amounts of the liquid phase at high temperatures (Chavez & Johns, Reference Chavez and Johns1995). The high refractoriness of the KK sample is due to the large quartz content. Quartz is at the end of the binary Al2O3–SiO2 system phase diagram, with a higher melting temperature than for clay minerals located near the eutectic composition (Lapoujade & Le Mat, Reference Lapoujade and Le Mat1986).
Fired-product characterization
Physical and mechanical properties of fired products
Figure 4 presents the evolution of the shrinkage, bulk density, water absorption, open porosity and compressive strength vs. firing temperature. Samples KG and MY3 exhibit similar behaviour. Shrinkage and bulk density increase (Fig. 4ab), while open porosity and water absorption decrease (Fig. 4cd) in the temperature range 1300–1500°C. As previously explained, this sintering behaviour may be explained by the presence of a large amount of clay and impurities (Tables 1, 2), and the thermal behaviour already observed during the dilatometric analysis.
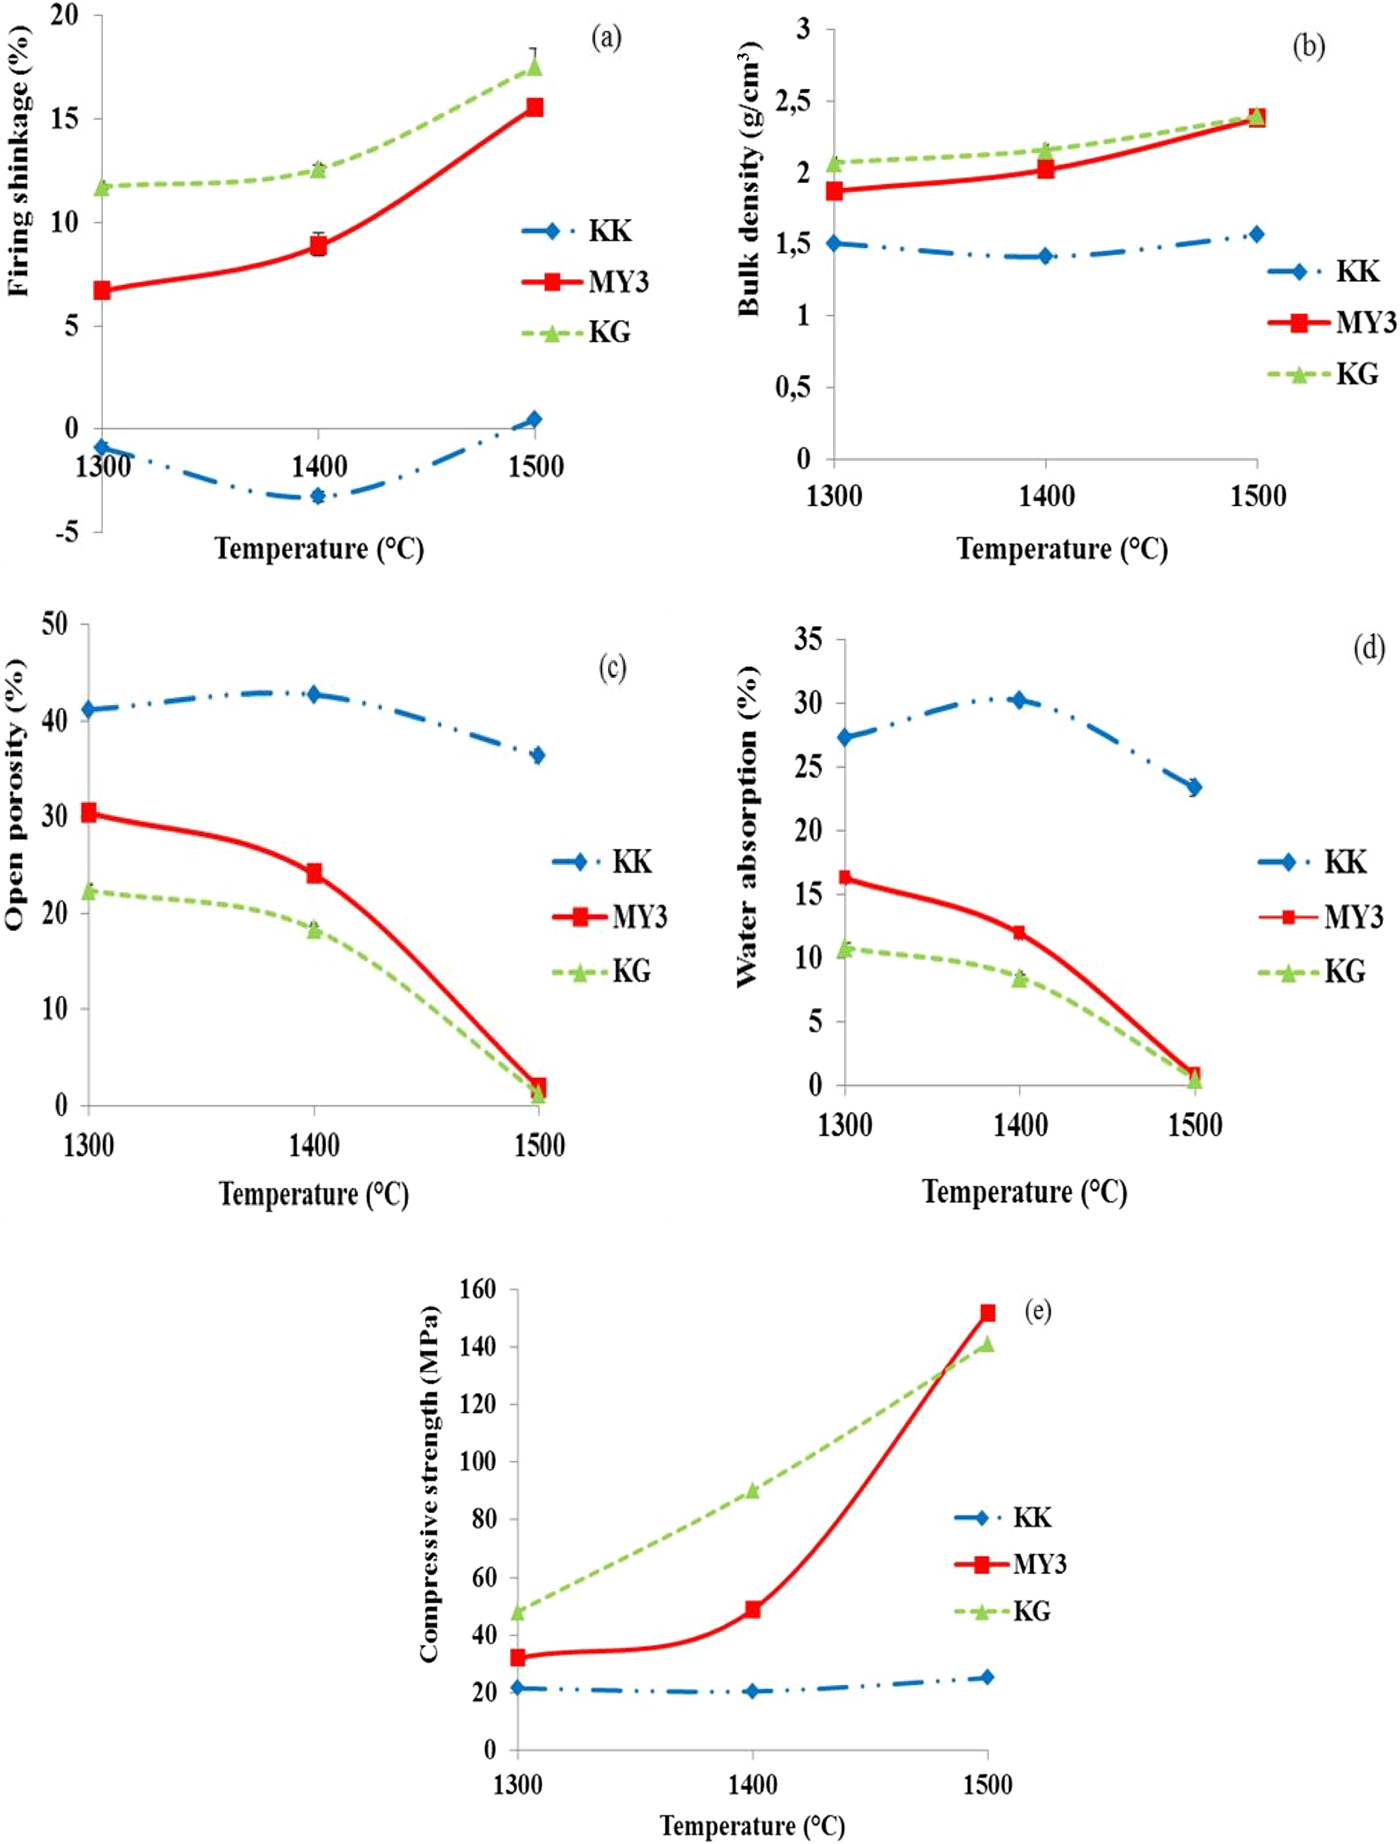
Fig. 4. Densification behaviour of fired products vs. temperature: (a) firing shrinkage; (b) bulk density; (c) open porosity; (d) water absorption; and (e) compressive strength.
Densification of sample KG is greater than that of sample MY3 at 1300°C, but the gap between the two samples decreases with increasing temperature. The densification of these materials results from sintering due to induced liquid phases and from mullite crystallization and SiO2 phase transformation (quartz to cristobalite) with volume changes (Figs 4, 5). At 1500°C, the two materials are fully densified, the density is maximal and the open porosity is minimized. The evolution of the compressive strength of the fired bodies is similar to the density evolution: it increases with firing temperature, reaching similar values at 1500°C for both clays.
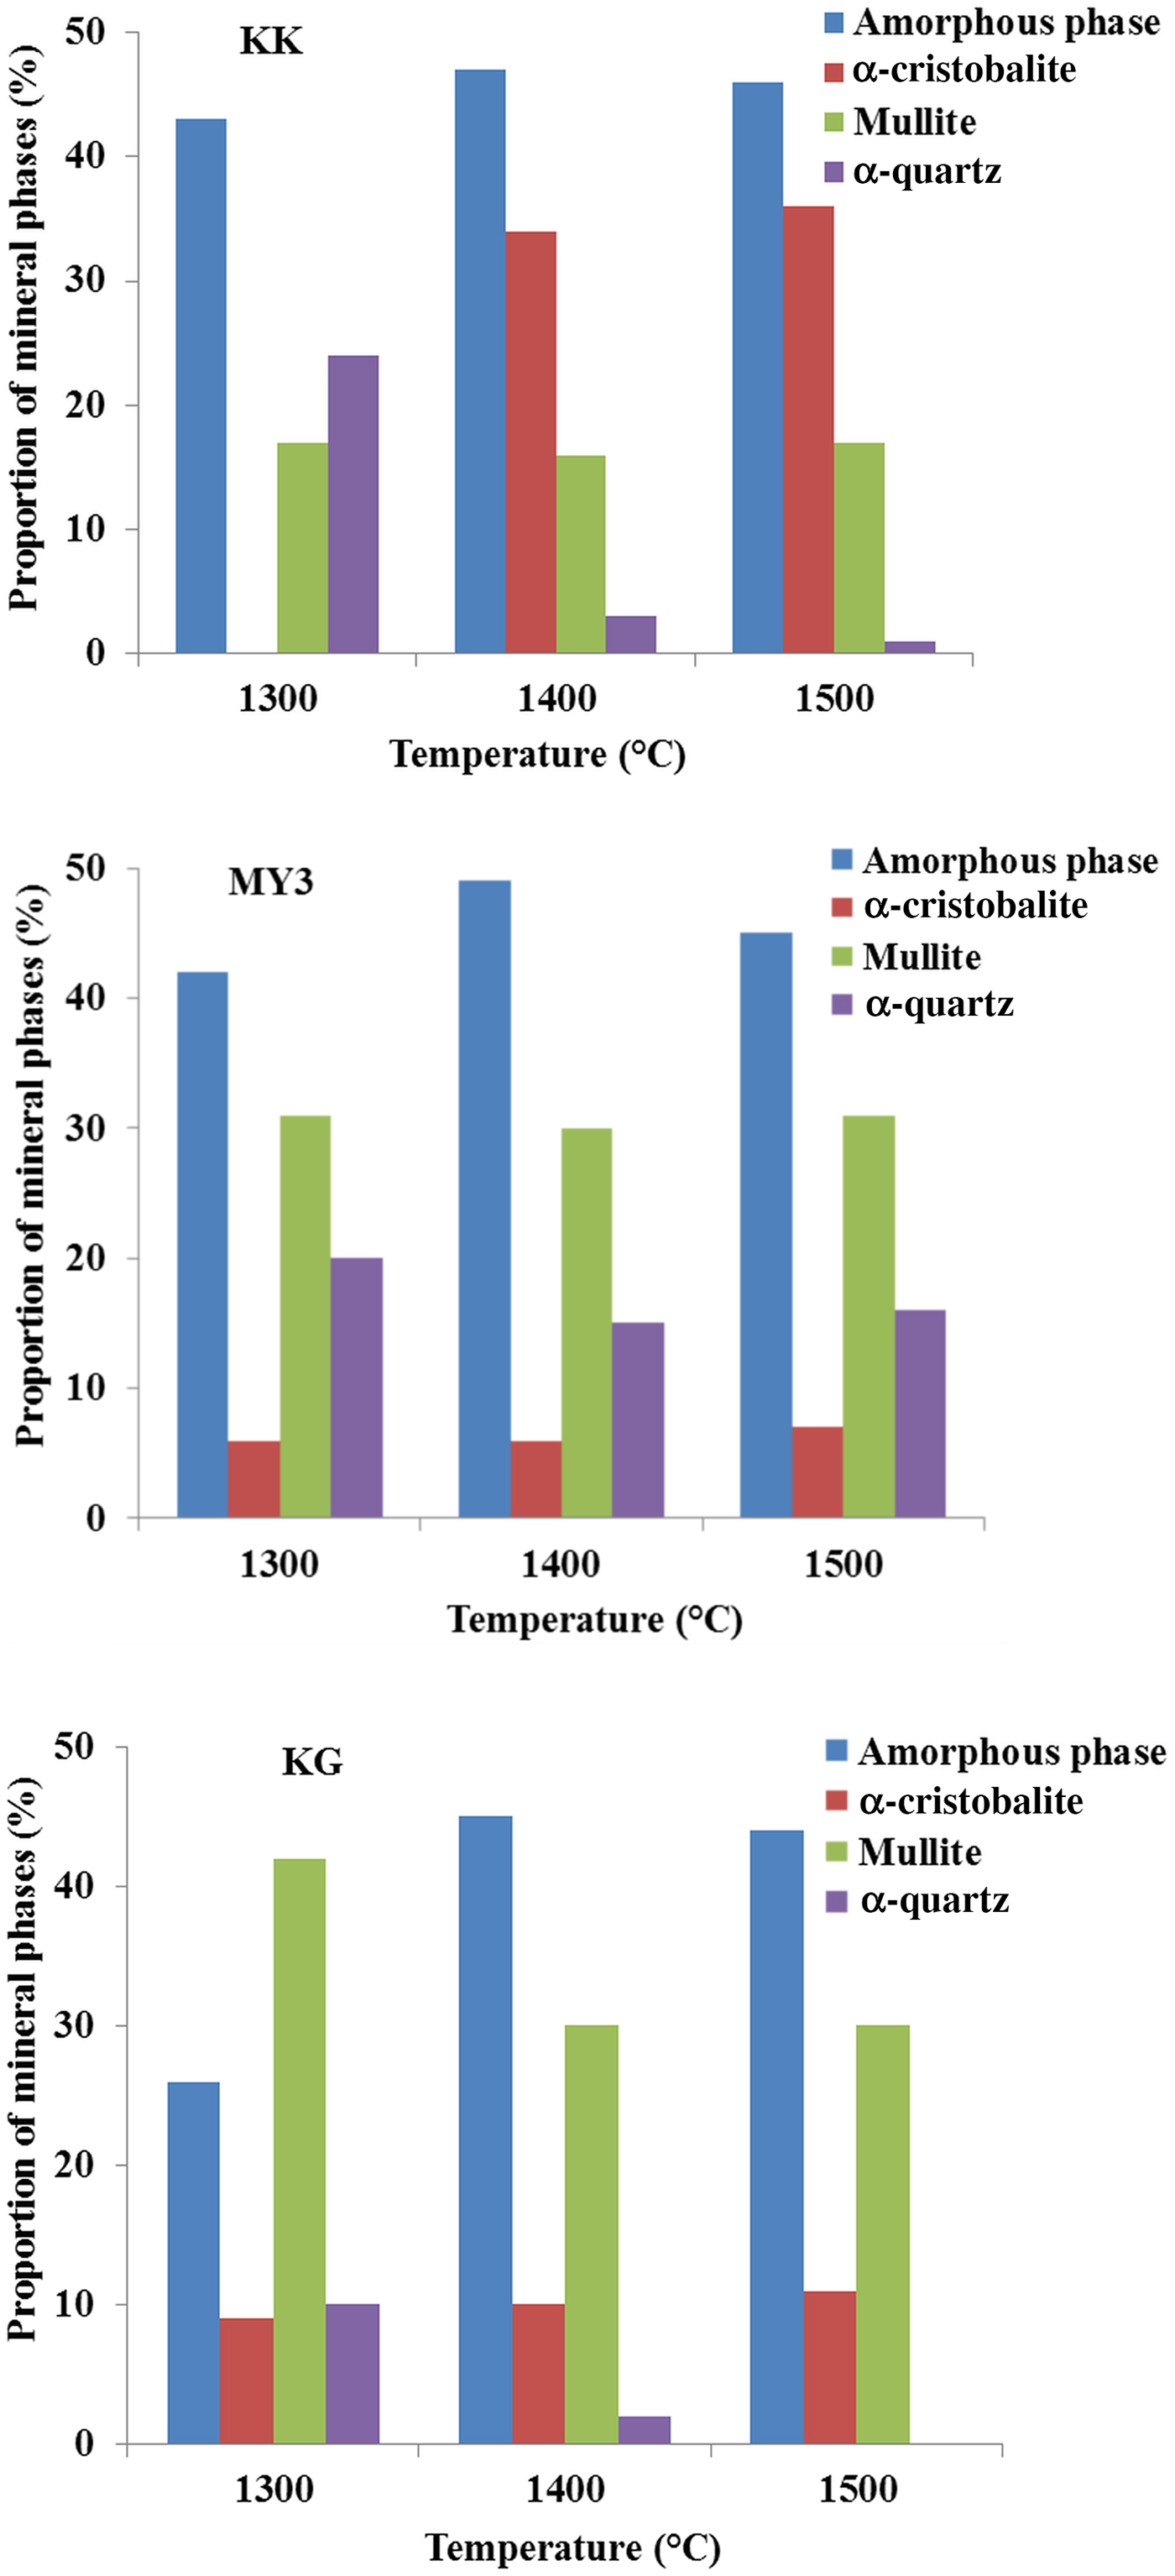
Fig. 5. Semi-quantitative analysis of the fired products vs. temperature.
In the temperature range used in this study (1300–1500°C), the KK clay exhibits a small expansion (negative shrinkage) at 1300 and 1400°C, and at 1500°C the shrinkage is almost zero. Density is more or less constant at all temperatures and open porosity values are similar at 1300 and 1400°C. A small decrease is observed at 1500°C. This behaviour may be explained by the small clay and impurity contents (Tables 1, 2), promoting very little of the liquid phase at these firing temperatures. This behaviour may also be explained by the quartz to cristobalite transformation with a 17.4% expansion (Routschka & Wuthnow, Reference Routschka and Wuthnow2012), which counterbalances densification.
Overall, the thermal behaviour of the three clays is related to their mineralogical and chemical compositions.
X-ray diffraction of the fired clays
The XRD patterns of the fired bodies are given in Fig. 6 and their semi-quantitative analysis is presented in Fig. 5. All fired materials contain quartz as in the original clays, but they also contain some new phases, namely mullite, cristobalite and amorphous matter. Mullite results from the reaction (Sahnoune et al., Reference Sahnoune, Chegaar, Saheb, Goeuriot and Valdivieso2008):
 $$3{\rm A}{\rm l}_2{\rm O}_3 + {\rm} 2{\rm Si}{\rm O}_2\to {\rm} 3{\rm A}{\rm l}_2{\rm O}_3.2{\rm Si}{\rm O}_2$$
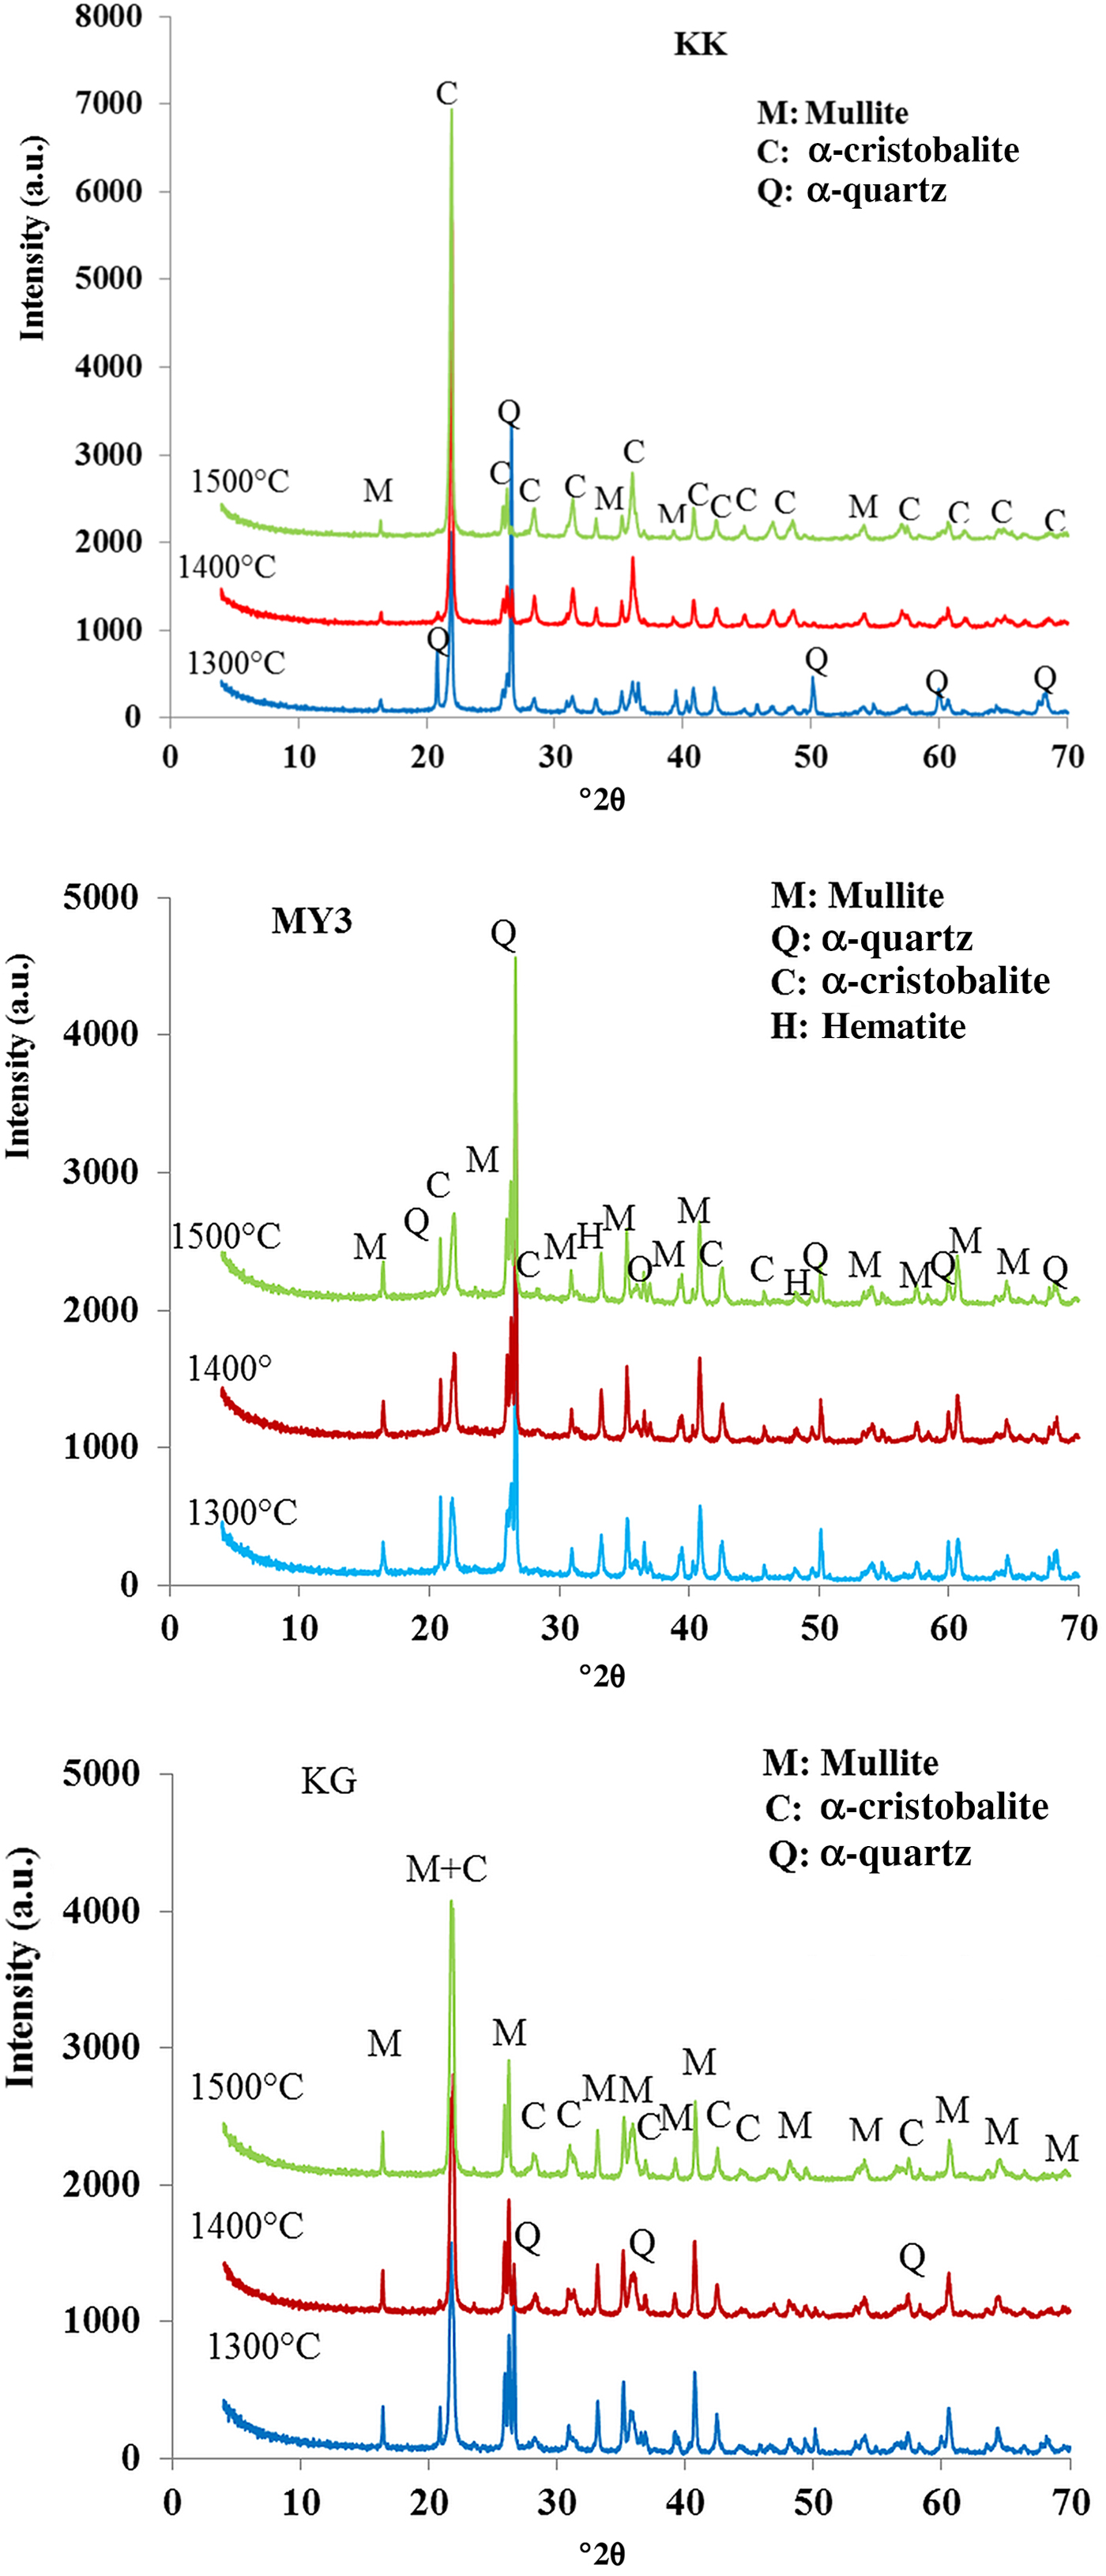
Fig. 6. XRD patterns of the fired bodies.
Cristobalite is the result of the quartz transformation at temperatures of >1100°C (Gualtieri & Bertolani, Reference Gualtieri and Bertolani1992). The amorphous phase results from the melting of impurities at higher temperatures that act as fluxes and promote the melting of silicate phases. Due to the high SiO2 content, the liquid phase does not crystallize during cooling and a vitreous phase appears, which includes SiO2, Al2O3 and the impurities (Chen et al., Reference Chen, Lan and Tuan2000).
The amount of mullite is proportional to the Al2O3 content (Fig. 5; Table 1), which explains the smaller amount of it in sample KK at all temperatures and the similar abundances in samples MY3 and KG at 1400 and 1500°C. In sample KG, the larger amount of mullite at 1300°C is followed by decreases at 1400 and 1500°C, indicating diffusion of Al2O3 across a longer distance, dissolution in the amorphous phase and homogenization of the composition. The same behaviour may also hold for longer firing times at 1300°C. For the three clays, the mullite content does not change between 1400 and 1500°C, indicating a full reaction. Therefore, the mullite contents determined are the maximum ones. The quartz abundance decreases and cristobalite increases with increasing temperature. In samples KK and KG, quartz was not detected at 1400 and 1500°C. In contrast, in sample MY3, quartz is abundant (~15%) at 1400 and 1500°C. The amount of amorphous phase and the temperature of appearance depend on the abundance of Fe2O3 and TiO2 fluxes (Table 1). The three materials contain large amounts of amorphous matter at 1300°C, in good agreement with dilatometric results. The final amounts of amorphous matter (at 1400 and 1500°C) are comparable in all materials. In samples KK and MY3, the abundance of the amorphous phase may be considered constant across the whole temperature range (1300–1500°C), considering the limitations of its determination. In the KG sample, the amorphous phase content varies inversely with mullite between 1300 and 1400°C. This might be explained by a rapid crystallization of mullite from clay particles, followed by the dissolution in the vitreous phase, depending on the kinetic appearance of the latter.
Optical microscopy
Photomicrographs of the fired products at 1400 and 1500°C are shown in Fig. 7. At 1300°C, the material surface is rough due to the low sintering degree and the high residual porosity. At higher temperatures, the polished surfaces are smoother due to densification and porosity closure. During heating, iron diffuses and contributes to the colouration of the final materials. Iron is included in the coloured solid solution and it is also dissolved in a more or less coloured amorphous phase. Hence, iron is the main ‘colouring’ impurity. Sample MY3, with its smaller Fe2O3 content (Table 1), is whiter than its counterparts. Sample KK, with an intermediate Fe2O3 content, has some dark spots. Sample KG exhibits a brownish colour due to its large Fe2O3 content (Bakr, Reference Bakr2011). The small brown spots in this sample indicate the location of initial goethite particles.
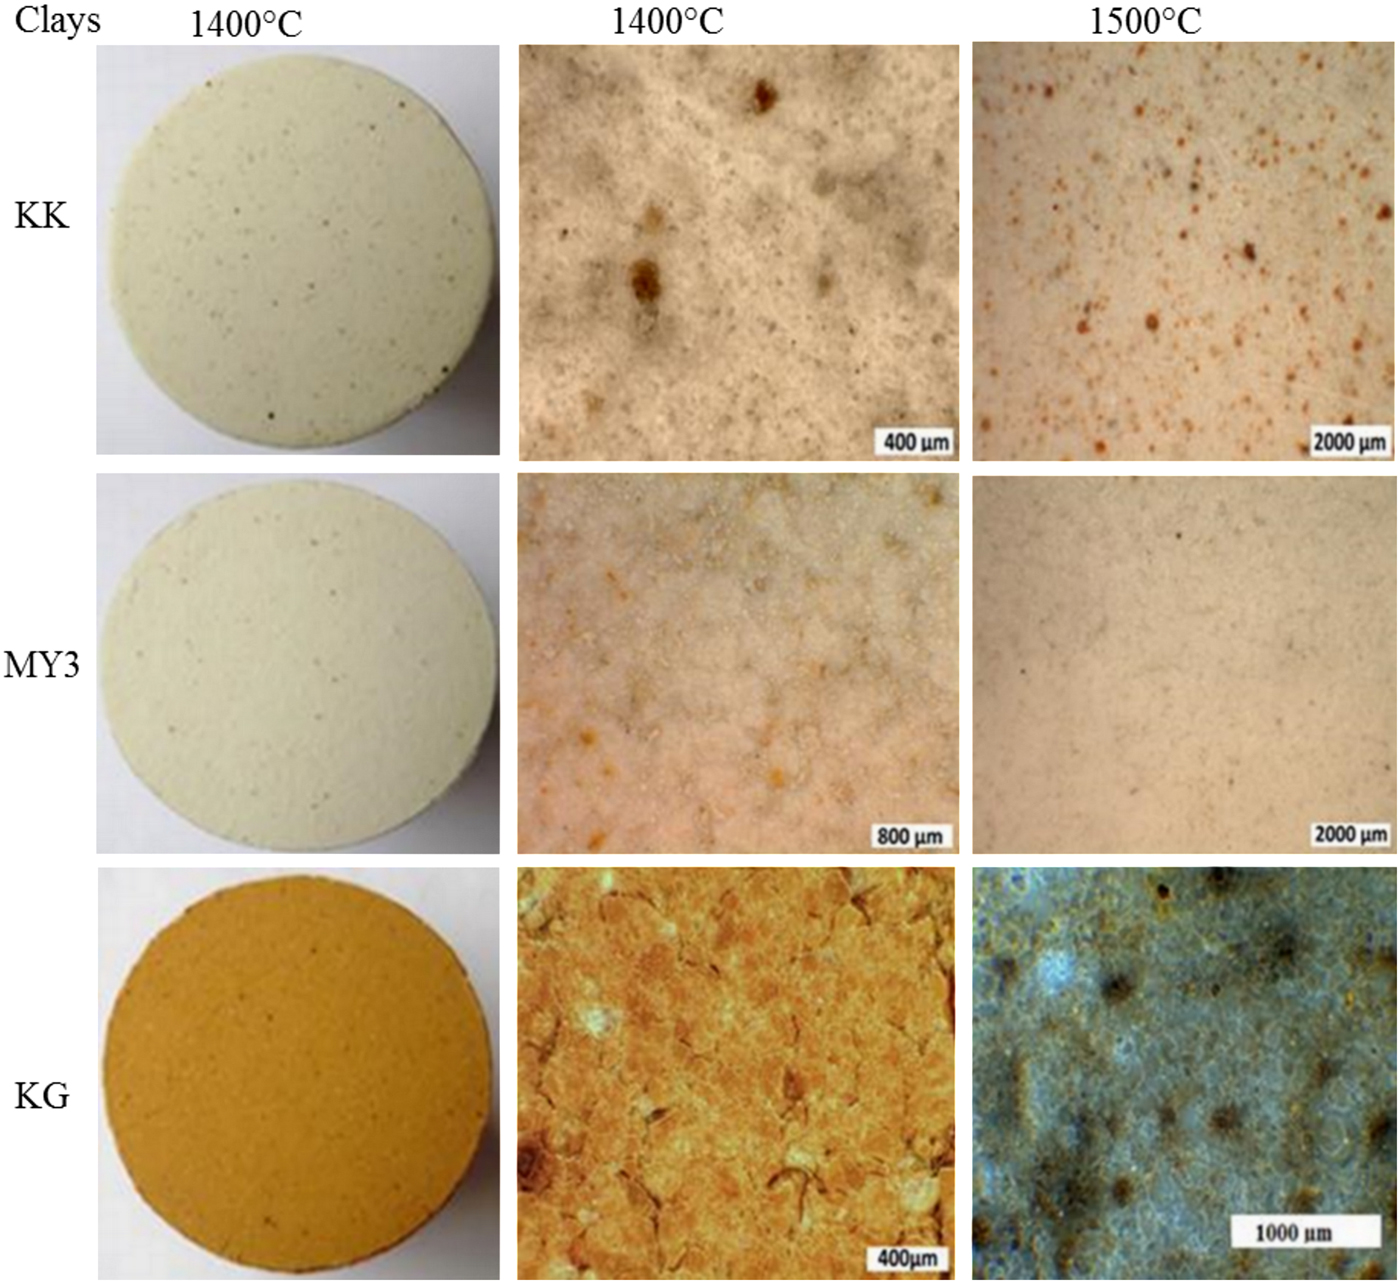
Fig. 7. Photomicrographs of the polished surfaces of the fired products.
SUMMARY AND CONCLUSIONS
This work is a contribution to the characterization of three clayey raw materials of the Koutaba and Mayouom deposits from west Cameroon and the evaluation of their suitability for use in the preparation of refractory bricks.
The three clays consist of kaolinite and quartz, associated with illite and goethite (KK); montmorillonite and anatase (KG); and illite and anatase (MY3). The clays contain 10–30% Al2O3, <85% SiO2 and 1–3% impurities.
The thermal behaviour of each clay may be related to the abundances of both the clay minerals and the impurities. High levels of clay and impurities promote sintering at low temperatures, and low levels cause densification at higher temperatures.
After heating at 1300–1500°C for 4 h, two resulting materials (KG and MY3) exhibit interesting properties for making bricks, (mainly from 1400°C). The KK sample with the larger SiO2 content exhibits a small amount of densification even at 1500°C. These materials may be used as raw materials for the manufacture of low-Al2O3 refractory materials belonging to the LF10 Group according to ISO 10081-1 (2003).
ACKNOWLEDGMENTS
The authors are grateful to the PAFROID project (Intra-African University Mobility Program) and the ARES (Academy of Research and Higher Education), partner of the Belgian Development Cooperation, for the support given to this study through the PRD project entitled ‘Characterization and Valorization of Foumban clays (West Cameroon)’.