


The majority of ceramic products are made from clay materials, which are complex natural mixtures of minerals with variable properties (Celik, Reference Celik2010; Ngun et al., Reference Ngun, Hasmaliza, Shamsul, Kiyoshi and Zainal2011; Njoya et al., Reference Njoya, Hajjaji and Njopwouo2012). The properties of clays that are of interest to the ceramics industry are plasticity (which facilitates the shape of the body), chemistry, mineral composition, thermal properties, colour, refractoriness and mechanical strength after firing (Burst, Reference Burst1991; Baccour et al., Reference Baccour, Medhioub, Jamoussi and Mhiri2009; Ngun et al., Reference Ngun, Hasmaliza, Shamsul, Kiyoshi and Zainal2011). Knowledge of these characteristics leads to optimization of the use of new clay deposits in local or regional ceramics industries.
The ceramics sector in Algeria is among the least developed sectors in the country. This promising sector would use raw clayey materials, which have been little exploited and are poorly studied, as industrial minerals. The Jijel region in northeast Algeria has large reserves of clays that may wholly or partially supply the ceramics industry. Hence, the National Office of Geological and Mining Research undertook an inventory of useful Algerian raw materials. The inventory confirmed that the country is rich in useful clay materials that should be investigated further (Geological Survey of Algeria and Mining Control Agency, 1999). The Numidian deposits in particular are very promising in the search for clay resources that are suitable for brick manufacture, given their wide extent and the good quality of clay material.
The present study was carried out to characterize Numidian clays collected from the sedimentary Aquitano-Burdigalian Djimla and El-Milia deposits located in the region of Jijel (northeast Algeria). This characterization concerns their physical, chemical and mineralogical properties and ceramic behaviour. This information is crucial for evaluating their potential suitability as raw materials in various ceramics applications. The success of this exploitation might provide new opportunities for the poorly developed ceramics sector and its sustainable development in northeast Algeria.
Geological setting of the clay raw materials
The region of Jijel is located in northeast Algeria, 360 km east of Algiers (Fig. 1b). The study area corresponds to the southern part of Jijel. It is located between latitude 36.5°N and 36.9°N and longitude 5.4°E and 6.5°E.
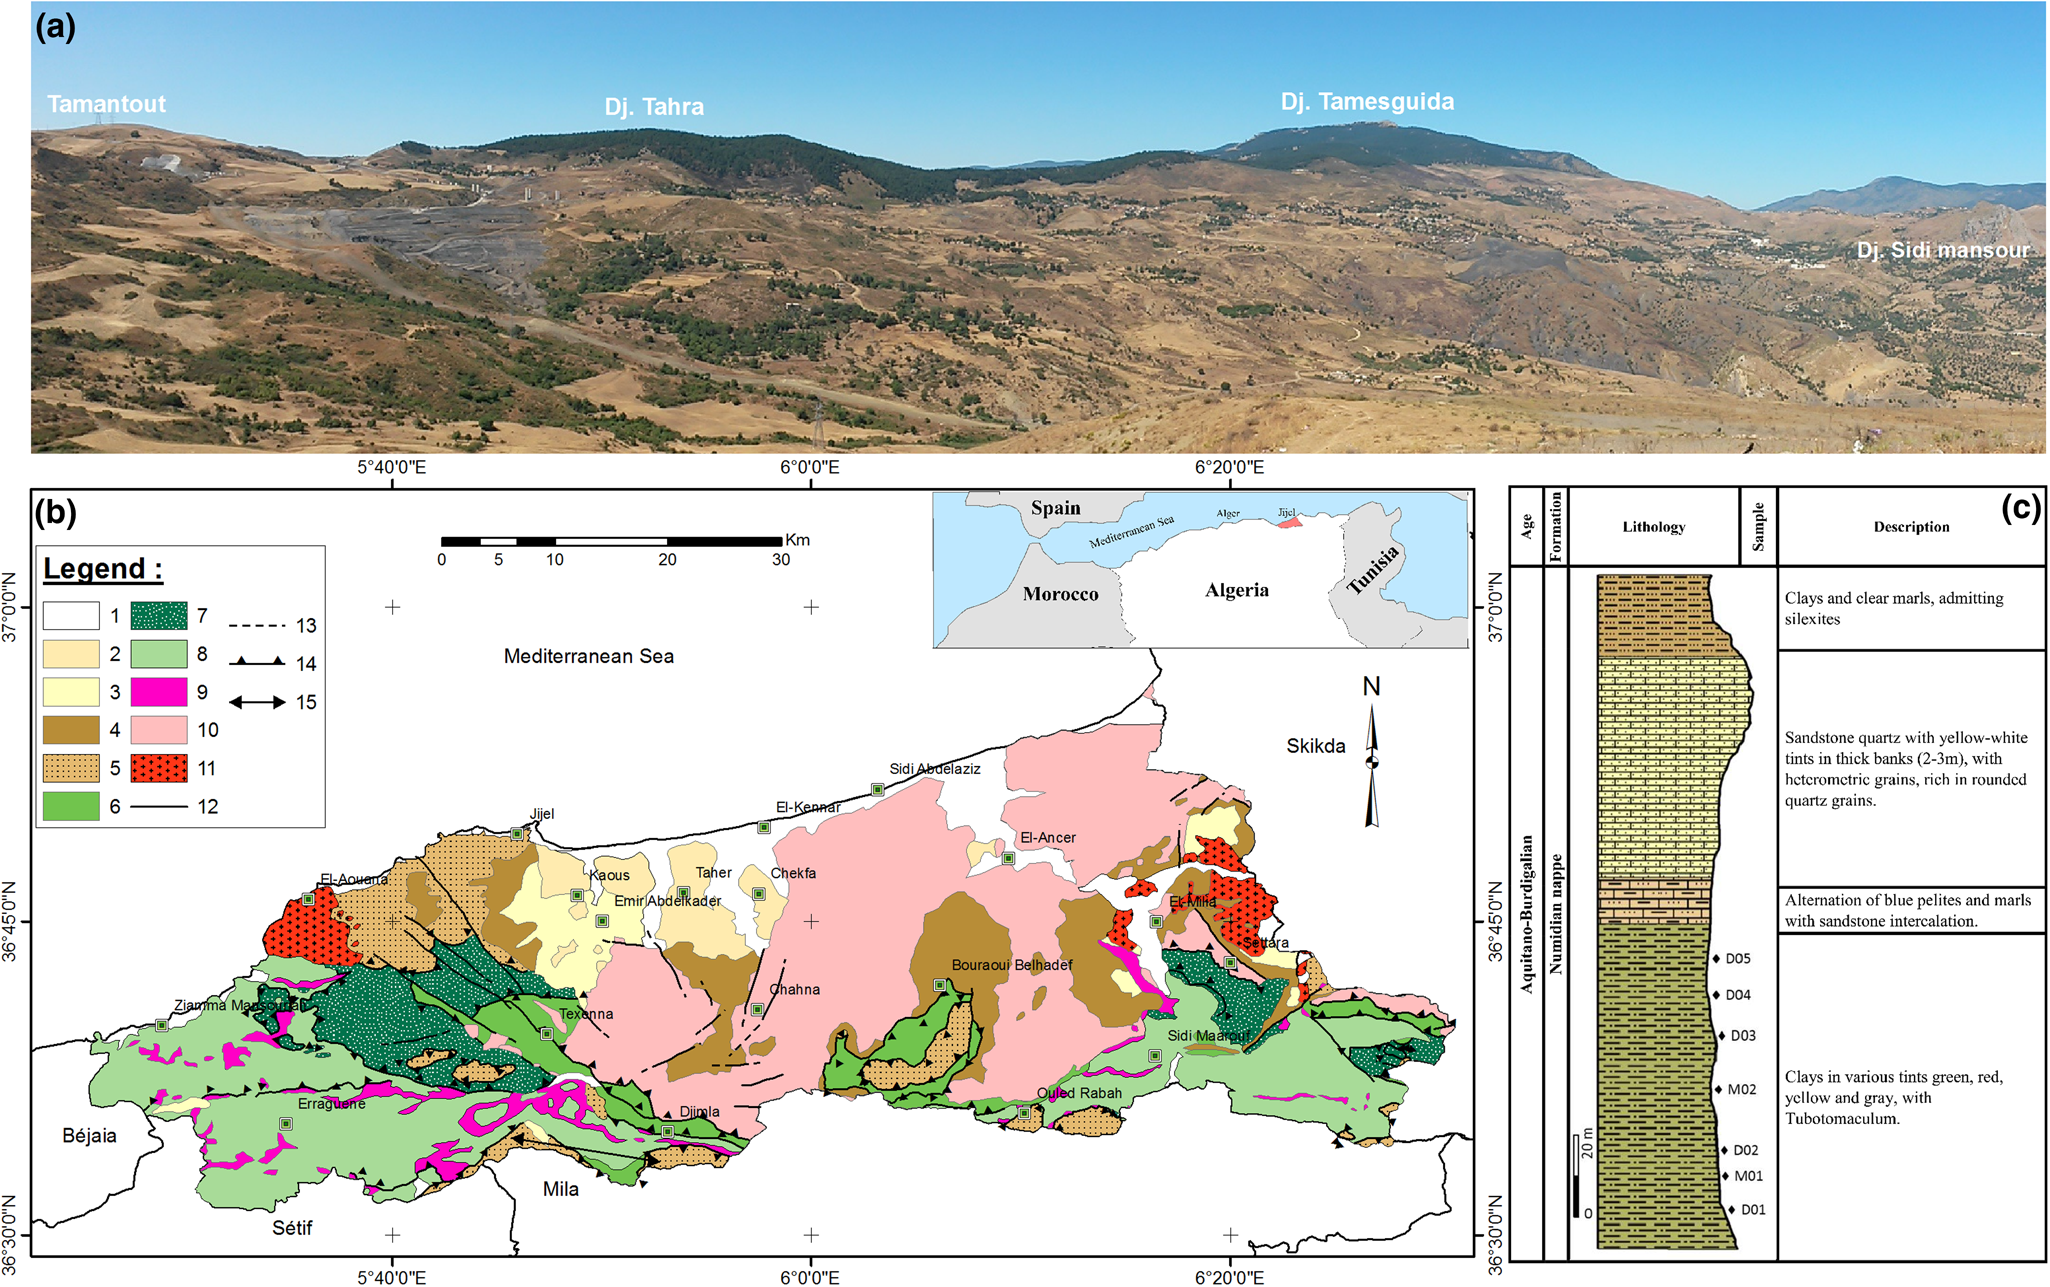
Fig. 1. (a) Field photograph at the Djimla–Tamantout locality showing the extensional of the under-Numidian clay member of the Numidian nappe. (b) Location map of the study area and geological map (extracted from the 1:500 000 structural map of the alpine chain of eastern Algeria and the Algerian–Tunisian borders; Vila, Reference Vila1978). (c) Synthetic lithostratigraphic log of the Numidian nappe. 1. Quaternary: alluvium, current and ancient dunes, screes. 2. Pliocene: microconglomerates, gravels, sand. 3. Burdigalian–Langhian (post-nappe): bluish-grey marl, limestone nodule. 4. Oligo-Miocene Kabyle: molasse, micaceous sandstone. 5. Numidian series (Aquitano-Burdigalian): clays and sandstones. 6. Massylien flysch (Albo-Aptian): sandstones, shales. 7. Mauretanien flysch (Neocomian–Lutetian): sandstone and marl. 8. Tellian series (Lias to Eocene): marl and limestone-marl. 9. Triassic: clayey sandstone, gypsiferous. 10. Kabyle basement: schists, mica-schists, gneiss and cipolin. 11. Magmatic rocks: microdiorite, volcanic lava, granite, microgranite, granodiorite. 12 and 13. Fault (visible or supposed). 14. Thrust fault. 15. Location of the photograph.
Geologically, the region of Jijel forms the western part of the crystallophyllian massif of the ‘Petite Kabylie’, a geographical unit of the coastal chains of eastern Algeria that belongs to the Alpine chain (Maghrébides chain) of North Africa. The Maghrébides chain is part of the peri-Mediterranean Alpine orogen of Tertiary age (Durand-Delga, Reference Durand Delga1969), and it is characterized by the following domains: an internal domain composed of a Precambrian metamorphic basement (mainly schists, marbles and gneiss) and its discordant greso-micaceous sedimentary cover of Oligo-Miocene age with olistostrome debris from the flysch inserted; and a flysch domain consisting of allochthonous flysch plies ranging from Neocomian to Eocene age consisting of deep-sea deposits that were deposited by turbidity currents. In the south, outcrops of allochthonous sedimentary rocks of the Tellian domain are present (Durand Delga, Reference Durand Delga1955; Bouillin et al., Reference Bouillin, Kornprobst and Raoult1977; Vila, Reference Vila1980). Post-nappe deposits (marly clays and microconglomerates) and the Numidian nappe overlie the nappe units over which the Quaternary sediments have been deposited (Durand Delga & Magné, Reference Durand Delga and Magné1952).
The Numidian flysch consists of a thick, turbiditic sandstone and clayey formation of Lower Miocene age, which crops out in various areas of the ‘Petite Kabylie’. The Numidian formations form the upper geological unit of the structural edifice of the ‘Petite Kabylie’ resting unconformably on all other formations. In the Djimla region, the Numidian formations are unconformably deposited on the sedimentary formations of the Tellian domain.
The study areas are characterized by significant outcrops of Lower Miocene (Aquitano-Burdigalian) clays at the Tubotomaculum (Fig. 1a) (Bouillin, Reference Bouillin, Kornprobst and Raoult1977; Lahondère et al., Reference Lahondère, Feiberg and Hac1979). Tubotomaculum are cylindrical bodies a few cm long. They are found in fairly large quantities in the ‘Numidian clays’ of the Mediterranean rim from the Upper Cretaceous to the Oligocene. The outcrops extend approximately east to west over 10 km, with an average thickness of 80–120 m, covered by thin Quaternary deposits and containing important reserves. This formation is well represented in Djebel Bouafroune (1353 m.a.s.l.) and Djebel Tamesguida (1623 m.a.s.l.) south–southwest of the Djimla region and Djebel El-Hadjra (500 m.a.s.l.) west of the El-Milia region (Fig. 1a).
The criteria used to select the under-Numidian clays (see below) of the Djimla and El-Milia regions for this study were: (1) potential reserves; (2) a lack of previous studies on the under-Numidian clays or on the raw materials used for traditional ceramics, especially in this region; (3) the accessibility of the study area, even during the rainy season, by road and by footpaths from nearby towns such as Mila, Sétif, Béjaia, Ben Yadjiss and Jijel; and (4) the extent of the clayey outcrops and their proximity to energy sources (water, gas and electricity).
Material and methods
The lithostratigraphic sequence of the Numidian nappe is divided into four members (Fig. 1c), which are in stratigraphic continuity from bottom to the top. The lowest member consists of clays of various colours with Tubotomaculum known as under-Numidian clays (~120 m thick), passing upwards into an alternation of pelites and marls (10 m), then to the middle member, a thick sandstone with coarse-grained quartz (10–80 m) and finally to the upper member, which includes clays and marls containing silexites (30 m).
In total, seven representative clay samples were collected from the under-Numidian clays belonging to the Numidian nappe (Fig. 1c) in the Djimla region (series D01–D05) and the El-Milia region (M01 and M02), located in the Jijel region (northeast Algeria). The colour of the argillaceous materials varies from red to green. For each sample, 5 kg of material was collected, dried at 50°C for 48 h and then crushed by hand using an agate mortar.
The mineralogical composition of the raw samples and their corresponding clay fractions (<2 µm) were determined by X-ray diffraction (XRD) analysis using a Bruker D8 Advance diffractometer (Department of Geology, AGEs, University of Liège, Belgium) operating at 40 kV and 25 mA using Cu-Kα1 radiation.
For the bulk mineralogy, 1 g of the crude sample was milled in an agate mortar and loaded onto a sample holder and compacted carefully and regularly to limit the preferential orientation of minerals (Moore & Reynolds, Reference Moore and Reynolds1997). Semi-quantitative assessment was conducted by applying correction factors to the measured intensities of the reflections of diagnostic minerals (Cook et al., Reference Cook, Johnson, Matti and Zemmels1975; Boski et al., Reference Boski, Pessoa, Pedro, Thorez, Dias and Hall1998).
Clay mineral analyses were recorded from oriented mounts on glass slides (Moore & Reynolds, Reference Moore and Reynolds1997). The <2 µm clay fractions were separated according to Stokes’ law after dispersion in distilled water 1–2 g of dried bulk sediment previously sieved at 63 µm. The carbonates present were dissolved with HCl (0.1 mol L–1) under agitation and then washed by centrifugation until a stable suspension was obtained. The clay fraction was placed on a glass slide and dried overnight at room temperature (Moore & Reynolds, Reference Moore and Reynolds1997).
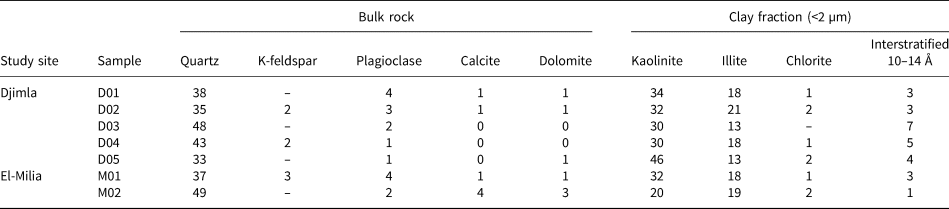
The XRD traces were obtained in three different preparations, namely air-dried (N run), after ethylene glycol solvation for 24 h (EG run) and after heating at 500°C for 4 h (H run). Qualitative identification of the clay species was based on the relative positions and intensities of specific reflections between the three XRD traces. Semi-quantitative estimation of clay minerals (Table 1) was based on the heights of specific reflections measured in general in the EG runs multiplied by correction factors (Fagel et al., Reference Fagel, Thamó-Bózsó and Heim2007) using DIFFRACPlus.EVA software.
Table 1. Bulk and clay mineralogy percentages of the studied clays.
Fourier-transform infrared (FTIR) spectra were obtained in diffuse reflectance mode using a FTIR-538 Nicolet Nexus spectrometer in transmission mode in the range 4000–400 cm–1 (Department of Geology, Laboratory of Mineralogy and Crystal Chemistry, University of Liège, Belgium), at a resolution of 4 cm–1, coupled to Omnic system acquisition and data processing. The pellets were prepared my admixing 2 mg of sample with 140 mg of KBr and pressing at 5 t cm–2.
The major element chemical composition of the bulk samples was determined by X-ray fluorescence (XRF) spectroscopy in fusion beads prepared with lithium tetraborate flux and analysed using a PANalytical PW4600 XRF spectrometer (Axios FAST). The loss on ignition (LOI) was evaluated from the weight difference between samples heated at 100°C and 1000°C.
Particle-size distribution was obtained by wet sieving of the ≥80 µm fraction and by settling the <80 µm fraction using Robinson's method in accordance with the French Standard NF P 94-056 (1996) and NF P 94-057 (1992). The silt- and clay-sized fractions (<80 µm) were dispersed in water with sodium hexametaphosphate followed by mechanical agitation. The evolution over time of the density of the solution and the immersion depth of the apparatus was measured by means of a hydrometer using Stokes’ law (Gee & Bauder, Reference Gee, Bauder and Klute1986).
The Casagrande method was used to determine the Atterberg limits of the samples (LCPC, 1987). The liquid limit (LL), plastic limit (PL) and plasticity index (PI; PI = LL – PL) were determined in accordance with the French Standard NF P 94-051 (1993). The densities of the powders were measured using the water pycnometer method according to the French Standard NF P 94-054 (1991).
Scanning electron microscopy (SEM) coupled with energy-dispersive X-ray spectroscopy was used to observe particle morphology using a Philips XL-30 environmental scanning electron microscope with a field emission gun equipped with backscattered and secondary electron detectors (Department of Chemistry, University of Liège, Belgium). For SEM analysis, the powdered samples were carbon-coated prior to analysis.
In order to evaluate the ceramic technological properties and industrial viability of the Numidian clay deposits, the clay samples were air-dried, ground in an agate mortar and sieved at 500 µm. The samples were then dried at 110°C for 24 h and humidified (7 mass% moisture content), mixed and sieved (1 mm) to obtain homogeneous agglomerates (ISO 13006, 1998). To simulate industrial pressing conditions, the powders were pressed uniaxially (25 MPa) to form 80 mm × 40 mm × 10 mm specimens using a laboratory hydraulic press. Firstly, the ceramic bodies were dried at 110°C to a constant mass. They were then fired in a Nabertherm electric furnace at temperatures of 800°C, 900°C, 1000°C and 1100°C (15°C min–1 heating rate and 30 min dwell time), approaching industrial conditions.
The linear firing shrinkage, water absorption, bulk density and bending strength values were determined in order to define the firing characteristics of the ceramic tiles produced. The linear firing shrinkage was evaluated using the following formula:
 $$\lpar {L_{\rm d}- L_{\rm f}} \rpar /L_{\rm d} \times {\rm} 100$$
where L d and L f are the measured lengths of the dried and fired specimens, respectively (ISO 10545-4, 2004).
The water absorption values, determined according to the standard ISO 10545-3 (1995), were calculated from the weight differences between the as-fired and water-saturated samples (immersed in boiling water for 2 h, cooled for 3 h and swept with a wet towel to remove excess water). Bulk density was obtained as the ratio of the mass of the fired specimen to the measured volume of the specimen (ISO 10545-3, 1995). The bending strength was measured with a three-point flexural method using a universal testing machine according to the norm standard ISO 10545-4 (2004) using the following equation:
 $${\rm \sigma} _{\rm f} = {\rm} 3FL/2bh^2$$
where F is the breaking load (N), L is the distance between supports (mm), b is the sample width (mm) and h is the sample thickness (mm).
Results
Mineralogical characterization
The XRD traces of the bulk clays and <2 µm clay fractions from sample D01 are shown in Fig. 2. The mineralogical compositions of the Numidian clay samples from the Djimla and El-Milia regions (Table 1) display significant differences in the type and relative abundance of the clay minerals present.
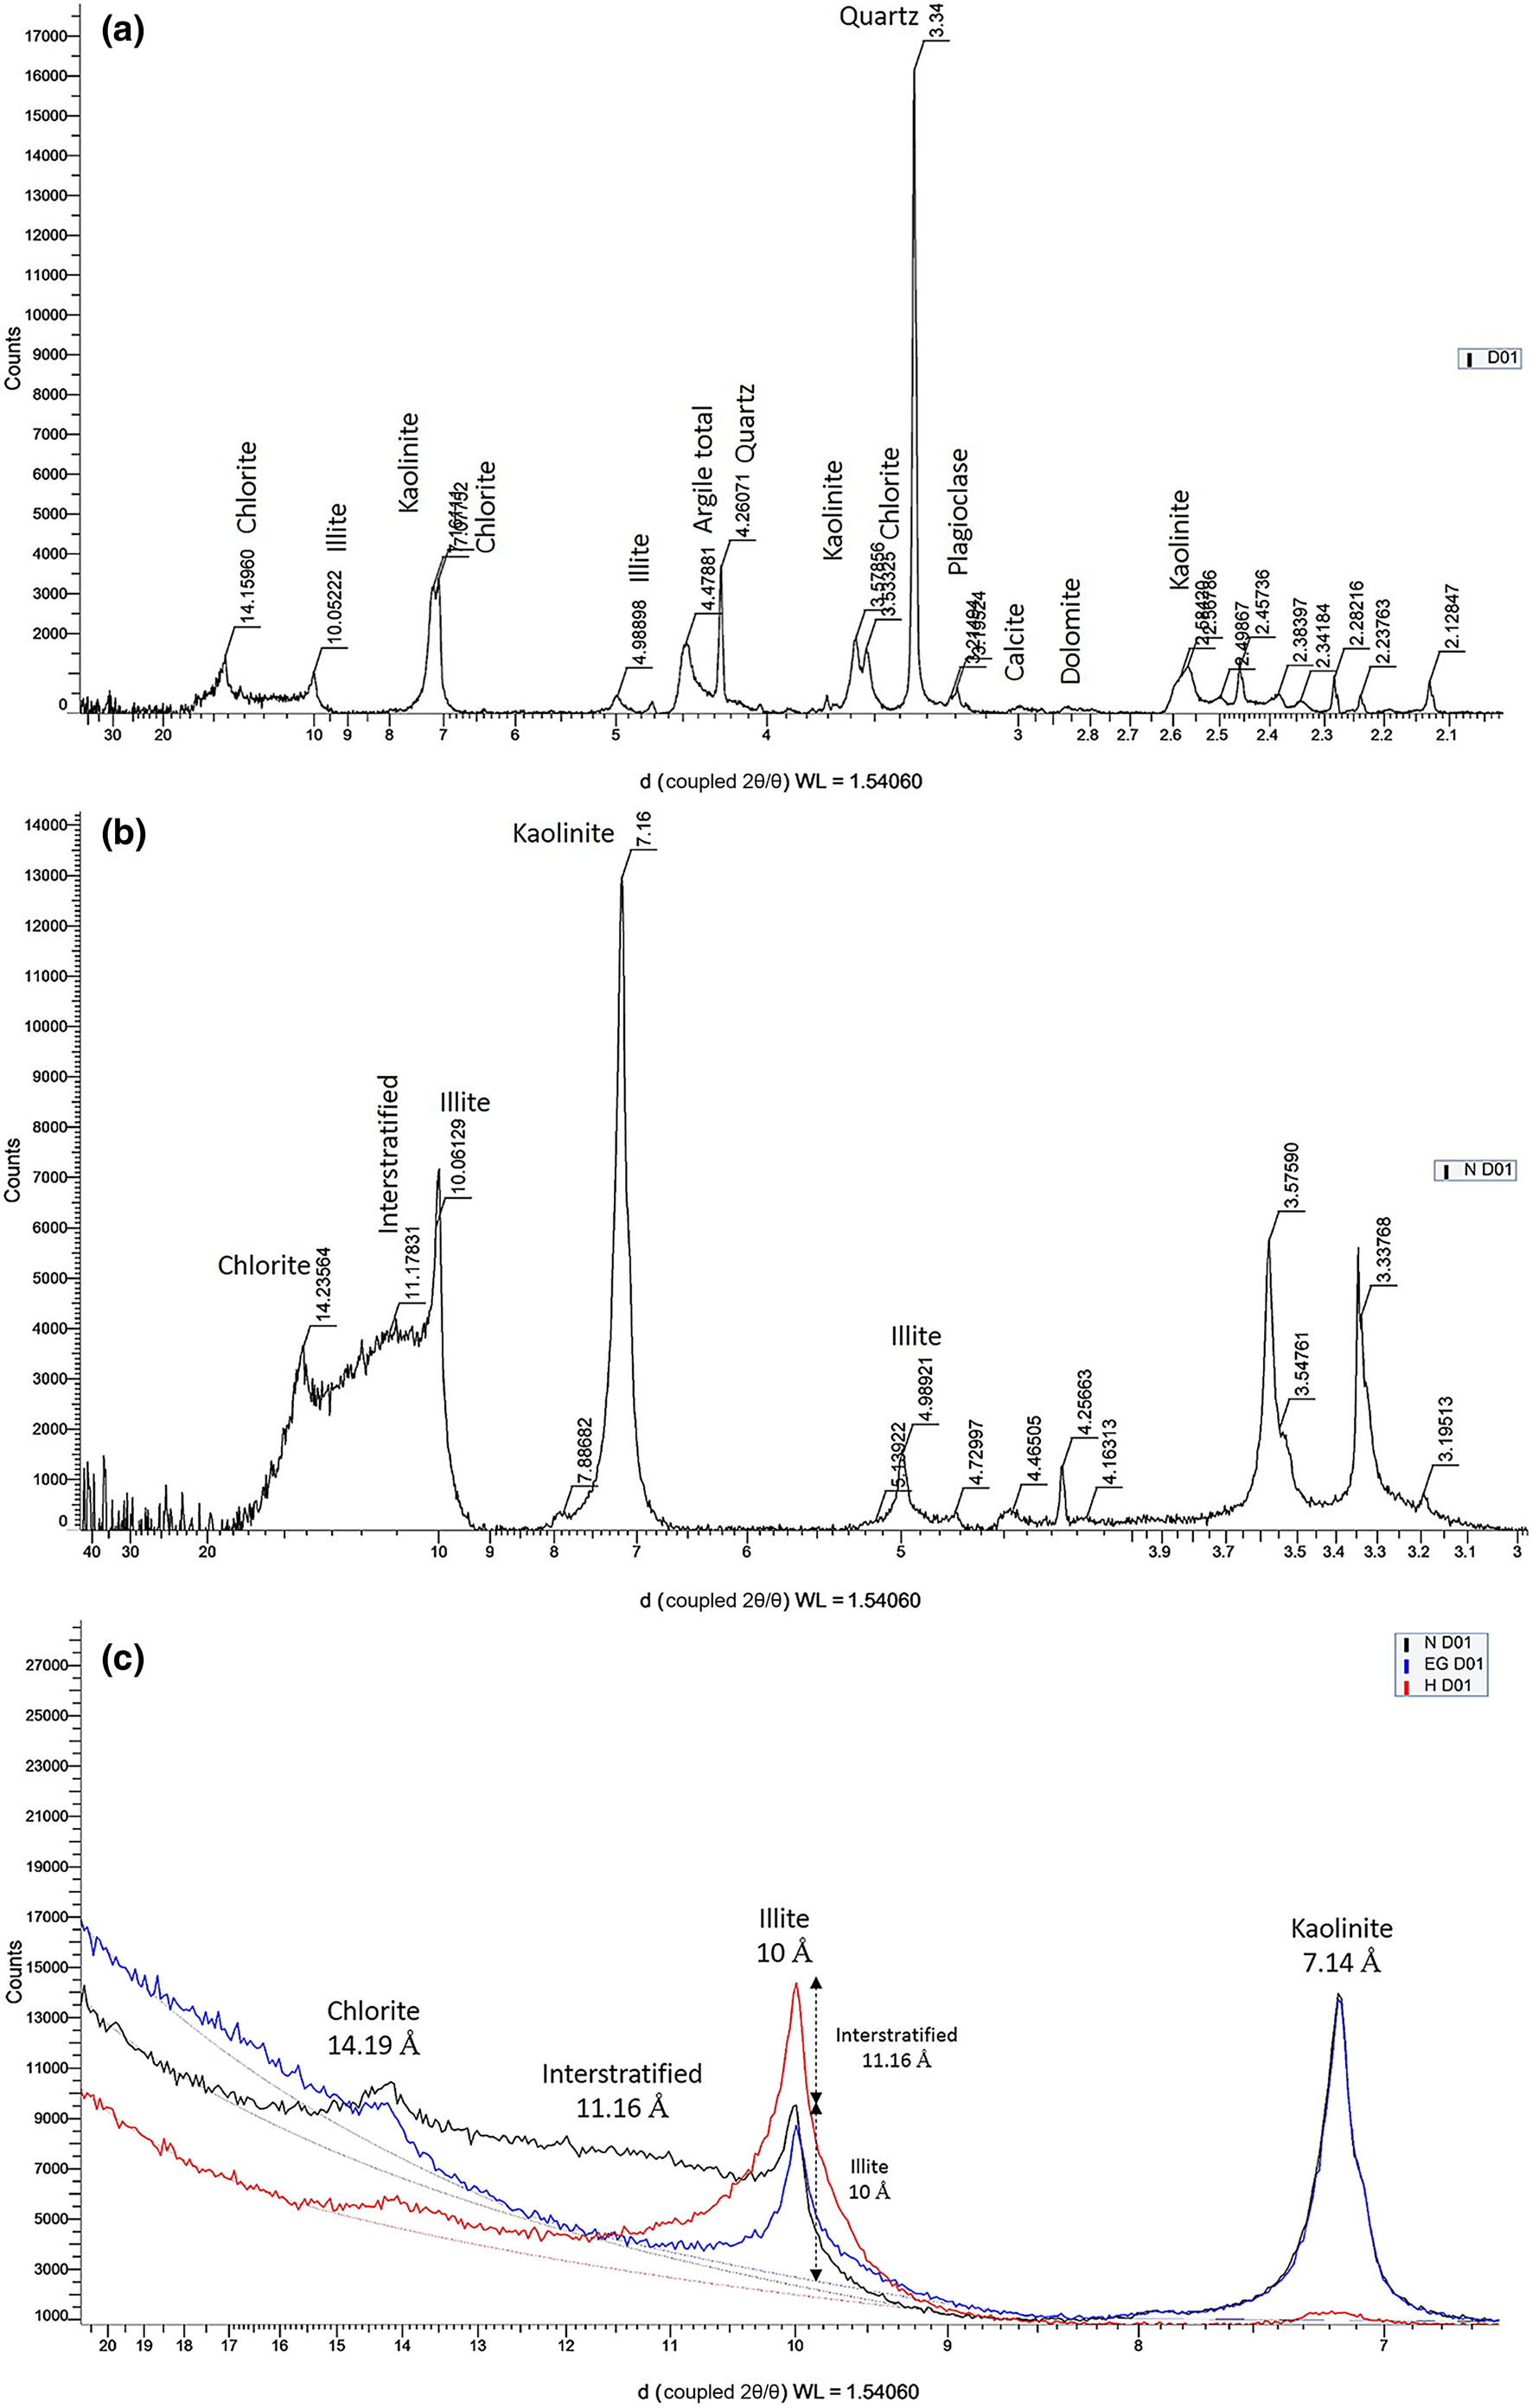
Fig. 2. XRD traces of (a) D01 bulk sample, (b) clay fraction and (c) clay fraction either (N) untreated, (EG) glycol-solvated or (H) heated. WL = wavelength of Cu-Kα1 (= 1.5406 Å) radiation.
Quartz, clay minerals, plagioclase and K-feldspar are the main constituents of the studied clay deposits associated with minor to trace amounts of calcite and dolomite (Fig. 2a). The <2 µm fractions of the clay samples are mainly composed of kaolinite (20–46%), illite (13–21%) and 10–14 Ǻ interstratified clay minerals (1–7%) with minor chlorite (up to 2%) (Table 2). Kaolinite and illite are present in most samples (Fig. 2b).
Table 2. Chemical composition of the clay samples (wt.%).

LOI = loss on ignition.
Figure 2c illustrates the XRD traces of the <2 µm fraction (untreated, EG solvated and heated at 500°C) of sample D01. The reflection (001) at 14.19 Å and the low-angle shoulder of the reflection (002) at 7.1 Å are attributed to chlorite. Their diffraction peaks (14.2, 7.1, 4.7, 3.5 and 2.8 Å) remain unchanged after EG solvation and 500°C heating treatments (Velde & Meunier, Reference Velde and Meunier2008).
The basal spacings at 10.0 and 7.16 Å were not displaced after EG solvation, confirming the presence of illite and kaolinite. The 7.16 Å diffraction peak disappears after firing at 550°C as expected, whereas the 10.01 Å peak is still observable. The reflection at 11.16 Å is assigned to a 10–14 Å interstratified clay mineral that seems to be present along with kaolinite and illite. The interstratified clay minerals occur in low amounts, therefore not allowing a positive identification of the interstratified type.
The FTIR spectra of the samples are shown in Fig. 3. The bands at 3697 and 3620 cm–1 confirm the presence of kaolinite and illite, respectively (Farmer, Reference Farmer and Farmer1974). The vibrations at ~3410 and ~1630 cm–1 are attributed to the H–O–H stretching and bending vibrations, respectively, of absorbed water, characteristic of hydrated phyllosilicates (Farmer, Reference Farmer2000), whereas the band at ~1441 cm–1 is characteristic of calcite.

Fig. 3. Infrared spectra of clay samples (a) D01 and (b) M01.
Quartz is confirmed by an intense band at ~795 cm–1, corresponding to the stretching vibration of Si–O. The band at ~469 cm–1 is attributed to the Si–O–Si bending vibrations, whereas the bands at ~534 and ~648 cm–1 originate from Si–O–Al vibrations (Al in octahedral coordination) (Madejová, Reference Madejová2003).
Chemical composition
The chemical composition of the samples (Table 2) is in good agreement with the mineralogical composition. The main components are SiO2 (53.8–56.5 wt.%), Al2O3 (20.3–21.7 wt.%) and Fe2O3 (6.6–9.1 wt.%), whereas K2O, CaO, MgO, Na2O, TiO2 and P2O5 are present in small quantities (<3% each). The predominant oxides (SiO2 and Al2O3) are mainly associated with illite, chlorite and kaolinite. The SiO2/Al2O3 mass ratio ranges from 2.49 to 2.72, which is greater than the value generally observed in pure kaolinite (SiO2/Al2O3: 1.18) and is partially related to the presence of quartz. The CaO content is relatively low in samples M02 and D01 (1.26–3.43 wt.%) and very low in samples D02, D03, D04, D05 and M01 (0.34–0.68 wt.%), which makes them suitable for ceramic products. CaO control is important because decarbonation is a strongly endothermic reaction that generates a large volume of gas, leading to expansion reactions (Cultrone et al., Reference Cultrone, Sebastian, Elerk, De la Torre, Cazalla and Rodriguez-Navarro2004).
The type of ceramic product obtained is also strongly related to the chemical composition of the raw material. During firing, the abundance of earth alkali oxides (CaO, MgO), alkali oxides (K2O, Na2O) and iron oxides (FeO, Fe2O) determines the firing temperature, the vitrification range and the texture of the fired clays (Konta, Reference Konta1980). The abundance of alkali oxides K2O + Na2O (2.54−3.41 wt.%) acting as fluxes suggests the presence of illite, plagioclase and K-feldspar (Fig. 3a,b & Table 2). The significant amount of K2O (2.29−3.18 wt.%) is due to the relatively large amount of illite. The small amount of alkali oxides in the clay samples is consistent with kaolinite-rich materials having a low flux content, and it explains the absence of a vitreous phase at low firing temperatures (Monteiro & Vieira, Reference Monteiro and Vieira2004).
All of the samples have a relatively high Fe2O3 content (6.56−9.11 wt.%) (Table 3). Besides its fluxing role, Fe2O3 provides a reddish colour to the fired products. Clays with Fe2O3 contents ≥5% would fire red (Murray, Reference Murray2007). However, Fe2O3 is not the only factor controlling the colouration of ceramic wares, because CaO, MgO, MnO and TiO may also significantly modify the colour of the fired clays (Kreimeyer, Reference Kreimeyer1987). The firing temperature, the amount of Al2O3 relative to other constituents and the furnace atmosphere all control the colour of the fired clay products (Fisher, Reference Fisher1984). The LOI varies from 7.93 to 9.62 wt.%, with the lower values attributed to the minor proportion of carbonates.
Table 3. Whole-rock, particle-size distributions, consistency limits (%) and densities of the studied samples.

PI = plasticity index.
Physical properties of the clays
The particle-size distribution is comparable for all clay raw materials and displays a wide range, from sand to clay sizes (Fig. 4a & Table 3). The <2 µm and 2–60 µm fractions are dominant (>69% in average). Five materials are classified as sandy silty clays and two samples as sandy clays.

Fig. 4. Ternary diagram classifications of the clay materials studied. (a) Particle-size distribution according to Shepard (Reference Shepard1954) with the sand-, silt- and clay-sized fractions based on the Wentworth (Reference Wentworth1922) scale. (b) Ternary diagram after Winkler (Reference Winkler1954). (c) Holtz and Kovacs diagram. (d) Workability chart after Casagrande (Reference Casagrande1948).
The percentage of the clay particles (<2 µm fraction) ranges from 42 to 49%. The particle-size distribution of clay plays an essential role in defining the properties of green pastes and suspensions (plasticity, viscosity) during drying and firing (Rivi & Ries, Reference Rivi and Ries1997). The silt fraction (2–60 µm) ranges from 14 to 29% and the sand fraction (>60 µm) ranges from 25 to 37%. However, crushing and sifting may reduce the coarse particle content (>50 µm) to produce better ceramics (Mahmoudi et al., Reference Mahmoudi, Srasra and Zargouni2008). These raw materials might be classified as very heavy sandy clays. The large amount of sand in them might cause several difficulties such as laminations, cracks and high shrinkage in green and firing products (Reeves et al., Reference Reeves, Sims and Cripps2006).
The density of the solid particles varied between 2.64 and 2.67 t m–3 (Table 3). As the raw materials are kaolinitic–illitic clays, their densities are compatible with those generally observed (2.40–2.74 t m–3) in kaolinitic–illitic-type materials (Boussen et al., Reference Boussen, Sghaier, Chaabani, Jamoussi and Bennour2016; Baghdad et al., Reference Baghdad, Bouazi, Bouftouha, Bouabsa and Fagel2017).
The grain-size data for >20 µm, 2–20 µm and <2 µm fractions (Fig. 4b) were used to evaluate the suitability of the samples for various ceramic products (Winkler, Reference Winkler1954). The Djimla and El-Milia clay samples are suitable for roofing tiles and masonry bricks. Most samples have relatively high silt contents and require pre-treatment for the production of structural ceramics.
The results of the Atterberg limits (Table 3) were plotted in plasticity diagrams (Casagrande, Reference Casagrande1948; Holtz & Kovacs, Reference Holtz and Kovacs1981) (Fig. 4c,d). The LL of the clay samples varies between 42 and 57%, the PL varies between 21 and 27% and the PI varies between 19 and 30%. Except for samples D01 and D02, which plot in the highly plastic region, all of the clay-rich materials may be considered of moderate plasticity, which is an advantage for the ceramics industry. All of the Djimla and El-Milia clays plot within the illitic clay region.
The PL corresponds to the amount of water necessary for the clayey material to reach a plastic consistency, which makes it possible for it to be formed by extrusion. Among the investigated clayey materials, only samples M01 and M02 are located inside the optimal extrusion region (Fig. 4d). The remaining samples (D01, D02, D03, D04 and D05) have acceptable extrusion properties.
For practical purposes, the PI should exceed 10% (Abajo, Reference Abajo2000). According to the clay workability chart (Fig. 4d), the samples might be used in pottery and bricks (Table 3).
Morphological characterization
The SEM images of samples M01 and D01 (Fig. 5) show that the Numidian clays are mainly composed of thin, partially broken subhedral platelets of kaolinite with a face-to-face association, rounded in places and 1–5 µm in size (Fig. 5a,b). Pseudo-hexagonal kaolinite stacks and plates were observed along with less frequent rolled and rough-edged particles. In sample D01, the kaolinite is rounded in shape, <3 µm in size and dispersed in a quartz matrix (Fig. 5c).
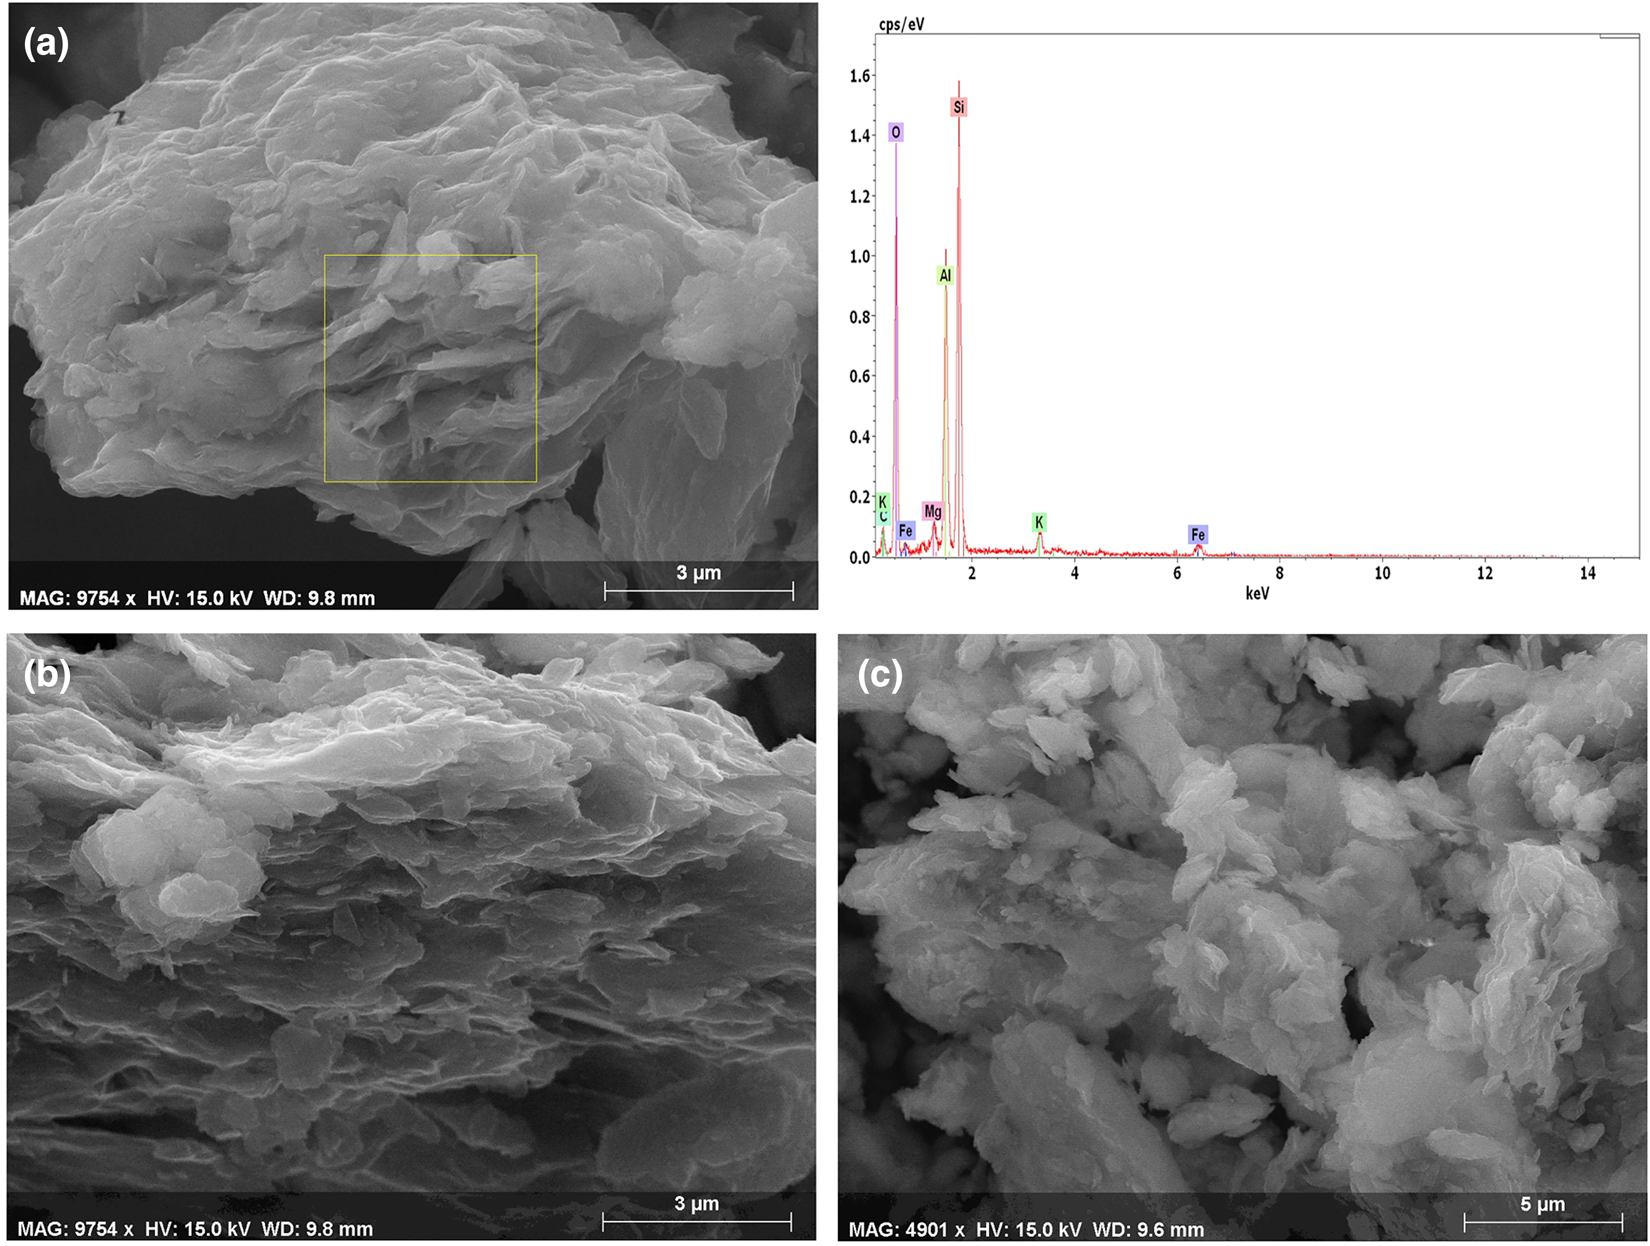
Fig. 5. SEM images of the raw materials from (a,b) sample M01 and (c) sample D01 coupled with an energy-dispersive X-ray spectrum of various phases.
Firing properties
Technological properties
According to their mineralogical, chemical and physical characteristics, the Numidian raw clay materials (from the Djimla and El-Milia regions) have potential for ceramics applications. Seven representative samples potentially suitable for ceramics were used to determine the firing and technological properties. The bulk density, water absorption, firing shrinkage, weight LOI and bending strength values of the fired clays over the temperature range of 800–1100°C are shown in Fig. 6. All seven clay samples have almost the same drying shrinkage properties. In the drying step, it is sufficient to obtain a drying shrinkage value of 0–0.5% l/l to avoid microcracks around sand grains (Baccour et al., Reference Baccour, Medhioub, Jamoussi, Mhiri and Daoud2008).
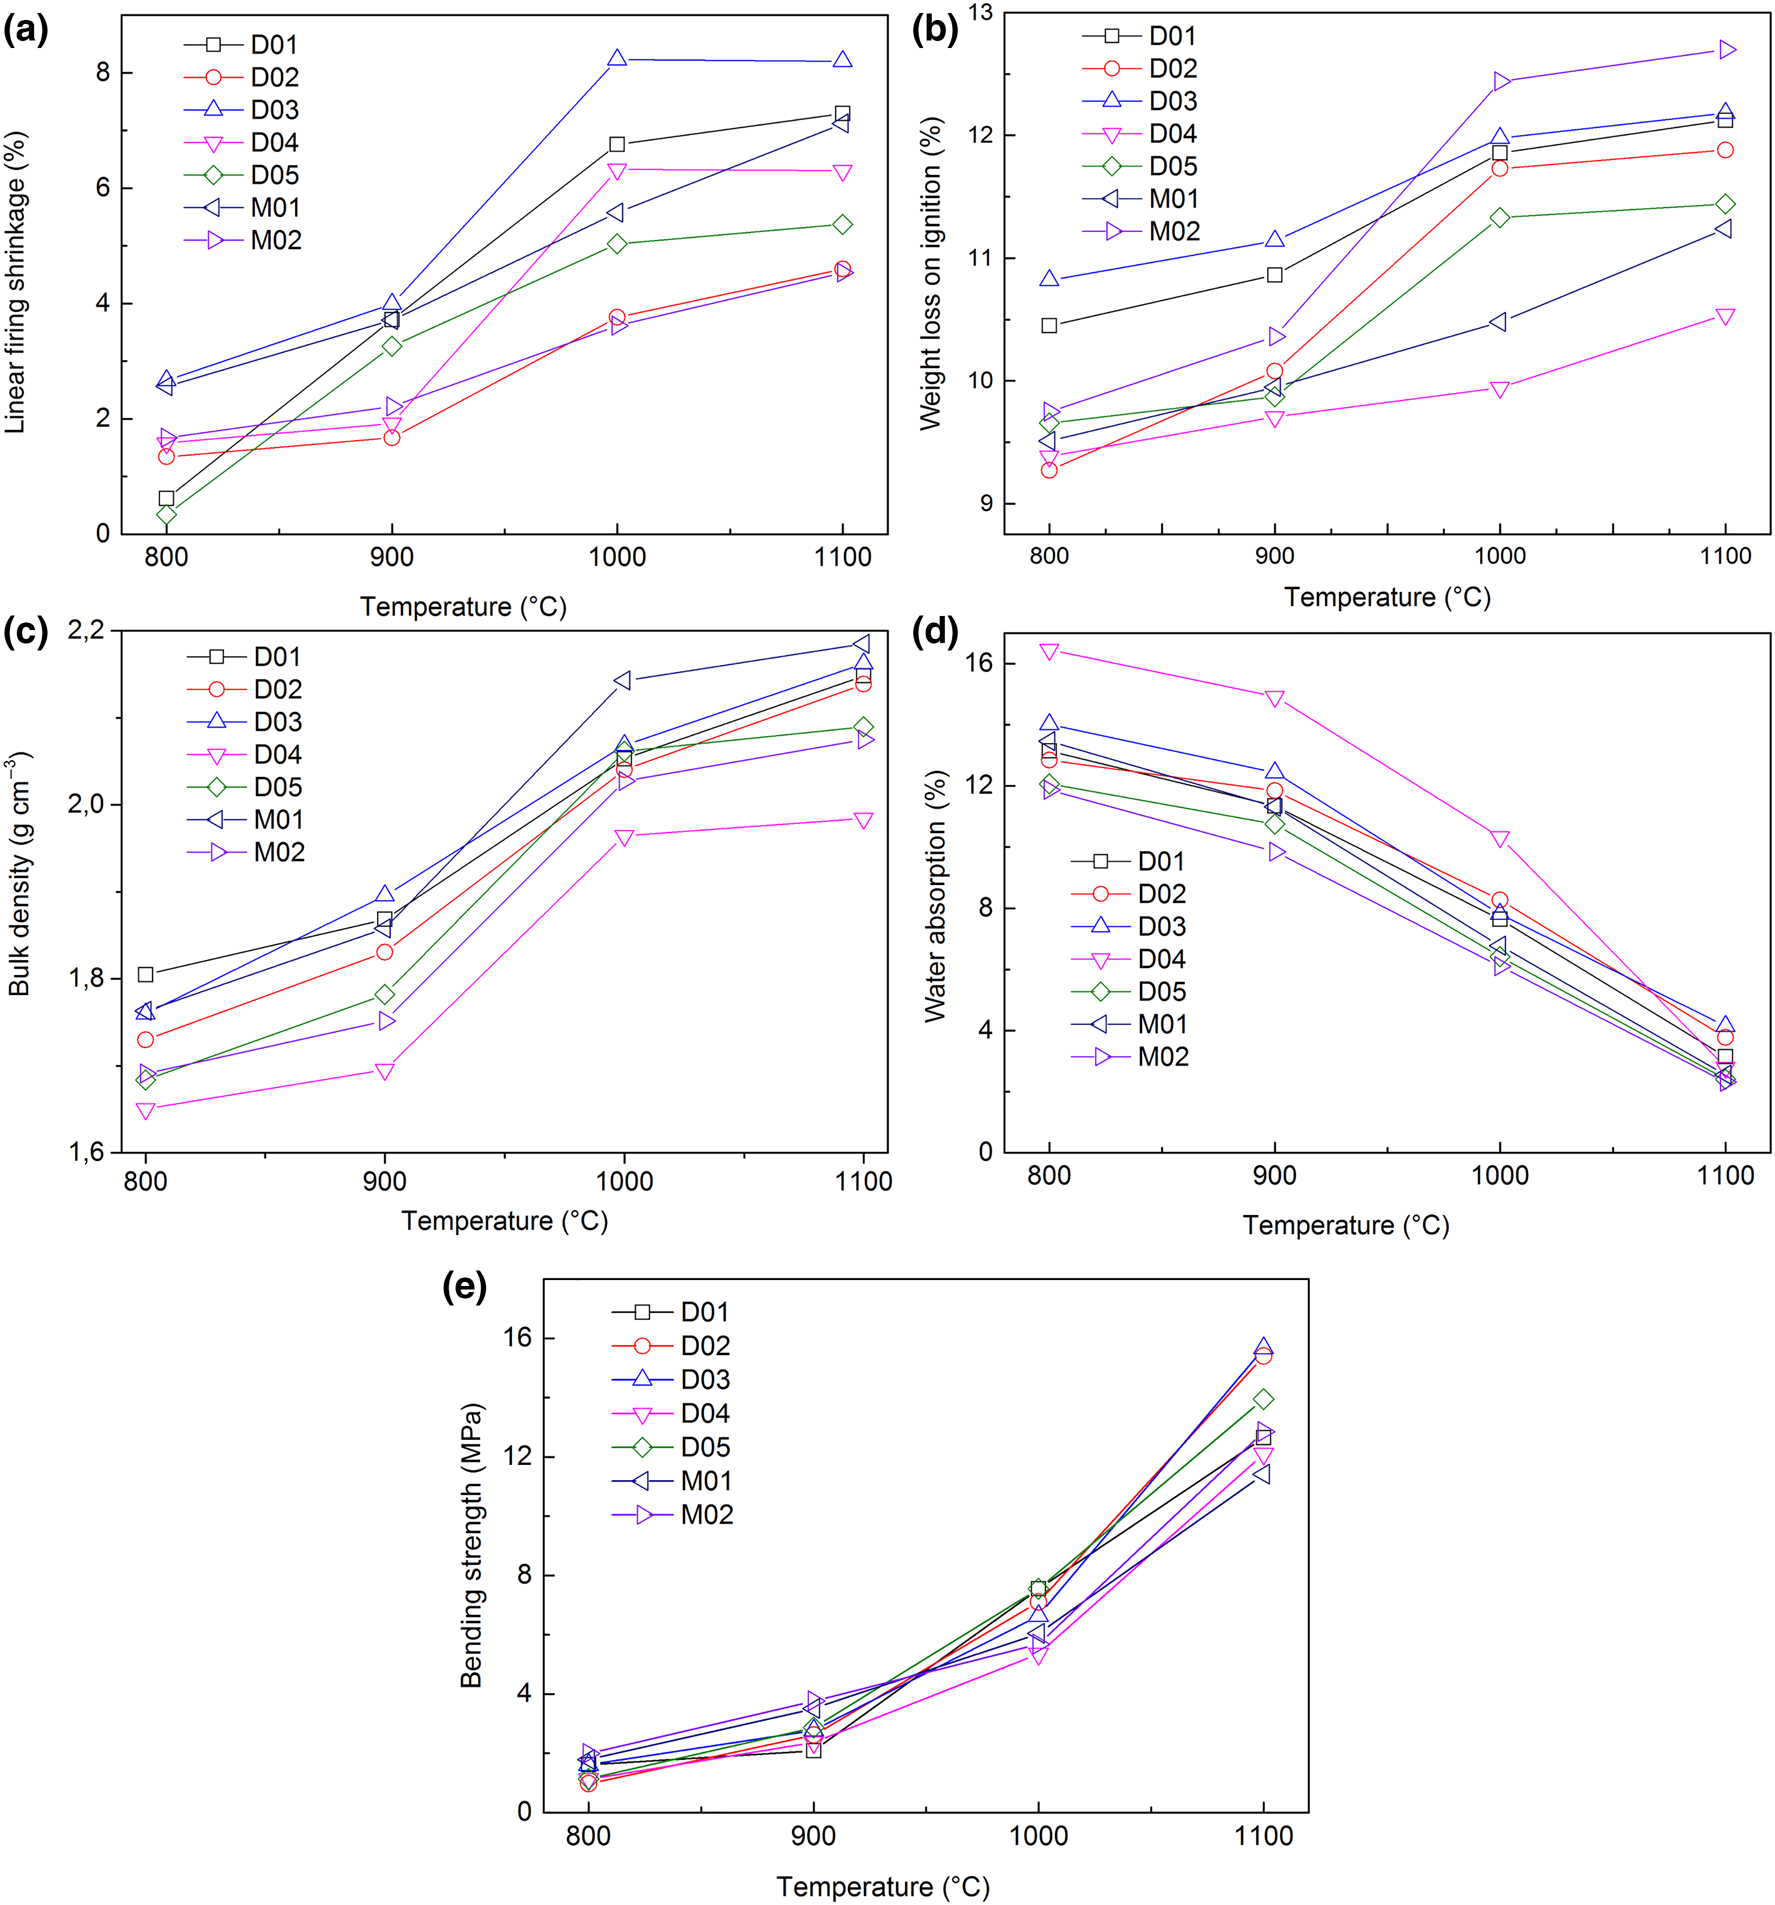
Fig. 6. Variation of technological properties with temperature. (a) Linear firing shrinkage, (b) weight loss on ignition, (c) bulk density, (d) water absorption and (e) bending strength.
The variation in bulk density of the fired clays in relation to the firing temperatures is shown in Fig. 6c. Overall, the bulk density shows low values that increase with temperature, and the most significant changes are observed between 900°C and 1000°C. The density of sample M01 clay increased significantly over this temperature range, probably due to the formation of a glassy phase as it contains abundant fluxing agents (Ngun et al., Reference Ngun, Hasmaliza, Shamsul, Kiyoshi and Zainal2011). The density of all series is ~1.69 and ~2.14 g t m–3 at the firing temperatures of 900°C and 1000°C, respectively, whereas the densities of samples M01, D03, D01 and D02 at 1100°C are 2.18, 2.16, 2.14 and 2.13 t m−3, respectively.
Linear firing shrinkage, water absorption and bending-strength values have frequently been used as quality and process control parameters in the development and manufacturing stages of the production of structural ceramics such as floor and wall tiles (Correia et al., Reference Correia, Curto, Hotza and Segadães2004a, Reference Correia, Hotza and Segadães2004b). The linear firing shrinkage is generally low and increases gradually with firing temperature (Fig. 6a). Hence, at 900°C, the linear firing shrinkage values are 1.4%, 0.5% and 1.3% for D01, D03 and D04, respectively, and at 1000°C, the linear firing shrinkage values increase to 6.7%, 8.2% and 6.3%, respectively. Finally, at 1100°C, the linear firing shrinkage values increase slightly or stabilize to 7.3%, 8.2% and 6.3%, respectively. The evolution of the linear firing shrinkage at >900°C is related to the formation of a liquid phase. The liquid surface tension during liquid-phase formation helps to bring particles closer together and reduces porosity (Monteiro & Vieira, Reference Monteiro and Vieira2004). The linear firing shrinkage values range between 7% and 10% for aluminium-silicates, kaolin and fired clays (Manukaji John, Reference Manukaji John2013).
The water absorption decreases sharply at >900°C (Fig. 6d). Sample D04 shows the greatest water absorption (16.5% at 800°C and 10.3% at 1000°C). Samples D05, M02 and M01 show low water absorption (2.4% on average) at 1100°C. This decrease is associated with glassy-phase formation that reduces porosity (Bennour et al., Reference Bennour, Mahmoudi, Srasra, Boussen and Htira2015; Fadil-Djenabou et al., Reference Fadil-Djenabou, Ndjigui and Mbey2015; Semiz, Reference Semiz2017).
The water absorption defines the class of ceramic tile products (ISO 13006, 1998), which are divided into three groups: group I with low water absorption (≤3%); group II with moderate water absorption (3–10%); and group III with high water absorption (>10%). The ceramics in the present study belong to classes BIb and BIIa. When the ceramics display low to moderate water absorption, the durability and strength are increased.
The variation in the bending-strength values of the clays as a function of firing temperature (Fig. 6e) is consistent with other properties. A moderate mechanical strength of the clays is observed at firing temperatures of <900°C, and it increases sharply at firing temperatures of >1000°C. The strength increase with increasing temperature is explained by the formation of a glassy phase and the reduction of porosity (Milheiro et al., Reference Milheiro, Freire, Silva and Holanda2005). At the sintering temperature of 1100°C, samples D02, D03, D05 and M02 reach average bending strengths of >15, >16, >14 and >13 MPa, which are significantly greater than those at 1000°C. The greatest bending strength at 1100°C is associated with the lowest water absorption and greatest bulk density (Fig. 6c,d,e).
The LOI of the ceramic tiles increases with firing temperature (Fig. 6b). The maximum weight loss is recorded at a temperature of <900°C. This parameter varies slightly between 900°C and 1100°C, which precludes the notion that the volatile components contributing to the LOI had been removed or decomposed at <900°C (Abd El Aal, Reference Abd El Aal2015; Bennour et al., Reference Bennour, Mahmoudi, Srasra, Boussen and Htira2015; Fadil-Djenabou et al., Reference Fadil-Djenabou, Ndjigui and Mbey2015). The LOI ranges from 10.5% to 12.7% (Fig. 6b). There are no differences between the studied samples. For a standard clay brick (AASHTO T99, 1982), the weight loss should not exceed 15%, and most of the ceramic tiles made for this study meet this criterion.
The colour of ceramic wares may be significantly modified due to the presence of Fe2O3, as well as CaO, MgO, MnO and TiO2 (Kreimeyer, Reference Kreimeyer1987). Previous studies related clay quality to chemical composition (Fabbri & Fiori, Reference Fabbri and Fiori1985).
At 1100°C, the ceramic tiles made from samples D03 and M01 have a red brick colour (Fig. 7) due to the presence of a high percentage of Fe2O3 (9.11% and 8.09%, respectively) (Table 2). These observations are consistent with the assumption of Murray (Reference Murray2007) that red-firing clays contain at least 5% Fe2O3. Because of the high iron content, the clays are not suitable for the production of fine ceramics, but they might be considered as raw materials for structural ceramics products (Konta, Reference Konta1995).

Fig. 7. Colours of the experimental ceramic tiles fired at various temperatures ranging from 800°C to 1100°C.
Study of the thermal behaviour by XRD
The mineralogical transformations during firing were analysed by XRD and the XRD traces of sample M01 clay after heating at 800°C, 900°C, 1000°C and 1100°C for 3 h are shown in Fig. 8. At 800°C, the kaolinite (7.16 Å), which was initially present in all of the samples, was transformed into metakaolinite during dehydroxylation at >450°C (Baccour et al., Reference Baccour, Medhioub, Jamoussi, Mhiri and Daoud2008). In contrast, plagioclase (3.19 Å) melts gradually, and K-feldspar (3.24 Å) persists with increasing temperature (Aras & Kiliç, Reference Aras and Kiliç2017). Quartz (3.34 Å), illite (10.1 Å) and total clays (4.47 Å) are preserved (Fig. 8).

Fig. 8. XRD traces of ceramic bodies (sample M01) fired at various temperatures. Q = quartz; Dol = dolomite; Cal = calcite; Kfs = K-feldspar; Pl = plagioclase; T-Clay = total clay; Ch = chlorite; Kaol = kaolinite; I = illite; Di = diopside; Gh = gehlenite; Sp = spinel; Hem = hematite; Cr = cristobalite; Mu = mullite.
Between 800°C and 900°C, illite and the total clay content decrease gradually and disappear completely at >900°C. Calcite and dolomite decompose into CaO and MgO, releasing CO2 that eventually escapes from the fired specimen. The first mineral to form is hematite (2.67 Å; Fe2O3), which appears at 900°C, and the maximum abundance is observed at 1100°C. Hematite results from the iron released during the decomposition of chlorite and illite (El Ouahabi et al., Reference El Ouahabi, Daoudi, Hatert and Fagel2015).
Gehlenite and spinel are the first newly formed minerals identified at 1000°C (Fig. 8), and their abundance increases at 1100°C. The gehlenite (2.85 Å; Ca2Al2Si2O7) and the spinel (2.42 Å; MgAl2O7) result from multistage solid-state reactions between the clay matrix and calcite. Gehlenite is formed by reaction between calcium oxide (CaO) and metakaolinite (Peters & Iberg, Reference Peters and Iberg1978; Dondi et al., Reference Dondi, Ercolani, Fabbri and Marsigli1996). The spinel phase results from the excess Al2O3 due to the decomposition of clay minerals and K-feldspar. If MgO derived from the dehydroxylation of chlorite and dolomite is present in sufficient amounts, the spinel will be formed by the following reaction: MgO + Al2O3 → MgAl2O4.
Mullite, cristobalite and diopside are the last phases to form at temperatures near 1100°C (Fig. 8). Metakaolinite decomposes into spinel and an amorphous phase by firing (Brindley & Nakahira, Reference Brindley and Nakahira1959; Okada et al., Reference Okada and Otsuka1986; Dondi et al., Reference Dondi, Guarini and Raimondo1999), which reacts to form mullite. At >1100°C, the amount of residual quartz decreases due to its dissolution and conversion into cristobalite (Benhammou et al., Reference Benhammou, Tanouti, Nibou, Yaacoubi and Bonnet2009; Celik, Reference Celik2010). Cristobalite appears in the firing products of clays with large amounts of quartz. Diopside (CaMgSi2O6) probably forms from the reaction of Ca, Mg and SiO2 at high temperatures. The Ca is probably supplied by calcite and Mg by chlorite and dolomite; its formation is marked mainly by a sharp decrease in quartz content.
In conclusion, with the exception of quartz and K-feldspar, which persist up to 1100°C, with increased firing, illite, kaolinite, chlorite, calcite and plagioclase decompose gradually and new high-temperature phases, namely hematite, gehlenite, diopside, mullite and spinel, are formed.
Discussion
The clay samples consisted mainly of SiO2 and Al2O3 because of the presence of clay minerals (kaolinite and illite) and quartz, accompanied by a significant amount of iron oxide (8% on average, although this is acceptable for use in ceramics), which is responsible for the typical brick-red colour of the fired specimens.
Quartz facilitated the drying step by reducing the drying shrinkage and the risk of crack formation. The amount of quartz, which exceeds 40 wt.% in all of the samples, explains the absence of defects due to drying in the unfired ceramic bodies. Quartz also contributes to the formation of glassy phases during the sintering step, wherein mullite would crystallize; the glass phase formed reduces the porosity of the sintered samples. As a result, the mechanical strength was improved (Monteiro & Vieira, Reference Monteiro and Vieira2004; Lee & Yeh, Reference Lee and Yeh2008; Baccour et al., Reference Baccour, Medhioub, Jamoussi and Mhiri2009; Daoudi et al., Reference Daoudi, Elboudour Elidrissi, Saadi, Albizane, Bennazha, Waqif, El Ouahabi and Fagel2014).
All of the clays showed moderate plasticity with PI values ranging between 19% and 30%. This parameter is important for technological applications, as it indicates the amount of water necessary for a clay to become plastic. The differences in the plasticity of the samples might be explained by the particle-size distribution data (Table 3), i.e. the greater clay fraction contents in samples D01, D02 and D03 imparts high plasticity to those samples compared to samples M01 and M02 with lower clay fraction contents.
The ceramic behaviour of Numidian clays (from the Djimla and El-Milia regions) was interpreted according to bulk density, weight LOI, linear firing shrinkage, water absorption and flexural strength. All of these properties show only moderate changes in fired properties from 800°C to 900°C. However, at >900°C, significant changes were observed, including increases in the bulk density, linear firing shrinkage, and flexural strength and a decrease in water absorption. This tendency was clearly observed from 1000°C.
At >900°C, water absorption decreased (Fig. 6d) and the amount of the liquid phase increased. This phase penetrates into the pores, closing them and isolating neighbouring pores. The liquid surface tension and capillarity help to bring pores closer together and to reduce porosity. This explains the significant decrease in water absorption in this temperature range (Baccour et al., Reference Baccour, Medhioub, Jamoussi and Mhiri2009).
The temperature increased the bending strength due to densification (Fig. 6e). The liquid phase reduces porosity, which reduces crack formation and improves mechanical strength. The densification of the fired clays was influenced by fluxing agents such as K2O, Na2O and Fe2O3, which favour the formation of a vitreous phase (vitrification) and, as a result, improved the resistance of the fired samples. The densification was also caused by the formation of mullite and spinel (Fig. 8), which replaced porous metakaolinite at elevated temperatures.
The dry pressing process of clays (with a low water content) appeared to be the best approach to preventing excessive shrinkage during firing (Carretero et al., Reference Carretero2002). The pressure (25 MPa) used to form the specimens and the low water content (<7%) merged the fine clay particles together and solidified the raw product. The low linear firing shrinkage of the samples dried at 50°C and fired at 800°C is advantageous for the manufacturing of traditional ceramics and structural ceramics such as bricks and tiles because it reduces cracking and volume changes during firing. The vitrification of the Numidian clays occurred at >1000°C; therefore, the addition of fluxing agents could facilitate their wider use.
Summary and conclusions
The Numidian clays from northeast Algeria (Djimla and El-Milia regions) have sufficient plasticity to form clay bodies by pressing. The clays consist mainly of clay minerals and minor albite, K-feldspar, calcite and dolomite. Kaolinite (20–46%) and illite (13–21%) are the main clay minerals in the raw materials. The clays are poor in CaO (0.34–3.43%) and contain a small amount of alkali oxides (2.54–3.41%). After firing, significant increases in the bulk density, linear firing shrinkage and bending strength and decreases in water absorption are observed at >1000°C. The relationship between these properties was examined in order to enhance the quality of the final products and to optimize the production process.
Remarkable mineralogical transformations took place during firing, which led to the appearance of new phases, namely mullite, cristobalite, gehlenite, diopside, hematite and spinel. Sintering occurred, leading to the improvement of the ceramic properties.
The results obtained during this study have led us to envisage new research programmes in the Djimla and El-Milia regions focused on testing these and other raw materials on a semi-industrial scale and assessing the possibility of using them as raw materials in the local ceramics industry.


