During drilling operations, shale hydration and the resulting well-bore instability problems, including hole collapses, tight holes, stuck pipes, poor hole cleaning, hole enlargement and plastic flow, may lead to the loss of US$ billions per year, worldwide (Zeynali, Reference Zeynali2012; Zhang et al., Reference Zhang, Sheng and Qiu2016). Water adsorption on cations and swelling clay minerals in shales are the main cause, as they may contribute to swelling of the rock and may cause severe structural damage and fracturing (Heidug & Wong, Reference Heidug and Wong1996; Zhang et al., Reference Zhang, Sheng and Qiu2016). Smectite is a well-known contributing factor to the majority of the reported stability problems, due to its large surface area, negative surface charge, and ability to swell in the presence of water (Mao et al., Reference Mao, Guo, Wang and Yang2010). Na+ and Ca2+ are among the most common interlayer cations of smectite. In Na-smectite, two- and three-layer cation hydrates may form with the bilayer water adsorption on the external surface at high water-vapour pressure (Cases et al., Reference Cases, Bébrend, Besson, François, Uriot, Thomas and Poirier1992). The osmotic swelling of the smectite from the two-layer hydration state is an isoenthalpic process. The hydration of Na+ is the main contribution to the overall hydration of Na-smectite (Salles et al., Reference Salles, Bildstein, Douillard, Jullien and Van Damme2007). In Ca-smectite, the two-layer hydrate forms at high water-vapour pressure (Cases et al., Reference Cases, Bébrend, François, Uriot, Michot and Thomas1997).
Among the compounds used to reduce shale hydration (Burchill et al., Reference Burchill, Hall, Harrison, Hayes, Langford, Livingston, Smedley, Ross and Tuck1983; Caenn and Chillingar, Reference Caenn and Chillingar1996; Nelson and Cosgrove, Reference Nelson and Cosgrove2005; Rosa et al., Reference Rosa, Rosa, Farias, Garcia and Coelho2005; Souza et al., Reference Souza, Lima and Nascimento2010), potassium chloride and poly alcohol are the conventionally used agents; the use of polyether amine compounds with small molecular masses are a recent advance (Qu et al., Reference Qu, Lai, Zou and Su2009; Cui and Van Jeroen, Reference Cui and Van Jeroen2010; Wang et al., Reference Wang, Liu, Wang and Sun2011; Zhong et al., Reference Zhong, Qiu, Huang and Cao2011; Zhang et al., Reference Zhang, Qiu and Huang2015, Reference Zhang, Sheng and Qiu2016). To determine the optimal solutions, two shale samples with different exchangeable cations (Na+ and Ca2+) were studied, by means of K+, PO and PA adsorption isotherms tests, analysis of shale and shale composites XRD, oedometer swelling tests, and by examination of imaging of the shale core after immersion.
EXPERIMENTAL
Shale characterization
The mineralogical composition of the shale sample was determined by XRD using an X'Pert-Pro MPD diffractometer (PANalytical B.V.; Netherlands) with Cu-Kα radiation, equipped with a solid-state detector, operating at 40 kV and 40 mA, according to SY/T 5163 (1995), SY/T 5983 (1995) and SY/T 6210 (1996). The exchangeable cations in the shale were replaced by Ba2+ (Jiang & Zhang, Reference Jiang and Zhang2005) and the ion species and content were measured using an Agilent ICP-720ES inductively coupled plasma atomic emission spectrometer (ICP-720ES, Agilent Technologies Corporation, USA).
Quartz is the dominant phase, with the total clay fraction being 36% and 21% in the H and T shale samples, respectively (Table 1). Illite and mixed-layer illite-smectite (I-S) clay are the main clay phases in both shale samples with chlorite and kaolinite being minor phases. The total exchangeable cations content is 20.20 and 2.89 mmol/100 g shale, for the H and the T shales, respectively. Na+ is the main exchangeable cation in H shale while Ca2+ is the exchangeable cation in T shale. It is inferred that the H shale contains abundant Na-smectite while T shale contains mainly Ca-smectite.
Table 1. Mineralogical and exchangeable cation composition of H and T shales.
The shale samples were ground, sieved, washed and dispersed in water to form 40 g/L aqueous suspensions. The solid content was measured after drying at 100°C until constant weight was achieved.
Chemicals
The PA used in this study was developed by the drilling fluid research team at the China University of Petroleum (Zhong et al., Reference Zhong, Qiu, Huang and Cao2011; Zhang et al., Reference Zhang, Sheng and Qiu2016). The PA molar mass was ~400 g/mol and its typical chemical formula was CH3-[OCH2CH2]x-[OCH2(CH3)CH]y-NH2. PO has a typical formula HO-[OCH2CH2]x-. [OCH2 (CH3) CH]y-OH, was provided by Shengli Drilling Institute of Sinopec Corporation, China. The PO molar mass was ~1000 g/mol. Analytically pure KCl was purchased from Sinapharm Chemical Reagent Co. Ltd.
Experimental
Adsorption isotherms of PA, PO, K+ on shale sample and released ion measurement
Aqueous PA, PO and KCl stock aqueous solutions were prepared and mixed with the shale sample stock suspension to form 1wt.% shale suspensions with various concentrations of PA, PO or KCl. The procedure to determine the amount of PA, PO and K+ adsorbed on shale from solutions of various concentrations and the cations released during adsorption was reported by Zhang et al. (Reference Zhang, Qiu and Huang2015). The carbon content in the dried shale-PA composite was analysed using a Euro EA3000 elemental analyzer (Euro Vector S.P.A.; Italy). The contents of K+ and the cations released from the shale to the supernatant was determined by ICP-OES.
XRD analysis
The shale and shale-PA (PO or K+) composite solutions were centrifuged using a 5000×g centrifugal force for 30 min and washed twice with deionized water. Then they were mounted evenly on glass slides and subsequently placed in desiccators with a saturated K2SO4 solution at ~98% relative humidity (RH) for one month. X-ray diffraction analysis was used to determine the d 001 spacing of smectite in both the shale and shale composite. The same samples were subsequently placed in desiccators with silica gel at ~0% RH for one month and XRD analysis was conducted to record the d 001 spacing of smectite.
Shale oedometer swelling tests
Swelling tests were carried out in a fixed-ring oedometer, according to ASTM D 4546, Method B (1996). The specimens were allowed to swell when immersed in the PA, PO or KCl solution. The vertical displacement at different times was measured using a digital dial gauge. Digital photographs of the shale were also taken after immersion in the solutions.
RESULTS AND DISCUSSION
PA,K+ adsorption on H and T shale samples
The H shale absorbed more PA than the T shale (Fig. 1). The rate of adsorption of PA on H shale and that of release of Na+ cations were high at low PA concentrations, decreasing at high concentrations. Because the T shale is poor in Na+ ions, only small amounts of PA may adsorb on shale by exchanging Na+. Moreover, K+, Ca2+ and Mg2+ were not detected in solution in either the H or the T shale, indicating that no K+, Ca2+ and Mg2+ were exchanged by PA. The main mechanisms for PA adsorption include ion exchange and adsorption on the clay layer (Greenwell et al., Reference Greenwell, Harvey, Boulet, Bowden, Coveney and Whiting2005; Cui & Van Jeroen, Reference Cui and Van Jeroen2010). It is suggested that both ion exchange and clay-layer adsorption contributed to the adsorption of PA on H shale, whereas adsorption on the clay layer was the main mechanism for PA adsorption on T shale.
Fig. 1. Adsorption of PA on H and T shale (PA-H, PA-T); adsorption of PO on H and T shale (PO-H, PO-T); adsorption of K+ on H and T shale (K-H, K-T); adsorption of PA on H or T shale in mixed solution of PA and 1 mol/L KCl (K-PA-H, K-PA-T); adsorption of PO on H or T shale in mixed solution of PO and 1 mol/L KCl (K-PO-H, K-PO-T).
The rate of adsorption of PO was high at low PO concentrations, reaching a plateau at high PO concentrations in both shales (Fig. 1). The adsorption isotherm showed a monolayer adsorption in the T shale, and multilayer adsorption in the H shale (Zhao, Reference Zhao2005). No cations were exchanged during PO adsorption in either H shale or T shale (Fig. 2). Previous work has shown that PO is adsorbed on smectite mainly through: (1) H-bonding between oxygen atoms of the PEO segments and siloxane groups of the clay surface; (2) H-bonding between oxygen atoms of the PEO segments and water molecules in the hydration shells of the exchangeable cations; and (3) direct coordination or ion-dipole interaction between the oxygen atoms of the PEO segments and the exchangeable cations, with a distorted and extended conformation in the interlayer of smectite, which was an intermediate form of the helical and planar zigzag conformations (de Bussetti & Ferreiro, Reference De Bussetti and Ferreiro2004; Deng et al., Reference Deng, Dixon and White2006). In the T shale, the exchangeable Ca2+ may impede separation of the smectite layers (de Bussetti & Ferreiro, Reference De Bussetti and Ferreiro2004), causing monolayer adsorption of PO. In the H shale, separation of the clay layers resulted in multilayer adsorption and larger amounts of adsorbed PO.
Fig. 2. The relationship between the released Na+ content (normalized to CEC) and absorbed PA contents on H shale (PA-H) or T shale (PA-T); the relationship between the released Na+ content (normalized to CEC) and absorbed PO content on H shale (K-H) or T shale (K-T). During PO adsorption on H or T shale, the released Na+ content kept at zero; during PA adsorption on H or T shale in mixed solution of PA and KCl or PO adsorption on H or T shale in mixed solution of PO and KCl, the released Na+ content kept total Na+ content in shale; during all adsorption processes, the released Ca2+, Mg2+ content kept at zero.
When K+ was adsorbed to the H or T shale samples, all the Na+ in the shale was exchanged whereas no Ca2+ or Mg2+ was exchanged by K+ (Fig. 1).
In mixed solutions, the amount of PA adsorbed on H shale was slightly greater than that adsorbed on shale T (Fig. 1). In the mixed solution, the amount of PA adsorbed on the H shale decreased significantly, whereas the amount of PA adsorbed on the T shale was comparable to the solution containing only PA. All Na+ was exchanged by K+ in mixed solution without PA or PO (Fig. 2). With increase in the PA or PO concentration, the amount of exchanged Na+ in the H and T shale samples remained constant. K+ adsorption may reduce the amount of exchangeable Na+ (Zhang et al., Reference Zhang, Sheng and Qiu2016). In a mixed solution, PA adsorption by Na+ exchange on H shale was reduced or prevented, and clay-layer adsorption became the main mechanism for both H and T shale samples. As a result, PA adsorption was greatly reduced on the H shale and was similar to that on the T shale.
In mixed solutions, the amount of PO adsorbed on the H shale was similar to that on the T shale (Fig. 1e). Moreover, the amount of PO adsorbed on the H shale decreased slightly, whereas that adsorbed on the T shale was comparable to that in solution containing only PO. In shale H, the adsorption of PO on smectite surfaces from mixed solutions formed a multilayer, which changed to monolayer in solutions containing PO only (Zhao, Reference Zhao2005). K+ may impede separation of the smectite layers similar to Ca2+ (de Bussetti & Ferreiro, Reference De Bussetti and Ferreiro2004), resulting in less adsorption of PO on H shale.
Models with two parameters including the Langmuir model (Langmuir, Reference Langmuir1918), the Freundlich model (Freundlich, Reference Freundlich1906), the D-R model (Dubinin & Radushkevich, Reference Dubinin and Radushkevich1947), the Tempkin model (Tempkin & Pyzhev, Reference Tempkin and Pyzhev1940), and those with three parameters including the Redlich-Peterson model (Redlich & Peterson, Reference Redlich and Peterson1959), the Sips model (Sips, Reference Sips1948), the Toth model (Toth, Reference Toth1971), the Fritz-Schlunder model (Fritz & Schlunder, Reference Fritz and Schlunder1974) and the Khan model (Khan et al., Reference Khan, Al-Waheab and Al-Haddad1996), listed in Table 2, were used to fit the adsorption isotherms in Fig. 1. The adjusted R2 coefficients were used as error functions and the fitting results are listed in Table 3. In Table 3 the best-fitting models with larger adjusted R2 coefficient are shown with bold numbers. In the H-PO adsorption isotherms, the adjusted R2 coefficients for all models were less than 0.980, indicating more heterogeneous adsorption sites for PO adsorption in the H shale. The highest R2 coefficients (0.999), were observed for adsorption isotherms (H-K-PA, H-K-PO, T-K-PA, T-K-PO) in mixed solutions. It is inferred that adsorption on clay layers became the only adsorption mechanism for PA or PO in mixed solutions.
Table 2. Equations describing the models used to model the adsorption isotherms in this study.
* where; Q e is equilibrium solid phase concentration (mg/g) and C e is equilibrium liquid phase concentration (mg/L) in all isotherm models. In all models, the Q m parameter is relevant to the adsorption capacity. In the Freundlich isotherm model, Kf and n are isotherm parameters characterizing the adsorption capacity and intensity, respectively. In the Langmuir equation, aL is the Langmuir constant related to the energy of adsorption. In the D-R isotherm, E is energy of adsorption. In the Tempkin isotherm, KTe is equilibrium binding constant (L/g), b is related to heat of adsorption (J/mol), R is the gas constant (8.314 × 10⁻³ kJ/K mol) and T is the absolute temperature (K). KR (L/g) and aR (L/mg) are Redlich–Peterson isotherm constants and β is the exponent which lies between 0 and 1. In the Sips isotherm, b is the constant related to energy of adsorption and 1/n is the model exponent. KT, is the Toth model constant and n the Toth model exponent (0 < n ≤ 1). aF is the Fritz-Schlunder model constant and n is the Fritz-Schlunder model exponent. bK is the Khan model constant and aK is the Khan model exponent. Adjusted R2 was used as the error function during isotherms fitting.
Table 3. Adjusted R2 coefficients of adsorption isotherms with various models.
d001 spacings of smectite in shales and shale composites
The difference in d 001-spacing of smectite at 98% RH compared to that at ~0 RH resulted from intercalation of water, PA or PO molecules (Cases et al., Reference Cases, Bébrend, Besson, François, Uriot, Thomas and Poirier1992, Reference Cases, Bébrend, François, Uriot, Michot and Thomas1997; Zhao, 2010; Zhang et al., 2016).
As shown in Fig. 3, in H shale, at ~0% RH, the smectite d 001 spacing originally at 14.12 Å shifted to 14.21 Å after PA adsorption, to 14.24 Å after PO adsorption, to 13.95 Å after K+ adsorption, to 13.97 Å after both K+ and PA adsorption, and to 14.01 Å after adsorption of both K+ and PO. Therefore, the d 001 spacing of smectite increased after PA or PO adsorption, and decreased after adsorption of K+ and K+ along with PA, or PO. It is inferred that PA or PO may intercalate into clay layers of Na-smectite in H shale, while the intercalation may be prevented by K+ adsorption.
Fig. 3. XRD traces of shale and shale composites at p/p o of ~0% RH or 98% RH (H or T, XRD trace of the H or T shale; H-PA or T-PA, XRD trace of the H or T shale with PA adsorption balanced; H-PO or T-PO, XRD trace of the H or T shale with PO adsorption balanced; H-K or T-K, d001-value test spectrum of the H shale or T shale with K+ adsorption balanced; H-K-PA or T-K-PA, XRD trace of the H or T shale with PA adsorption balanced in mixed solution; H-K-PO or T-K-PO, XRD trace of the H or T shale with PO adsorption balanced in mixed solution).
At ~98% RH, the smectite d 001 spacing increased by 1.23 Å in H shale, by 0.08 Å in H-PA shale composites, by 0.11 Å for H-PO shale composites, by 0.17 in H-K shale composites, by 0.05 in H-K-PA shale composites, and by 0.07 for H-K-PO shale composites. K+, PA and PO may reduce intercalation of water into clay layers and, when K+ was used together with PA or PO, intercalation water was reduced further.
In the T shale, at ~0% RH, the d 001 spacing of smectite was comparable after K+, PA or PO adsorption. At ~98% RH, no obvious variation of d 001 spacing was observed for T shale or T shale composites. It is inferred that in the T shale containing Ca-smectite, few water, PA or PO molecules intercalate into the clay layers.
Shale oedometer swelling tests and immersion tests in KCl, PA or PO solutions
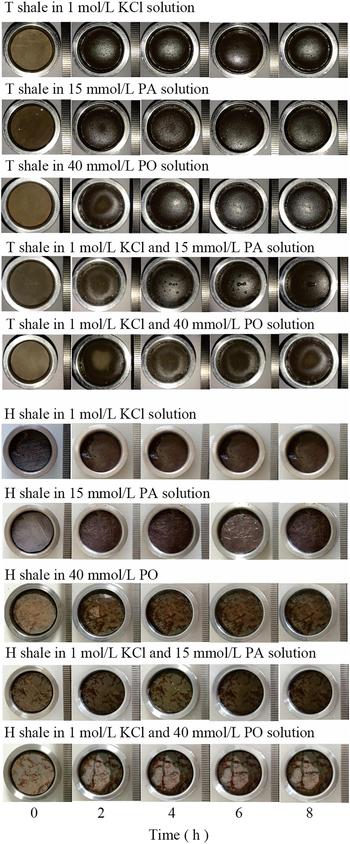
Larger vertical swelling displacements of H shale were induced in all solutions compared to T shale (Fig. 4). The driving force for the hydration of the swelling clays (Na-smectite) is mainly hydration of Na+ (Salles et al., Reference Salles, Bildstein, Douillard, Jullien and Van Damme2007), which causes greater hydration in the H shale which is richer in Na-smectite than the T shale. In H shale, the vertical displacements (2.303 mm) in 15 mmol/L PA solution were larger, with a large amount of micro fractures developing on the surface of H shale due to PA intercalation into smectite (Figs 3, 5).

Fig. 4. Oedometer swelling tests of H shale immersed in 15 mmol/L PA solution (a), in 1 mol/L KCl solution (b), in 40 mmol/L PO solution (c), in mixed solution of 1 mol/L KCl and 40 mmol/L PO (d), in mixed solution of 1mol/L KCl and 15 mmol/L PA (e) and that of T shale immersed in 1 mol/L KCl solution (f), in 40 mmol/L PO solution (g), in 15 mmol/L PA solution (h), in mixed solution of 1 mol/L KCl and 40 mmol/L PO (i), in mixed solution of 1 mol/L KCl and 15 mmol/L PA (j).
In 1 mol/L KCl solution, vertical displacements were reduced to 0.590 mm with a few micro fractures on the surface of H shale (Fig. 5). Interactions between clay minerals and water include nonpolar or Lifshitz-van der Waals (LW) interactions and polar or acid-base (AB) interactions, specifically Lewis acid-base or electron-acceptor/electron-donor interactions (Van Oss et al., Reference Van Oss, Chaudhury and Good1988). According to Zhang et al. (Reference Zhang, Sheng and Qiu2016) the electron-acceptor abilities of K-smectite are greatly reduced because of the lower hydration energy of K+ compared to Na+ (Jorgensen, Reference Jorgensen2002) and the d 001 spacing of smectite at ~98% RH was greatly reduced in H shale (Fig. 3).
In 40 mmol/L PO solution, vertical displacement of H shale increased gradually to 0.341 mm in 5.4 days, with a few micro fractures on the surface (Fig. 5). PO adsorbed on the clay layer or coordinated with Na may reduce the water adsorption sites, while PO intercalation into smectite in H shale may also cause swelling displacement. As is shown in Fig. 5, after 2 h in KCl or PA solution, no dry area was observed on the shale surfaces, whereas in H shale in PO solution, part of the shale surface still remained dry even after 4 h. It is inferred that in PO solution, water-molecule transport was greatly reduced.

Fig. 5. Digital images of H or T shale before and after immersion in solutions.
In the H shale, mixed solutions caused much less displacement (0.120 mm in KCl and PA solution, 0.164 mm in KCl and PO solution). After PA or PO adsorption, the H-bonding between water molecules and basal tetrahedral oxygens and the coordination between water molecules and exchangeable cations may be reduced (Zhang et al., Reference Zhang, Qiu and Huang2015, Reference Zhang, Sheng and Qiu2016). Hydration of Na+ was greatly reduced when Na+ was exchanged by K+ due to the lower hydration energy of the latter. As a result, shale stability may improve in mixed solutions.
In the T shale, the vertical swelling displacements ranged from 0.04 to 0.11 mm without significant variation between the different solutions. Similar to the H shale, vertical displacement was lowest in KCl+PA solution (0.04 mm), and those of KCl+PO solution, PA solution, PO solution, KCl solution were 0.004, 0.005, 0.006, 0.007 and 0.010, respectively (Fig. 4). Compared with Na-smectite, the divalent cations (Ca2+) may impede separation of the smectite layers (de Bussetti & Ferreiro, Reference De Bussetti and Ferreiro2004), causing less swelling due to hydration of T shale. With less Na+ hydration, the H-bonding between water molecules and the oxygens of the siloxane surfaces of the clay contribute mostly to T shale hydration. K+ may reduce hydration of Na+ whereas PA or PO may reduce hydration of the clay layer. As a result, PA or PO inhibited swelling of T shale better.
CONCLUSIONS
In shale containing mainly Na-smectite, cation exchange and adsorption on the clay layer contributed to the adsorption of PA. Adsorption by H-bonding between PO and the clay layer and coordination between PO and exchange cations contributed to the adsorption of PO without ion exchange. Both PA and PO intercalated into Na-smectite, causing great swelling displacements, many fractures and instability of the shale. In mixed solutions (KCl+PA, KCl+PO), K+ prevented PA or PO intercalation in smectite. PA or PO adsorption on shale reduced the H-bonding between water and clay layers and the coordination between water molecules and exchange cations. Meanwhile, K+ replaced Na+ reducing cation hydration. As a result, better stability of shale can be achieved in mixed solutions for shale containing mainly Na-smectite.
In shale containing mainly Ca-smectite, clay-layer adsorption was the main mechanism for adsorption of both PA and PO, and Ca2+ was not exchanged. No obvious differences in swelling displacement were observed for the various solutions. As a result, PA and PO should be used together with KCl during drilling in shale formations containing Na-smectites whereas in shales containing Ca-smectite any of PA, PO or KCl may be used alone.
ACKNOWLEDGMENT
The work presented in this paper is supported by CNPC under Award Number 2016ZX05020-003, 2016ZX05052-003, 2016E-0608.