


Chlorite is a common mineral which occurs in a wide range of geological environments such as diagenesis, low- to medium-grade metamorphism and hydrothermal alteration. The mineral exhibits a wide range of compositional variations in response to the changes in ambient physicochemical conditions during formation, which include temperature (T), pressure (P) and redox conditions in addition to the bulk-rock and fluid compositions. Hence, it is expected that these physicochemical conditions may be estimated from the chemical compositions of end-product chlorite and coexisting minerals as has been shown in previous studies.
Three types of the single-mineral thermometry have been developed to estimate the formation temperature of chlorite: the so-called empirical Al(IV)-in-chlorite (e.g. Cathelineau & Nieva, Reference Cathelineau and Nieva1985; Cathelineau, Reference Cathelineau1988; Kranidiotis & McLean, Reference Kranidiotis and MacLean1987; Jowett, Reference Jowett1991; Hillier & Velde, Reference Hillier and Velde1991; Zang & Fyfe, Reference Zang and Fyfe1995), rigorous thermodynamic thermometers (Vidal et al., Reference Vidal, Parra and Trotet2001, Reference Vidal, De Andrade, Lewin, Munoz, Parra and Pascarelli2006; Lanari et al., Reference Lanari, Wagner and Vidal2014) and semi-empirical thermometers (Walshe, Reference Walshe1986; Inoue et al., Reference Inoue, Meunier, Patrier-Mas, Rigault, Beaufort and Vieillard2009; Bourdelle et al., Reference Bourdelle, Parra, Chopin and Beyssac2013; Lanari et al., Reference Lanari, Wagner and Vidal2014). Detailed comparison of the three types of thermometers has been presented in previous reviews (e.g. De Caritat et al., Reference De Caritat, Hutcheon and Walshe1993; Essene, Reference Essene, Gupta and Dasgupta2009; Inoue et al., Reference Inoue, Meunier, Patrier-Mas, Rigault, Beaufort and Vieillard2009, Reference Inoue, Kurokawa and Hatta2010; Bourdelle & Cathelineau, Reference Bourdelle and Cathelineau2015; Vidal et al., Reference Vidal, Lanari, Munoz, Bourdelle and De Andrade2016) and will not be repeated here. Nevertheless, there are some points to be considered. First, electron microprobe analysis (EPMA) cannot separate ferric from ferrous Fe in chlorite. Therefore, for simplicity of data processing, the semi-empirical thermometers proposed by Bourdelle et al. (Reference Bourdelle, Parra, Chopin and Beyssac2013) and Lanari et al. (Reference Lanari, Wagner and Vidal2014) assumed ΣFe = Fe2+, suggesting that the data determined by EPMA are directly usable in these thermometers. On the contrary, the other semi-empirical thermometers (Walshe, Reference Walshe1986; Inoue et al., Reference Inoue, Meunier, Patrier-Mas, Rigault, Beaufort and Vieillard2009) and rigorous thermodynamic thermometers (Vidal et al., Reference Vidal, Parra and Vieillard2005, Reference Vidal, De Andrade, Lewin, Munoz, Parra and Pascarelli2006; Lanari et al., Reference Lanari, Wagner and Vidal2014) required the Fe3+/ΣFe ratios to estimate the formation temperature. The latter approaches have an advantage that the determination of Fe3+/ΣFe ratios enable us to estimate the oxygen gas fugacity (f O2) conditions in addition to the formation temperature (Walshe & Solomon, Reference Walshe and Solomon1981; Walshe, Reference Walshe1986; Vidal et al., Reference Vidal, Lanari, Munoz, Bourdelle and De Andrade2016). Secondly, the thermodynamic and the semi-empirical methods, but not the empirical methods, gave apparently comparable estimates for the formation temperature of low-temperature chlorites, although the estimates did not always match perfectly. This is because the data source used and the activity models assumed were different in calibrating respective thermometers.
The present study aimed to estimate f O2 conditions during chlorite formation, together with the formation temperature, by combining the semi-empirical thermometer of Inoue et al. (Reference Inoue, Meunier, Patrier-Mas, Rigault, Beaufort and Vieillard2009) with the method proposed by Walshe (Reference Walshe1986). The study consists of two sections: in the first, the validity of the present approach is demonstrated through comparison with the results of Vidal et al. (Reference Vidal, Lanari, Munoz, Bourdelle and De Andrade2016), using data from chlorites from Niger, Rouez and St Martin (Inoue et al., Reference Inoue, Meunier, Patrier-Mas, Rigault, Beaufort and Vieillard2009). In the second section the same approach was applied to recently published data on chlorites coexisting with pink-coloured epidotes in the Noboribetsu geothermal field (Inoue & Utada, Reference Inoue and Utada2017). Previous studies of regional metamorphism (e.g. Keskinen & Liou, Reference Keskinen and Liou1979; Kawachi et al., Reference Kawachi, Grapes, Coombs and Dowse1983; Bonazzi & Menchetti, Reference Bonazzi, Menchetti, Liebscher and Franz2004) have shown that reddish piemontite (manganian epidote) formed under oxidizing conditions. However, the formation conditions of pinkish to reddish epidote in hydrothermal environments are poorly understood because of the scarcity of occurrence compared to piemontite in regional metamorphism (Deer et al., Reference Deer, Howie and Zussman1986). Our final goal here was to characterize the variations in chemical composition of chlorite which formed with pinkish epidote under oxidized conditions and to clarify the role of f O2 during chlorite formation along with the formation process based on other physicochemical conditions.
CHLORITES FROM NIGER, ROUEZ AND ST MARTIN
Firstly, the two methods proposed by Walshe (Reference Walshe1986) and Vidal et al. (Reference Vidal, Lanari, Munoz, Bourdelle and De Andrade2016) were tested to estimate oxygen gas fugacity (f O2) conditions using the literature data for chlorites from the Niger, Rouez and St Martin areas. Chlorites in Niger and St Martin occur in diagenetic sandstones and hydrothermally altered rocks, respectively, whereas their Rouez counterparts occur in low-grade metamorphic rocks surrounding a massive sulfide deposit. A detailed mineralogical description of the chlorites can be found in Inoue et al. (Reference Inoue, Meunier, Patrier-Mas, Rigault, Beaufort and Vieillard2009) and references therein. The sets of data are worthy because the Fe3+/ΣFe ratios in chlorites have been determined by Mössbauer spectroscopy, the formation temperatures have been estimated (Inoue et al., Reference Inoue, Meunier, Patrier-Mas, Rigault, Beaufort and Vieillard2009) and the results have been evaluated extensively by later works (e.g. Bourdelle et al., Reference Bourdelle, Parra, Chopin and Beyssac2013; Lanari et al., Reference Lanari, Wagner and Vidal2014; Bourdelle & Cathelineau, Reference Bourdelle and Cathelineau2015; Vidal et al., Reference Vidal, Lanari, Munoz, Bourdelle and De Andrade2016).
Estimation of fO2 conditions
Walshe (Reference Walshe1986) introduced an endmember component of H-deficient Fe3+-chlorite Fe2+4Fe3+Al2Si3O11(OH)7 in chlorite solid solution. The presence of the H-deficient Fe3+-chlorite component cannot be ascertained by the usual microprobe analysis (Vidal et al., Reference Vidal, Lanari, Munoz, Bourdelle and De Andrade2016), but the universal presence of less than stoichiometric H+ in chlorites has been ascertained by Mössbauer spectroscopy (e.g. Dyar et al., Reference Dyar, Guidotti, Harper, McKibben and Saccicia1992, Reference Dyar, Guidotti, Holdaway and Colucci1993).
The oxidation-dehydration reaction of chamosite Fe2+5Al2Si3O10(OH)8 to H-deficient Fe3+-chlorite Fe2+4Fe3+Al2Si3O11(OH)7 is described by:
 $$\eqalign{& {\rm Fe}^{2+} _5 {\rm Al}_2{\rm Si}_3{\rm O}_{10} \left({\rm OH} \right)_8 + 1/4 {\rm O}_2 (g) = \cr & \quad {\rm Fe}^{2+} _4 {\rm Fe}^{3 +} {\rm Al}_2{\rm Si}_3{\rm O}_{11}\left({\rm OH} \right)_7 + 1/2{\rm H}_2{\rm O} \left( l \right)} $$
The relationship between temperature and the equilibrium constant K (1) of reaction 1 was given by Walshe (Reference Walshe1986):
 $$\log\,K_{(1)} = -1.926 + 6075.8/T$$
where T is temperature in degrees Kelvin. Assuming that the activity of water, a H2O = 1, the logarithmic oxygen gas fugacity (log f O2) for reaction 1 is described as follows:
 $$\log\, f_{O_2} = 4\left[\log\, a_6 - \log\, a_3 - \log \,K_{(1)} \right]$$
where a 3 and a 6 are the activities of chamosite and H-deficient Fe3+-bearing chlorite components in reaction 1, respectively. The ideal activity terms of the two components can be calculated with the mixing-on-sites model (e.g. Powell, Reference Powell1978) when the Fe3+/ΣFe ratios are known, ignoring the non-ideality effects of solid solution. The model of ideal activity for chamosite component (a 3) is identical to that of Walshe (Reference Walshe1986) and Inoue et al. (Reference Inoue, Meunier, Patrier-Mas, Rigault, Beaufort and Vieillard2009): a chamosite = 59.720(X Fe2+,oct)5(X Al,oct)(X Si,tet)(X Al,tet), where X i is a site fraction of the i ion occupying the octahedral (oct) or tetrahedral (tet) sites. The ideal activity of the H-deficient Fe3+-bearing chlorite component (a 6) was calculated from: a 6 = X 6, where X 6 is a mole fraction of Fe2+4Fe3+Al2Si3O11(OH)7 component in chlorite. In this work, different assumptions from Walshe (Reference Walshe1986) were adopted to calculate X 6. The practical procedures of calculation are given in the Appendix at the end of this paper. Log f O2 values were calculated from equation 3 using the data for formation temperatures already estimated by the thermometer proposed by Inoue et al. (Reference Inoue, Meunier, Patrier-Mas, Rigault, Beaufort and Vieillard2009), log K (1) was calculated from equation 2 and the chemical compositions containing data for the Fe3+/ΣFe ratio. The calculated log f O2 values are plotted as a function of the formation temperature at the vapour-liquid equilibrium pressure for water (P sat L/V) (Fig. 1a).
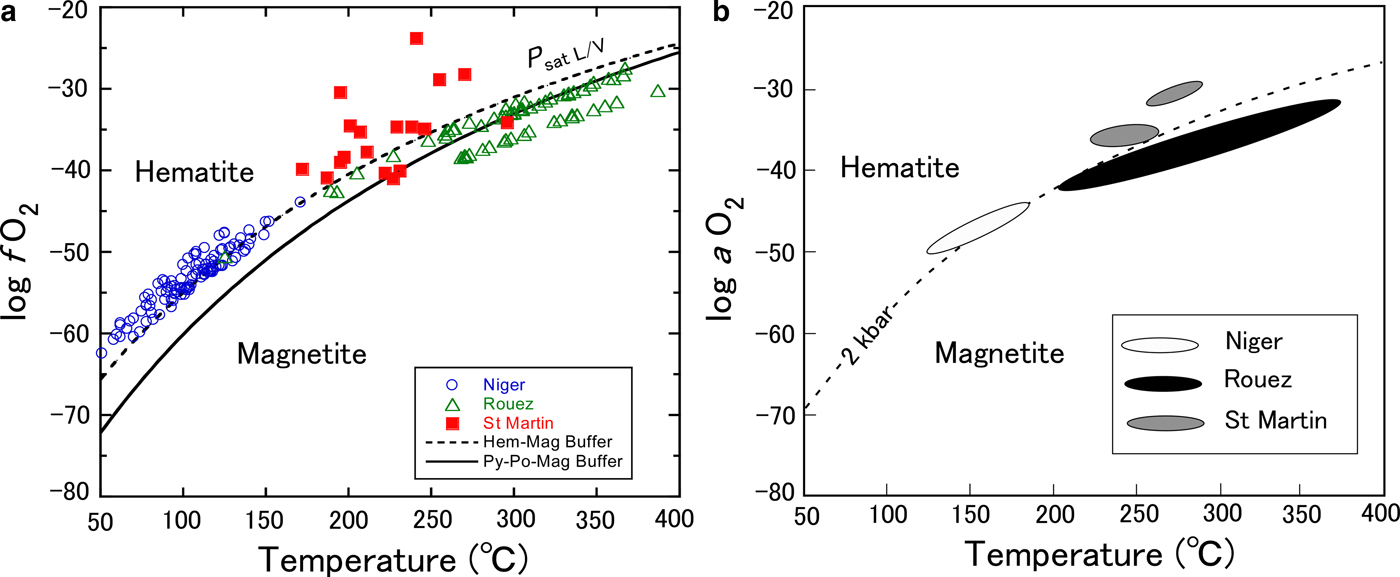
Fig. 1. Comparison of log f O2 vs. temperature for Niger, Rouez and St Martin samples. (a) log f O2 and formation temperatures were calculated at P sat L/V using the approaches of Walshe (Reference Walshe1986) and Inoue et al. (Reference Inoue, Meunier, Patrier-Mas, Rigault, Beaufort and Vieillard2009), respectively. Dashed and solid curves are the hematite–magnetite equilibrium and the pyrite–pyrrhotite–magnetite equilibrium curves calculated at P = P sat L/V using the thermodynamic data of Lonker et al. (Reference Lonker, Fitz Gerald, Hedenquist and Walshe1990) and Walshe & Solomon (Reference Walshe and Solomon1981), respectively. (b) Reproduced from Fig. 8 of Vidal et al. (Reference Vidal, Lanari, Munoz, Bourdelle and De Andrade2016) after partial modification with the permission of the Mineralogical Society of Great Britain & Ireland.
Vidal et al. (Reference Vidal, Lanari, Munoz, Bourdelle and De Andrade2016) also estimated the activities of oxygen (a O2) in fluids during the formation of chlorites in Niger, Rouez and St Martin, assuming that they were buffered by pure magnetite in equilibrium with chlorite + quartz at P = 2 kbar (Fig. 1b). Their calculations were rigorous taking into consideration the non-ideal activity effects of solid solution. Some chlorites were discarded from the calculations because the method is restricted to chlorites with Si < 3 atoms per half formula unit (a.p.h.f.u., Vidal et al., Reference Vidal, Parra and Trotet2001). In fact, a number of chlorites with Si > 3 were contained in the data set. Nevertheless, it is obvious that the two plots in Fig. 1 are similar to one another.
The fact that apparently hematite-free samples were plotted in the hematite stability field of log f O2 implied that the calculated log f O2 values were too high or that oxygen was not buffered by an equilibrium of magnetite with chlorite (Vidal et al. Reference Vidal, Lanari, Munoz, Bourdelle and De Andrade2016). A new endmember ferri-sudoite was introduced in the chlorite solid solution and the f O2 conditions were recalculated for reactions without magnetite. The introduction of a ferri-sudoite endmember led to a reasonable result for the Rouez samples (Vidal et al., Reference Vidal, Lanari, Munoz, Bourdelle and De Andrade2016). Similarly, in reaction 1, where the presence of any oxide minerals was not considered, it was predicted that the samples from Rouez and Niger should plot in the magnetite stability field of log f O2 and on the hematite–magnetite equilibrium curve, respectively (Fig. 1a). The results are consistent with the mineral assemblages documented from the two fields (Inoue et al., Reference Inoue, Meunier, Patrier-Mas, Rigault, Beaufort and Vieillard2009). The log f O2 for the St Martin samples are also arrayed so as to be compatible with the reported mineral assemblages (Beaufort et al., Reference Beaufort, Patrier, Meunier and Ottaviani1992).
Effect of pressure
Different pressure values were assumed in the aforementioned calculations. The effect of different pressures can be evaluated from the following relationship (e.g. Bryndzia & Scott, Reference Bryndzia and Scott1987):
 $$\eqalign{\log\, K{\rm p}_2 - \log\, K{\rm p}_1 = -\! \Delta V_{\rm s}^o \left(P_2 - P_1 \right)/2.303{\rm R}T}$$
where ∆V so denotes the difference in molar volumes of solid phases at the standard state, Kp1 and Kp2 are the equilibrium constants at pressures P 1 and P 2, and R and T are the gas constant and temperature in degrees Kelvin, respectively. Following the molar volume data given by Walshe (Reference Walshe1986), the ∆V so between chamosite (∆V o = 213.42 cm3/mole) and H-deficient Fe3+-chlorite (∆V o = 214.4 cm3/mole) was very small (∆V so = 0.098 J/bar/mole) suggesting that the pressure effect was insensitive in the model of Walshe (Reference Walshe1986). On the other hand, the molar-volume changes (∆V so) in reactions 11–23 of Vidal et al. (Reference Vidal, Lanari, Munoz, Bourdelle and De Andrade2016) ranged from –7.6 to 57.4 J/bar/mole, which varied with the adopted reaction. Taking into account the stoichiometric coefficients of oxygen gas in the Vidal et al. (Reference Vidal, Lanari, Munoz, Bourdelle and De Andrade2016) reactions 11–23, however, final changes in log f O2 with respect to different pressures were also insensitive to the reactions. As a consequence, the entire array of two plots shown in Fig. 1 is not affected significantly by assuming different pressures. Rather, the differences in formation temperature estimated by both Inoue et al. (Reference Inoue, Meunier, Patrier-Mas, Rigault, Beaufort and Vieillard2009) and Vidal et al. (Reference Vidal, Lanari, Munoz, Bourdelle and De Andrade2016) influence the estimated log f O2. In general, the lower the temperature, the lower the calculated log f O2 value.
Redox buffers in closed systems
Oxygen acts as an immobile (inert) component in regional metamorphism (Thompson, Reference Thompson1957; Chinner, Reference Chinner1960; Banno & Kanehira, Reference Banno and Kanehira1961; Miyashiro, Reference Miyashiro1965). Therefore, if f O2 is controlled internally by the assemblage chlorite + magnetite, then the Fe/(Fe + Mg) ratio of chlorite should be inversely correlated with modal magnetite, because the Fe to form magnetite is supplied by chlorite (Frost, Reference Frost and Lindsley1991), as exemplified by reaction 5 below:
 $$\eqalign{&6\hbox{Chamosite} + 4\hbox{Clinochlore} + 5O_2 = 5\hbox{Mg - Corundophilite} \left({\rm or Amesite} \right) + 10{\rm Magnetite} + 20{\rm Quartz} \cr &+ 20{\rm H}_2{\rm O} 6{\rm Fe}_5{\rm Al} \left({\rm Si}_3{\rm Al} \right){\rm O}_{10} \left({\rm OH} \right)_8 + 4{\rm Mg}_5{\rm Al} \left({\rm Si}_3{\rm Al} \right) {\rm O}_{10} \left({\rm OH} \right)_8 + 5{\rm O}_2 = 5{\rm Mg}_4 {\rm Al}_2 \left({\rm Si}_2{\rm Al}_2 \right) {\rm O}_{10} \left({\rm OH} \right)_8 + 10{\rm Fe}_3 {\rm O}_4 + 20{\rm SiO}_2 + {\rm 20H}_2{\rm O}} $$
This reaction has been documented in metamorphic rocks (e.g. Chinner, Reference Chinner1960; Frost, Reference Frost and Lindsley1991) and metamorphosed ore deposits (e.g. Banno & Kanehira, Reference Banno and Kanehira1961; Kanehira et al., Reference Kanehira, Banno and Nishida1964; Nesbitt, Reference Nesbitt1986; Bryndzia & Scott, Reference Bryndzia and Scott1987). In reality, the situation is more complex in chlorite that receives Fe3+ because of the coupled substitutions necessary to maintain charge balance (Frost, Reference Frost and Lindsley1991). The information about the modal contents of oxide minerals is not reported in the three fields studied here. Meanwhile, the occurrence of authigenic magnetite is generally scarce in diagenesis and hydrothermal alteration under low-T conditions. Rather, hematite and/or pyrite instead of magnetite occur more commonly in such environments. Pyrite and pyrrhotite possibly act as redox-controlling minerals with oxides at relatively higher temperatures in a closed system (e.g. Banno & Kanehira, Reference Banno and Kanehira1961; Kanehira et al., Reference Kanehira, Banno and Nishida1964; Nesbitt, Reference Nesbitt1986; Bryndzia & Scott, Reference Bryndzia and Scott1987). The chlorite + sulfide assemblage associated with oxide minerals might act as a main buffer assemblage which controlled the redox conditions in Rouez because of the abundant occurrence of sulfides (Beaufort, Reference Beaufort1986). Indeed, the pyrite–pyrrhotite–magnetite buffer reduces log f O2 from the hematite–magnetite buffer and appears to control the redox conditions in Rouez (Fig. 1a). However, in St Martin, the chlorites coexisting with magnetite in veins were richer in Fe than those without magnetite or with hematite (Beaufort et al., Reference Beaufort, Patrier, Meunier and Ottaviani1992). This behaviour is not expected by the hypothesis above and may be due to the fact that the f O2 was controlled externally in the St Martin hydrothermal system, similar to the Noboribetsu system (see next section). If hematite was stable instead of magnetite, Fe-chlorite would alter to Mg-chlorite and finally to sudoite depending on the Mg-availability in the system, because trioctahedral chlorite cannot host large amounts of Fe3+ in the structure. Chlorites in Niger are relatively rich in Fe (Fe/(Fe + Mg) ratio = 0.59 on average), and it is possible that oxygen was not buffered by an equilibrium of oxides with chlorite. Despite the somewhat ambiguous prediction of log f O2, it is conclusive that the present approach might be utilized to estimate the redox conditions during chlorite formation.
CHLORITES FROM NOBORIBETSU
Petrographic descriptions of the samples studied
The geological setting, hydrothermal alteration and thin sections of the cores studied were described by Inoue & Utada (Reference Inoue and Utada2017). Briefly, the core samples studied were collected from a geothermal exploration hole NB-1 in the Noboribetsu area (Fig. 2). Hydrothermal alteration in this area is divided into several types of alteration that took place at different stages. The underlying pre-Tertiary and Miocene rocks underwent early propylitic alteration that consists of biotite, actinolite-epidote and epidote-chlorite zones (Fig. 2). The overlying Quaternary volcanic rocks were altered to smectite and halloysite, whereas some unaltered glass remained in the rocks. Early propylitic alteration was overprinted locally by later Ca zeolitization, potassic alteration and advanced argillic alteration characterized by the presence of pyrophyllite, kaolinite and rectorite. The potassic alteration was diagnostic of the presence of abundant K-feldspar and illite, in addition to pinkish epidotes and brownish chlorites of interest in the present study.
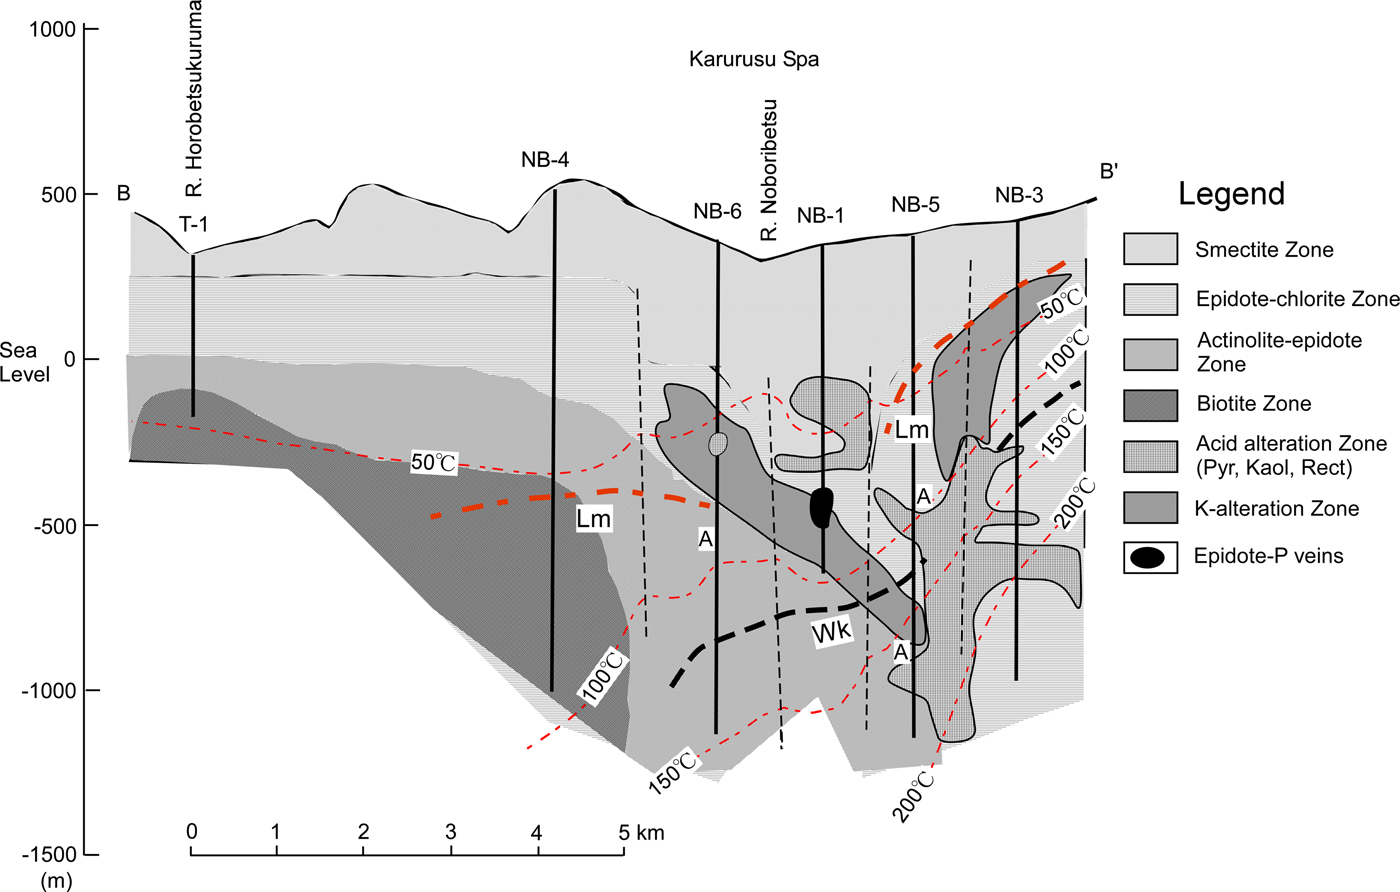
Fig. 2. A cross-section showing the distribution of hydrothermal alteration zones. The cores studied were collected from the part of NB-1 marked with black. Thin dashed lines denote the distribution of present subsurface temperature. Thick dashed lines denote the appearance depths of laumontite (Lm) and wairakite (Wk), respectively. A: depths at which analcime was identified (adapted from Inoue & Utada, Reference Inoue and Utada2017 and reproduced here with the permission of The Japanese Mineralogical Society).
Seven core samples of Hole NB-1, two pinkish epidote-bearing rocks at depths of 837.4 and 897.7 m and five adjacent rocks with propylitic alteration at depths of 792.7, 808.9, 880.5, 888.2 and 996.5 m, were examined in the present study. Pink-coloured epidotes (abbreviated hereafter as epidote-P) occurred as vein fillings and druses in rocks (Fig. 3a). Fine-grained epidote-P was also pervasive in the matrix of wholly silicified rock in the sample at 897.7 m in which original albite was completely decomposed by the overprinted potassic alteration. At 837.4 m, epidote-P occupied veins associated with adularia-like K-feldspar and quartz (Fig. 3b). Green-coloured chlorite (denoted hereafter as chlorite-G) was crosscut by a veinlet of brown-coloured chlorite (denoted hereafter as chlorite-B) (Inoue & Utada, Reference Inoue and Utada2017). Titanite and hematite were common in the samples at 837.4 m and 897.7 m. White to mottled brown-coloured apatite was identified in the samples at 792.7, 808.9 and 888.2 m, which is the product of potassic alteration. In contrast, epidotes with a greenish colour (denoted hereafter as epidote-G) replaced plagioclase and filled veins and druses in rocks with propylitic alteration and usually coexisted with chlorite-G, e.g. in the sample at 792.7 m. However, in these rocks, chlorites were surrounded by dark brown rims and/or partially replaced by brown illite (Fig. 3c), as was shown by microprobe analysis (Inoue & Utada, Reference Inoue and Utada2017). Chlorite-B in the sample at 837.4 m included titanite and pyrite grains (Fig. 3d). The pyrite grains were rimmed by fine-grained epidote. Actinolite was identified in the sample at 996.5 m. Although small amounts of carbonates were observed in the studied rocks, the stage of carbonate-mineral formation remains uncertain.
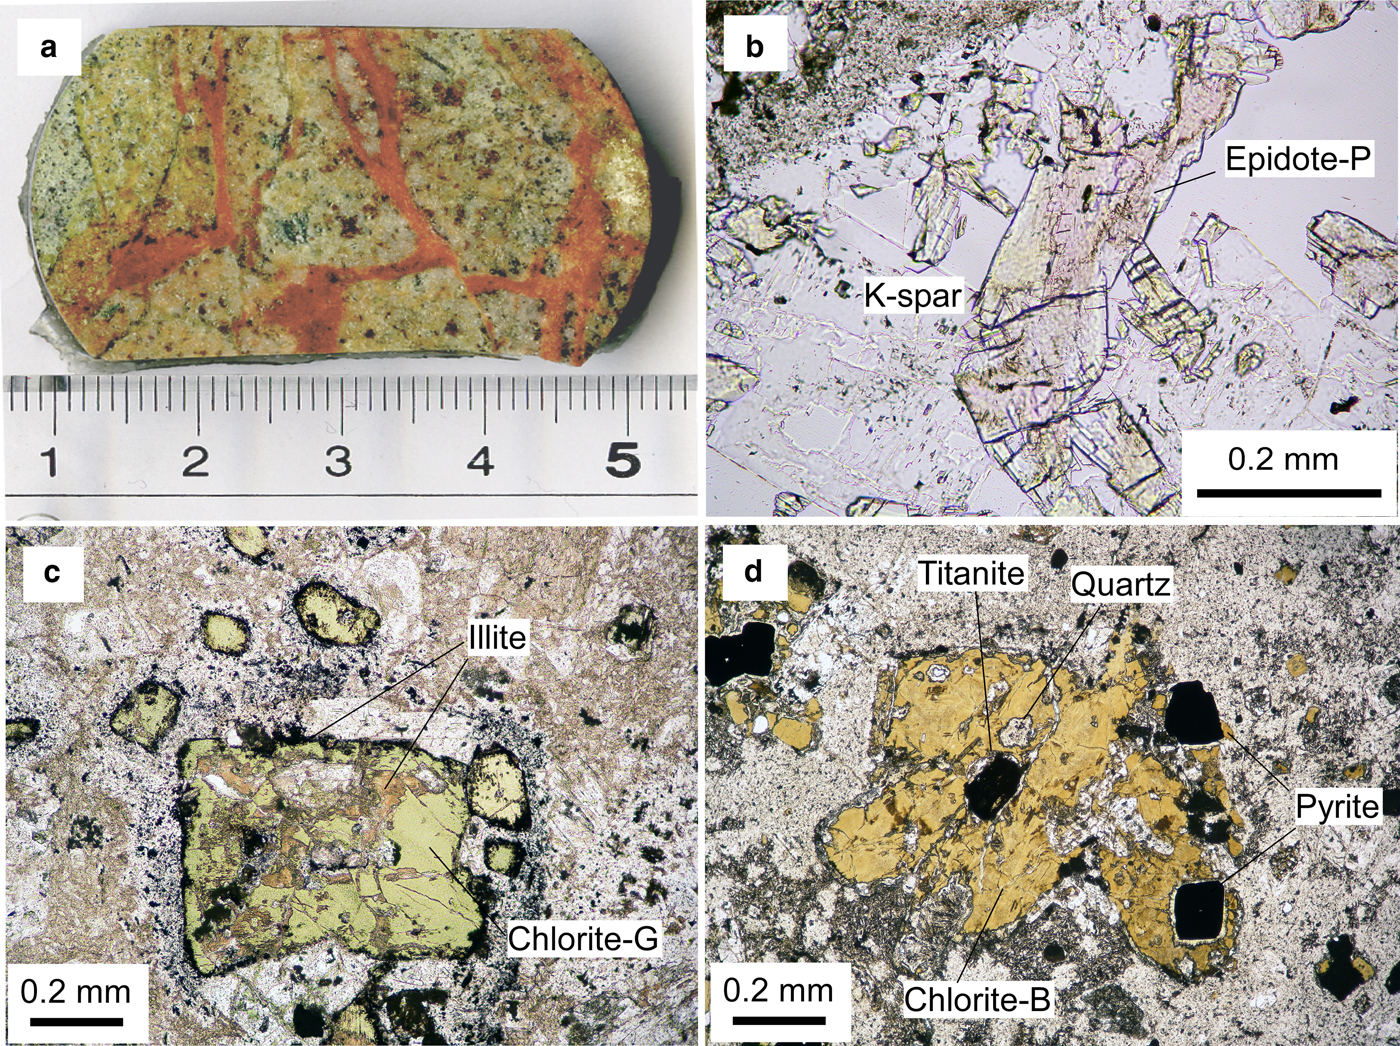
Fig. 3. (a) Core sample with pinkish epidote veins from 897.7 m; (b) a pinkish epidote grain (epidote-P) showing a sector zoning under plane polarized light (837.4 m), K-spar: K-feldspar; (c) greenish chlorite (chlorite-G) rimmed by dark brown illite and partially replaced by brownish illite, under plane polarized light (808.9 m); (d) brownish chlorite (chlorite-B) associated with titanite in the centre and pyrite with colourless epidote rims to the right of chlorite (837.4 m) (modified from Inoue & Utada, Reference Inoue and Utada2017 and reproduced here with the permission of The Japanese Mineralogical Society).
Chemical compositions of chlorites
The chemical compositions of chlorites are listed in Table 1 (data from Inoue & Utada, Reference Inoue and Utada2017). The Mn contents were generally <0.08 a.p.h.f.u. in both the chlorite-G and -B. In an Al(total)–(Fe + Mn)–Mg triangle diagram (Fig. 4), the Fe/(Fe + Mn + Mg) ratios varied from 0.08 to 0.55. The ratios in chlorite-B associated with epidote-P were distinctly lower than those in chlorite-G without epidote-P. In the sample at 808.9 m, two compositional populations were observed; relatively Fe-rich chlorite-G stemmed from fillings of early veins and relatively Fe-poor ones where chlorites were partially replaced by illite (Fig. 3c). In the sample at 837.4 m, chlorite-G was rich in Fe, while chlorite-B in a veinlet that crosscut chlorite-G was poor in Fe. Such occurrences indicate that early-formed propylitic chlorite-G altered to chlorite-B during the later-stage potassic alteration. In the sample at 897.7 m, the Fe content in vein-filling chlorite-B depended on the distance from the contiguous epidote-P crystal; the chlorite in the proximal part from the contact of an epidote-P crystal grain was poorer in Fe than its counterpart from the distal part (Table 1 and Fig. 4). The chemical compositions of associated epidotes, K-feldspar, illite, actinolite and titanite can be found in Inoue & Utada (Reference Inoue and Utada2017). Epidote-P was poorer in Fe than epidote-G. The Mn contents were very low in all the associated minerals.
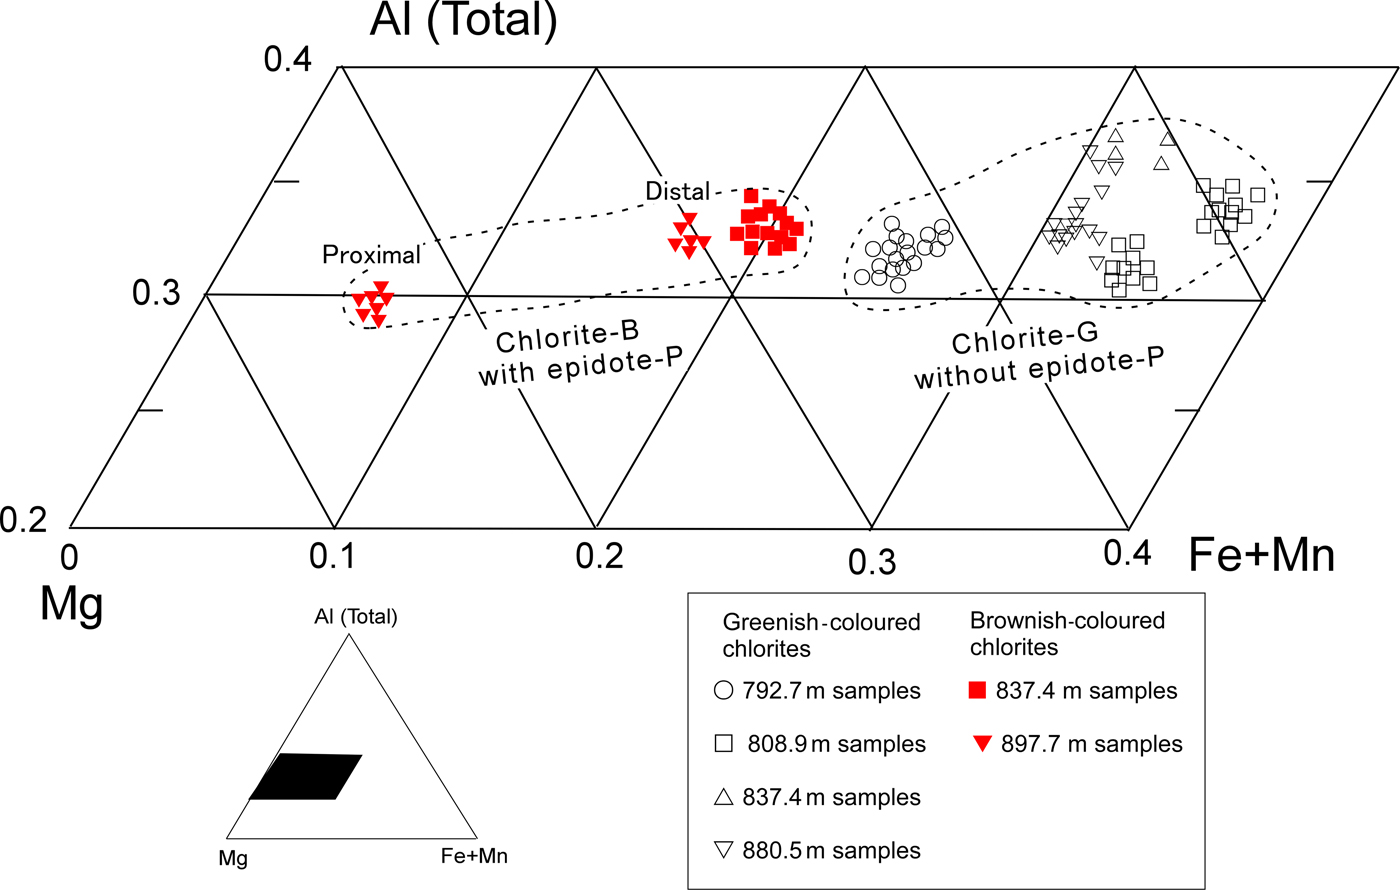
Fig. 4. Plots of chemical compositions of chlorites in part of a triangle diagram of Al (total)-(Fe + Mn)-Mg (modified from Inoue & Utada (Reference Inoue and Utada2017) and reproduced here with the permission of The Japanese Mineralogical Society).
Table 1. Chemical compositions of chlorites (adapted from Inoue & Utada, Reference Inoue and Utada2017).
*: Total Fe as FeO.
**: Fe/(Fe + Mn + Mg) ratios.
#: Formation temperatures of chlorite estimated by equation 6.
##: estimated Fe3+/ΣFe (see text).
Estimation of formation temperatures
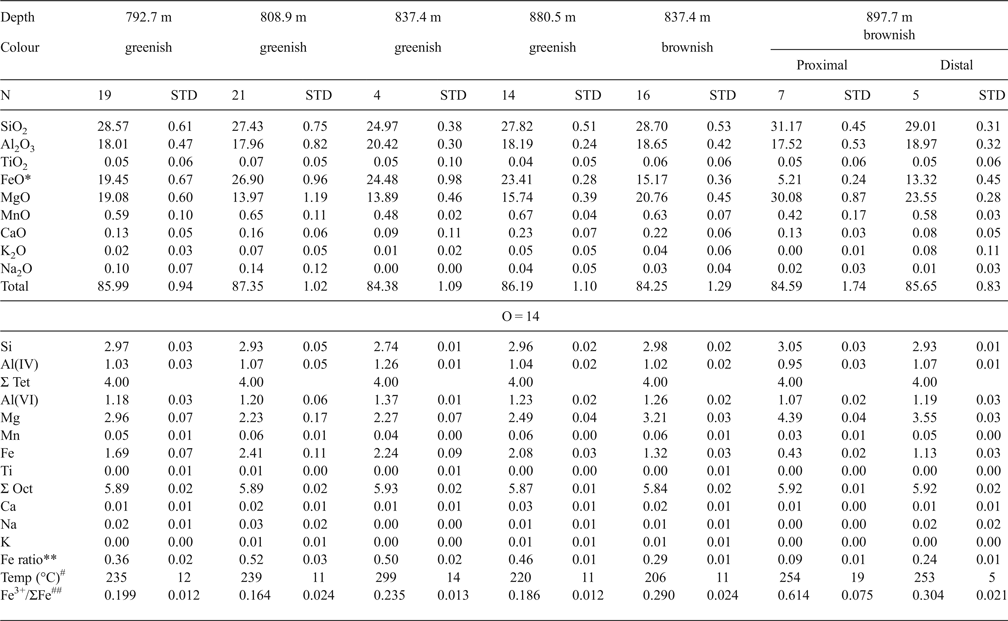
The Fe3+/ΣFe ratios in Noboribetsu chlorites were not determined separately. Thus, our thermometer, which uses the Fe3+/ΣFe ratios, is not applicable immediately to estimation of the formation temperatures. As mentioned previously, Bourdelle et al. (Reference Bourdelle, Parra, Chopin and Beyssac2013) and Lanari et al. (Reference Lanari, Wagner and Vidal2014) proposed semi-empirical thermometers, in which the Fe3+/ΣFe ratios are not required in advance. However, this does not mean that temperatures estimated by different thermometers are completely consistent with one another. For internal consistency, we calibrated the relation between the temperatures [abbreviated as T (log K(Fe2+Fe3+))] estimated by our thermometer and the equilibrium constants (log K(Fe2+)) were calculated assuming ΣFe = Fe2+, using the previous literature data from Niger, Rouez and St Martin (Fig. 5). A fitted curve is:
 $$\eqalign{& T{(}^{\circ} {\rm C}) = 63.83 + 50.41 \left[\log K \left({\rm Fe}^{2+} \right) \right] + 2.617 \left[\log K \left({\rm Fe}^{2+} \right) \right]^2 + 2.846 \left[\log K \left({\rm Fe}^{2 +} \right) \right]^3\; 1.097 \left[{\rm log} K \left({\rm Fe}^{2 +} \right) \right]^4 \cr &\quad + 0.09285 \left[\log K\left({\rm Fe}^{2+} \right) \right]^5 \; \left({\rm R}^2 = 0.997 \right).} $$
As a consequence, using equation 6, the average formation temperatures [abbreviated as T (log K(Fe2+))] of chlorite-G and -B ranged from 220 to 298°C and from 205 to 258°C, respectively (Table 1). The formation temperatures of chlorite-B at 837.4 m were less than those at 897.7 m but were almost the same for the proximal and distal parts in the sample at 897.7 m. The formation temperatures estimated according to Bourdelle et al. (Reference Bourdelle, Parra, Chopin and Beyssac2013) were adopted in our previous work (Inoue & Utada, Reference Inoue and Utada2017). Bourdelle's formation temperatures were higher, ~40–80°C more than the values above.
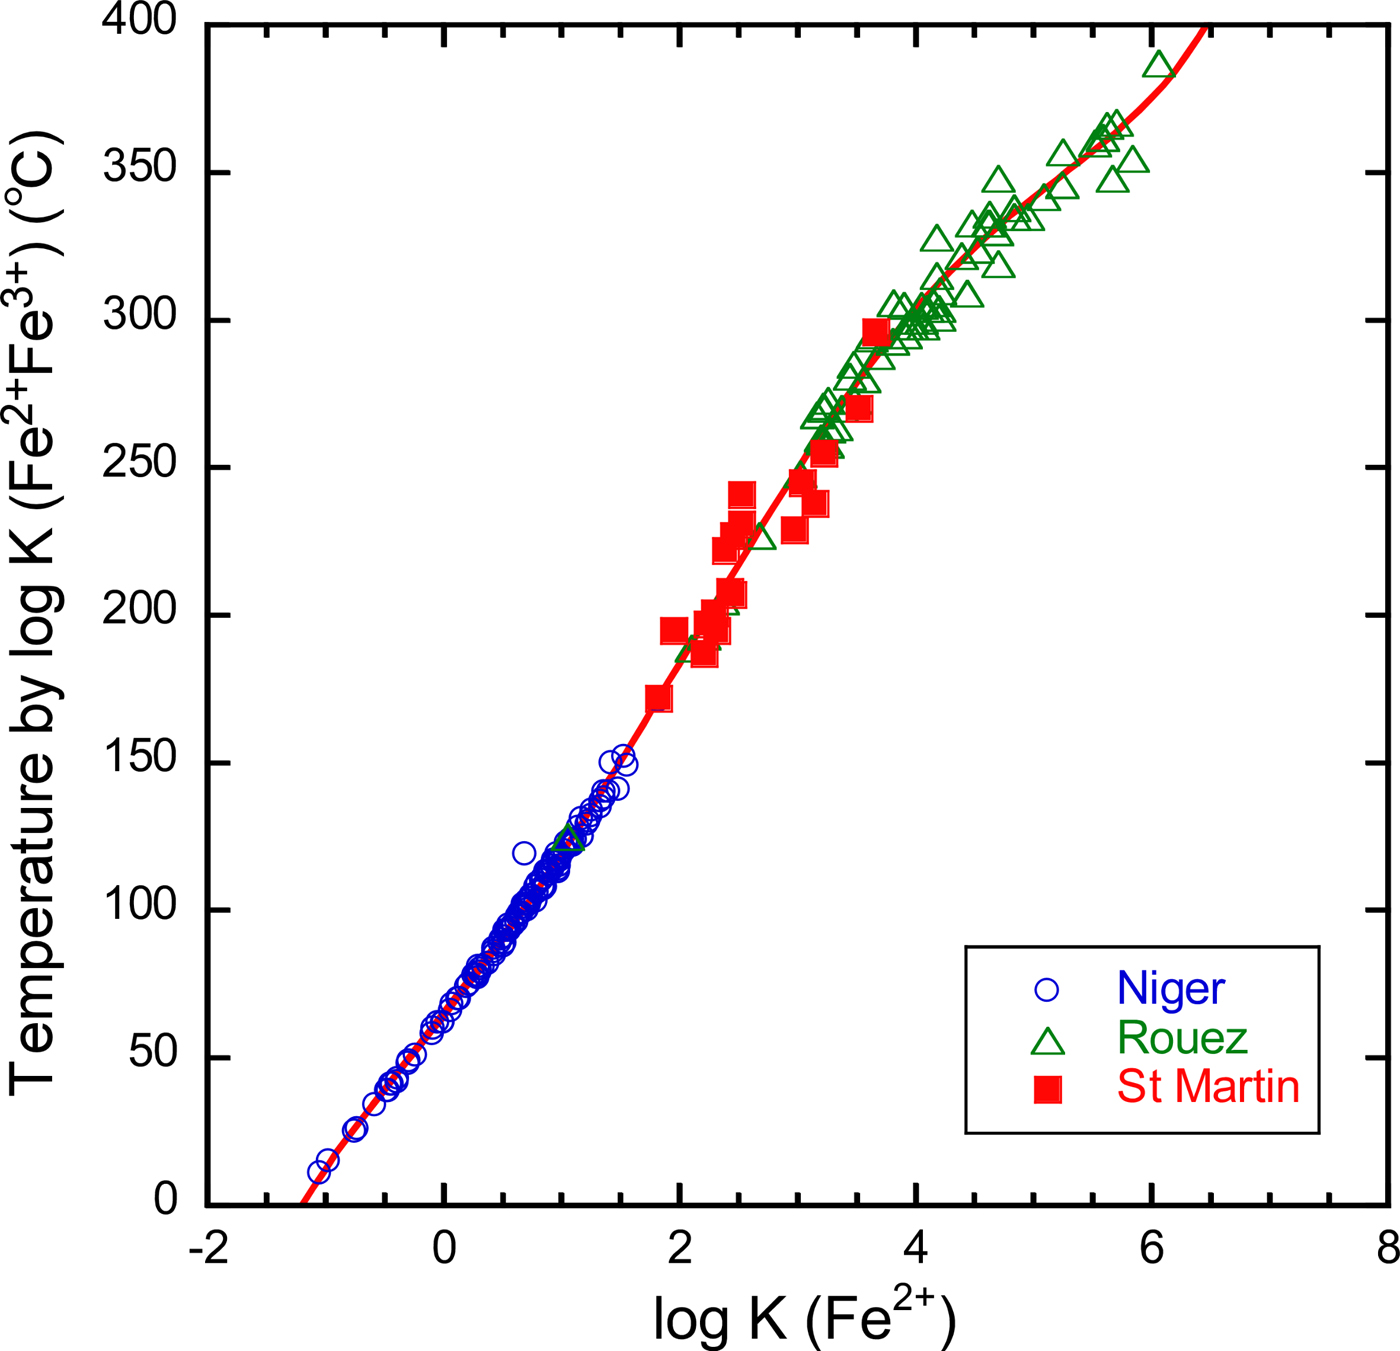
Fig. 5. Relationship between temperature and log K(Fe2+) for chlorites from Niger, Rouez and St Martin. The vertical axis represents the temperatures estimated by Inoue et al. (Reference Inoue, Meunier, Patrier-Mas, Rigault, Beaufort and Vieillard2009) taking into account the Fe3+/ΣFe ratios. Log K(Fe2+) is the equilibrium constant assuming ΣFe = Fe2+.
NEDO (1991) documented homogenization temperatures for fluid inclusions in vein quartz or calcite from adjacent propylitic rocks in NB-1. The average values reported were 315°C (range 243–350°C) for quartz in the sample at 767.6 m, 231°C (range 204–257°C) for calcite in the sample at 783.5 m, 235°C (range 208–257°C) for calcite in the sample at 846.6 m and 289 °C (range 266–315°C) for quartz in the sample at 964.6 m. Comparison between the two types of temperature data is impossible, strictly speaking, because of different sampling depths, different minerals used and paragenetic ambiguity. Nevertheless, the reported homogenization temperatures of fluid inclusions appear to be in accordance with the formation temperatures of chlorite estimated by equation 6.
Pressure conditions for the potassic alteration may be assumed to be under pressures along the vapour-liquid equilibrium curve for water (P sat L/V) at the above temperatures, possibly at <200 bar.
Estimate of fO2 conditions
It is reasonable to assume that the formation temperatures [T (log K(Fe2+))] estimated by log K(Fe2+) via equation 6 are equal to those [T (log K(Fe2+Fe3+))] estimated using the original thermometer proposed by Inoue et al. (Reference Inoue, Meunier, Patrier-Mas, Rigault, Beaufort and Vieillard2009). Then the optimal Fe3+/ΣFe ratios in Noboribetsu chlorites may be obtained by iterative calculations until T (log K(Fe2+)) = T (log K(Fe2+Fe3+)). The resulting Fe3+/ΣFe ratios for chlorite-G and -B were, on average, 0.16–0.24 and 0.29–0.48, respectively (Table 1). The ratios exceeded 0.6 in extremely Fe-poor chlorites (the proximal part) in the sample at 897.7 m.
From the estimated Fe3+/ΣFe ratios, in turn, f O2 values were calculated at P sat L/V following the method explained in the preceding section (see also the first part of the Appendix). The calculated log f O2 values were plotted as a function of the formation temperature (Fig. 6). Chlorite-G in early-formed propylitic rocks all plotted near the hematite–magnetite equilibrium curve, whereas chlorite-B in the potassic alteration is in the hematite stability field of f O2. The chlorites in the sample at 897.7 m are separated into two groups according to log f O2, although the formation temperatures are comparable. Chlorites in the proximal part of the epidote-P crystal formed under more oxidizing conditions than those in the distal part, reflecting the changes in f O2 during crystal growth. Moreover, chlorites formed under more oxidizing conditions have lesser Fe/(Fe + Mn + Mg) and greater Fe3+/ΣFe ratios (Table 1).
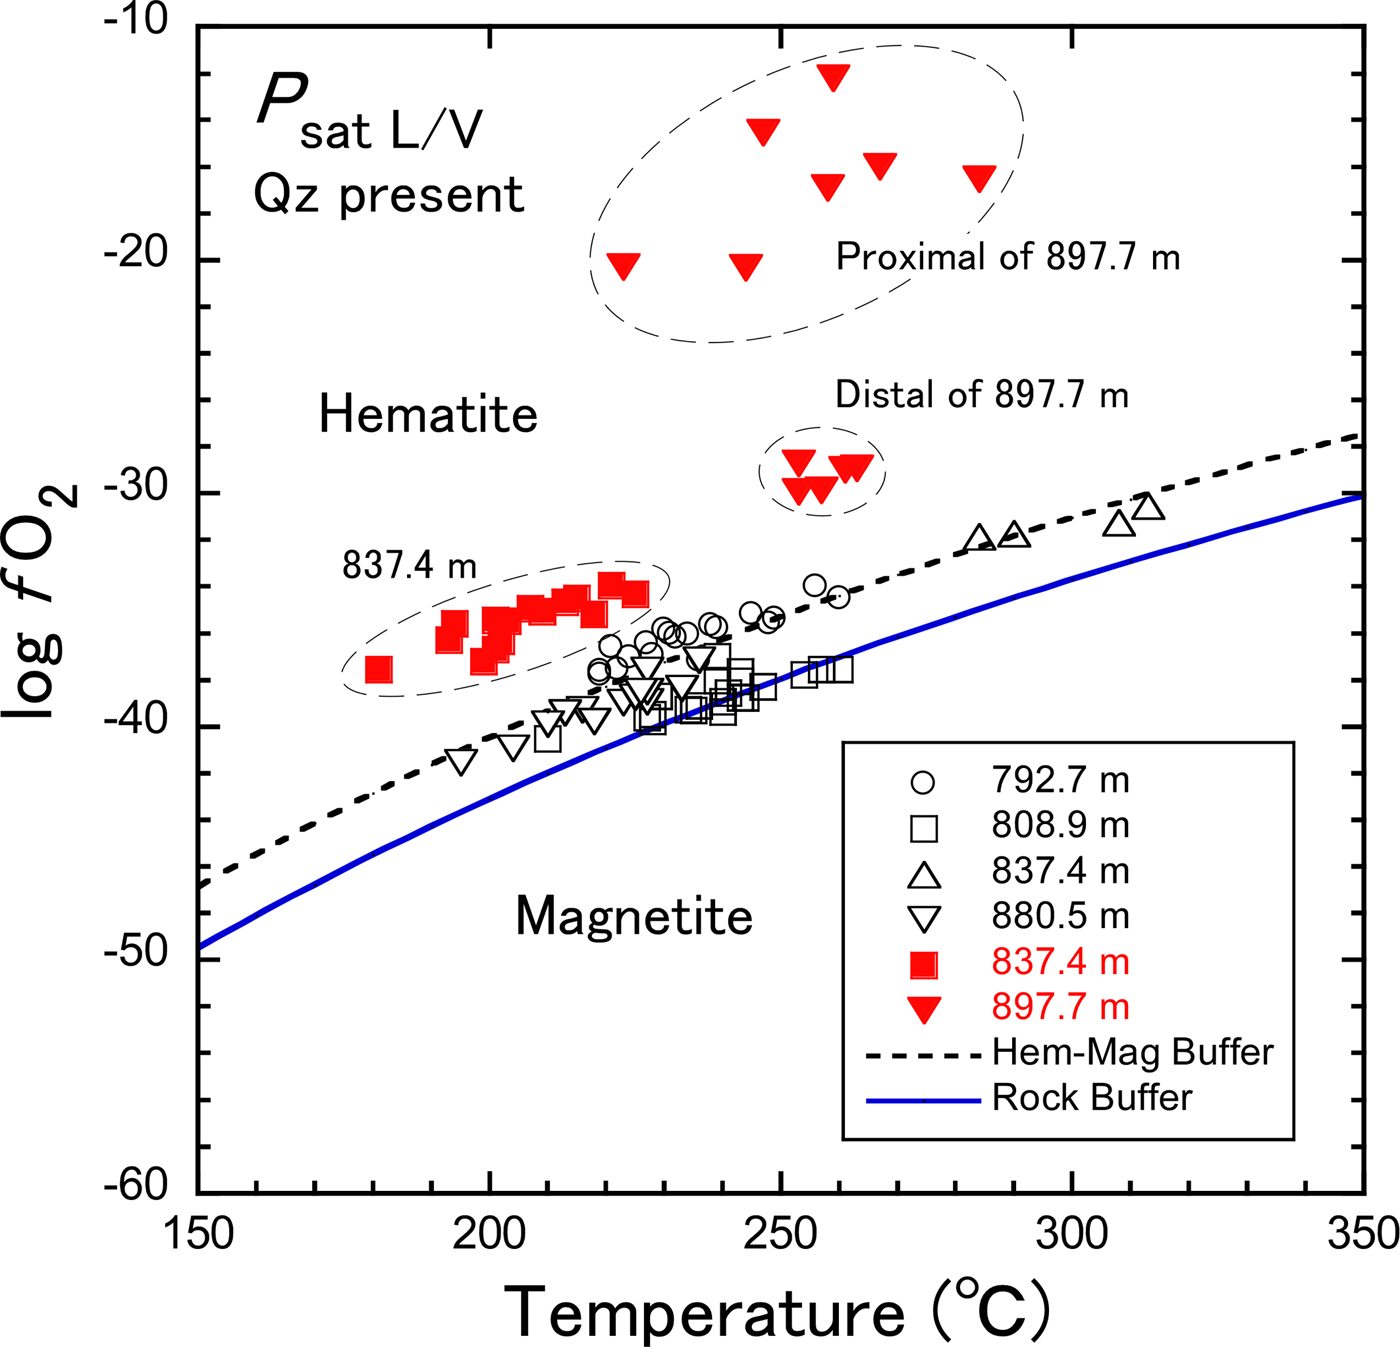
Fig. 6. Plots of estimated log f O2 vs. formation temperature for chlorite-B and chlorite-G in Noboribetsu. Dashed and solid curves represent the hematite–magnetite equilibrium calculated at P = P sat L/V using thermodynamic data of Lonker et al. (Reference Lonker, Fitz Gerald, Hedenquist and Walshe1990) and the rock buffer defined by Giggenbach (Reference Giggenbach and Barnes1997), respectively.
Based on the compilation of geothermal fluid compositions, Giggenbach (Reference Giggenbach1987, Reference Giggenbach and Barnes1997) indicated that when equilibrium of aqueous fluids and surrounding rocks was attained in geothermal systems, log (f H2/f H2O) values, defined as R H, were approximately constant at –2.8 regardless of temperature. The redox condition R H was referred to as the ‘rock buffer’. Assuming that R H = –2.8, the temperature dependence of log f O2 might be calculated from the relationship: log f O2 = 5.30–25,552/T – 2R H (Giggenbach, Reference Giggenbach and Barnes1997), where T is temperature in degrees Kelvin. In Fig. 6, chlorite-G is plotted in the area near or slightly above the rock buffer curve, while chlorite-B is in the area far above the rock buffer curve. Assuming that equilibrium of aqueous fluids and minerals was attained in the present system, it follows that the ordinary propylitic assemblage with epidote formed under log f O2 near or slightly lower than the hematite–magnetite equilibrium values, which is rather close to the rock buffer curve. It is conclusive that chlorite-B associated with epidote-P formed under more oxidizing conditions than the ordinary propylitization. Such highly oxidized conditions may be similar to the formation conditions of piemontite in regional metamorphism. Before discussing the log f O2 conditions more quantitatively, however, it is necessary to take into account the effect of water activity. When a H2O < 1, log f O2 decreases as inferred from the equilibrium constant of equation 1, K (1) = (a 6)(a H2O)1/2/(a 3)(a O2)1/4. The activity of water is unknown in the present system.
Estimate of other chemical conditions
NEDO (1991) documented the composition of fluids recovered from NB-3 (Fig. 2). These fluids may not be the same as those involved in the formation of epidote-P and chlorite-B in NB-1 because the two minerals were not recognized in the potassic alteration zone of NB-3 (Inoue, unpublished data). Nevertheless, taking into account the presence of abundant K-feldspar and illite in the two holes, the chemical conditions in fluid related to the potassic alteration in NB-1 seem to be not largely different from those in fluid recovered from NB-3. The following hypothetical conditions were assumed for the fluid: log m ΣS = −3, log a K+ = –3, ionic strength (I) = 0.2 and a H2O = 1 at 250°C, P sat L/V and quartz present, where a and m represent activities and molarity of the corresponding chemical species, respectively. As a result the pH of fluid related to the K-alteration was estimated to be ~7 when K-feldspar was in equilibrium with illite (Inoue & Utada, Reference Inoue and Utada2017). Note that the pH decreases with increasing ionic strength or a K+ (Henley et al., Reference Henley, Henley, Truesdell, Barton and Whitney1984). From the estimated pH, it is in turn inferred that log (a K+/a H+) was about 4, and log (a Ca2+/a 2H+) ranged from 8 to 10 depending on temperature (Fig. 7). These chemical conditions are consistent with the mineral assemblages, epidote-P + K-feldspar + illite + quartz + titanite (+ Mg-chlorite), observed in the samples studied.
Fig. 7. Log a(K+)/a(H+) and log a(Ca2+)/a(H+)2 conditions of K-alteration estimated from mineral assemblages and pH values at (a) 200°C and (b) 250°C, and P sat L/V, quartz present. Shaded squares are the estimated conditions compatible with the observed mineral assemblages. The thermodynamic data used in the calculations are from Lonker et al. (Reference Lonker, Fitz Gerald, Hedenquist and Walshe1990).
Noticeable amounts of sulfide, sulfate and carbonate minerals were not detected inside the veins with epidote-P and chlorite-B. The pyrite in rocks with propylitic alteration was partially replaced by epidote owing to the potassic alteration (Fig. 3d), suggesting that the activity of sulfur, and probably that of CO2, might be low in hydrothermal fluids related to the potassic alteration. The physicochemical conditions estimated here are, generally, similar to those estimated for many adularia-sericite-type epithermal ore deposits (e.g. Heald et al., Reference Heald, Foley and Hayba1987). However the Fe, S, CO2 and Cl contents in fluids may be lower than those in epithermal ore-forming fluids. The origin of the oxidized fluid remains unknown.
Effects of fluid composition
It is evident that the Fe/(Fe + Mg) ratio and the Fe3+ content in chlorite are related to f O2, although f O2 is not the only factor to determine the two variables. Beaufort et al. (Reference Beaufort, Patrier, Meunier and Ottaviani1992) noted that epidotes associated with the Mg-chlorite + hematite assemblage in St Martin were enriched in Fe3+ and interpreted that this was due to high f O2 conditions. This is the reverse of the present observation in Noboribetsu whereby the Mg-chlorite+ hematite assemblage coexisting with epidote-P have smaller Fe3+ contents than those in epidote-G in adjacent propylitic rocks (Inoue & Utada, Reference Inoue and Utada2017). Shikazono (Reference Shikazono1984) indicated the positive correlation between the Fe3+ content in epidote and the Fe2O3 content in original rocks. Shikazono & Kawahata (Reference Shikazono and Kawahata1987) also suggested that there is a positive correlation between the Fe content in chlorite and those in the original rocks and/or fluids. Accordingly the lower Fe contents in both chlorite and epidote in Noboribetsu are due to high f O2 conditions and to the low Fe concentrations in fluids.
Redox buffers in open systems
Veins in hydrothermal alteration are considered as an open system capable of exchanging matter with the external environment. In case that f O2 is controlled externally, there are also two possibilities. If f O2 in fluid is in the magnetite stability field (i.e. relatively reduced conditions), the Fe content in chlorite and the modal content of magnetite can be positively correlated with one another, as inferred from the above reaction 5. The relation is compatible with the observations in St Martin (Beaufort et al., Reference Beaufort, Patrier, Meunier and Ottaviani1992). In contrast, if f O2 is in the hematite stability field (i.e. relatively oxidized conditions), which is the case in Noboribetsu, the Fe content in chlorite and the modal content of hematite should be inversely correlated, because the structure of trioctahedral chlorite cannot accommodate large amounts of Fe3+. Unfortunately we cannot verify this hypothesis at present because of a lack of information concerning the modal hematite in the Noboribetsu samples.
Limit of Fe3+ contents in trioctahedral chlorite
The Fe3+ content in chlorite is restricted crystallographically by the structure rather than thermodynamically by ambient f O2 conditions (Dyar et al., Reference Dyar, Guidotti, Harper, McKibben and Saccicia1992). Trivalent cations are more stable in the M4 site, which become larger at higher temperatures than the surrounding M3 sites, thus limiting the Fe oxidation in chlorite (Nelson & Guggenheim, Reference Nelson and Guggenheim1993). Indeed, it has been confirmed by high-angle annular dark field scanning transmission electron microscopic (HAADF-STEM) observation of extremely Fe-rich chlorite that Al with a small ionic radius preferentially occupied the M4 site (Inoué & Kogure, Reference Inoué and Kogure2016). However, the distinction between Fe3+ and Fe2+ in chlorite was impossible by the HAADF-STEM technique. Also the Fe3+/ΣFe ratios in low-T chlorites are generally larger than those in high-grade metamorphic chlorites (e.g. Inoue et al., Reference Inoue, Meunier, Patrier-Mas, Rigault, Beaufort and Vieillard2009; Lanari et al., Reference Lanari, Wagner and Vidal2014; Vidal et al., Reference Vidal, Lanari, Munoz, Bourdelle and De Andrade2016). This ratio is also related to the total Fe content in chlorite as described previously (Table 1). When the total Fe content in chlorite is <1 a.p.h.f.u., most of the Fe may be ferric in the M4 site under highly oxidized conditions. Then, the Fe3+/ΣFe ratio increases significantly as exemplified by chlorites in the Noboribetsu sample at 897.7 m. When total Fe > 1 a.p.h.f.u., however, the excessive Fe must be spread between the M1, M2 and/or M3 sites being mostly ferrous, and consequently the Fe3+/ΣFe ratios may be restricted within a certain limit due to the crystallographic constraints. The limit of Fe3+ content that is incorporated in the structure of trioctahedral chlorite is still controversial.
CONCLUDING REMARKS
The present study has demonstrated how to estimate the f O2 conditions and the formation temperatures during chlorite formation by the combination of a semi-empirical chlorite thermometer (Inoue et al., Reference Inoue, Meunier, Patrier-Mas, Rigault, Beaufort and Vieillard2009) with the method of Walshe (Reference Walshe1986). The present approach, which was applied to the literature data of chlorites from three fields studied previously (Inoue et al., Reference Inoue, Meunier, Patrier-Mas, Rigault, Beaufort and Vieillard2009), gave compatible results with those estimated by more rigorous thermodynamic approaches (Vidal et al., Reference Vidal, Lanari, Munoz, Bourdelle and De Andrade2016). This suggests that the present approach can allow us to discuss qualitatively the changes in redox conditions using the chemical composition of chlorite.
Chlorites, studied for the first time here, occurred as veins and coexisted with pink-coloured epidotes, K-feldspar, illite, quartz and hematite in hydrothermally altered rocks. Applying the present approach to the samples indicated that the chlorites formed under more oxidized conditions than those in adjacent rocks with propylitic alteration. The chemical compositions were characterized by lower Fe/(Fe + Mn + Mg) ratios and larger Fe3+/ΣFe ratios than those in chlorites in adjacent propylitzed rocks. This was attributed to the formation of the mineral assemblage under high f O2 conditions, possibly in association with the low Fe concentrations in the fluid phase. Physicochemical conditions such as T and redox estimated using chlorite thermometry, together with the chemical compositions and mineral assemblages, are helpful for achieving a better understanding of the formation process of chlorite during hydrothermal alteration. Nevertheless, the quantitative estimation of log f O2 requires additional work. In order to understand the role of oxygen during chlorite formation, moreover, we must examine the relationship between the Fe content in chlorite and the modal content of oxide and/or sulfide minerals more accurately. We also need to know, from the crystal chemical point of view, to establish the amount of ferric iron that may enter the chlorite structure.
ACKNOWLEDGEMENTS
The authors are indebted to Alain Meunier, Daniel Beaufort, Patricia Patrier and Philippe Vieillard of Poitiers University, for enthusiastic discussions about chlorite thermometry during a visit by the authors. The initial manuscript was improved by the comments and suggestions of Pierre Lanari and an anonymous reviewer. The authors are also grateful to Takahito Koshiba of Chiba University for his help in making thin sections of rock samples.
APPENDIX
The case where the Fe3+/ΣFe ratio is known
In order to explain the calculation procedures, an example of oxide wt.% data determined by EPMA is listed below. The first and second lines in the table correspond to the original data determined by EPMA and the recalculated data assuming Fe3+/ΣFe ratio = 0.26 respectively. FeO* is the total iron, i.e. ΣFe = Fe2+.
First FeO* is transformed into Fe2O3 and FeO using the following relation:
 $$\!\!\!\eqalign{Fe_2O_3({\rm wt.\%} ) & = {\displaystyle{{{\rm Fe}{\rm O}^{\ast}({\rm wt.\% })} \over {\left( {\displaystyle{{\hbox{molecular weight of FeO}} \over {\hbox{atomic weight of Fe}}}} \right)}}} \displaystyle{{Fe^{3 + }} \over {\sum Fe}} \cr & \quad \times \! \left( {\displaystyle{{\hbox{molecular weight of F}{\rm e}_{\rm 2}{\rm O}_{\rm 3}} \over {2 \times \hbox{atomic weight of Fe}}}} \right)}$$
 $${\rm FeO}({\rm wt.\%} ) = {\rm FeO}{^\ast} \times \left( {1 - \displaystyle{{{\rm Fe}^{3 +}} \over {\sum {\rm Fe}}}} \right)$$
Then, the structural formula is recalculated based on O = 14. The site fractions of cations and vacancies in the octahedral (oct) and tetrahedral (tet) sites are calculated by, for example, X Mg,oct = Mg/6, X Si,tet = (Si – 2)/2, X Al,tet = Al(IV)/2, following the random mixing model (Inoue et al., Reference Inoue, Meunier, Patrier-Mas, Rigault, Beaufort and Vieillard2009). Here Ti, Mn, alkali and alkaline earth elements were ignored in the calculation.
Our thermometer is defined for the following chlorite + quartz assemblage (Inoue et al., Reference Inoue, Meunier, Patrier-Mas, Rigault, Beaufort and Vieillard2009):
 $$\eqalign{& {\rm 3 Sudoite + Al - free \ Chlorite =} \cr & \quad {\rm 3 Corundophilite} \left( {{\rm or \ Amesite}} \right){\rm + 7Quartz + 4H}_2{\rm O}\left( l \right) \cr & {\rm 3Mg}_2{\rm Al}_3 \square {\rm Si}_3{\rm AlO}_{10}\left( {{\rm OH}} \right)_8{\rm + Mg}_6{\rm Si}_4{\rm O}_{10}\left( {{\rm OH}} \right)_8 \cr & {\rm = 3Mg}_4{\rm Al}_2{\rm Si}_2{\rm Al}_2{\rm O}_{10}\left( {{\rm OH}} \right)_8{\rm + 7SiO}_2{\rm + 4H}_2{\rm O}\left( l \right){\rm.}} $$
The equilibrium constant [log K(Fe2+Fe3+)] of reaction (A1), which takes account of the presence of Fe2+ and Fe3+ in structure, is:
 $$\log\; K({\rm Fe}^{2+} {\rm Fe}^{3 +}) = 3 \log a_{\rm crdp}^{\rm ideal} - 3 \log a_{\rm sud}^{\rm ideal} {\rm - a}_{\rm Afch}^{\rm ideal},$$
where a quartz = a H2O = 1. The ideal terms of activities of endmember components are defined as:
 $$\eqalign{& a_{{\rm Afch}\;\;=\;\; }(X_{{\rm Mg,oct}})^6 (X_{{\rm Si,tet}})^2 \cr & a_{{\rm crdp}}= 45.563(X_{{\rm Mg,oct}})^4 (X_{{\rm Al,oct}})^2 (X_{{\rm Al,tet}})^2 \cr & a_{{\rm sud}\;\;=\;\; 1728(}X_{{\rm Mg,oct}})^2 (X_{{\rm Al,oct}})^3 (X_{{\rm vac,oct}})(X_{{\rm Si,tet}})(X_{{\rm Al,tet}}) \cr & a_3{\rm \;=\;} a_{{\rm cham}} = 59.720(X_{{\rm Fe}^{2+} {\rm, oct}})^5 (X_{{\rm Al,oct}})(X_{{\rm Si,tet}})(X_{{\rm Al,tet}})} $$
Using the data listed above, log K(Fe2+Fe3+) = 1.9509 is obtained. This value is input in the equation A3, which is a calibration equation proposed by Inoue et al. (Reference Inoue, Meunier, Patrier-Mas, Rigault, Beaufort and Vieillard2009),
 $$T(^\circ {\rm C}) = \displaystyle{1 \over \matrix{0.00293 - 5.13 \times 10^{ - 4}\log K{\rm (Fe}^{2 +} {\rm Fe}^{3 +} ) + \hfill \cr \quad 3.904 \times 10^{ - 5}[\log K{\rm (Fe}^{2 +} {\rm Fe}^{3 +} )]^2 \hfill}} - 273.15 $$
and the formation temperature, T(log K(Fe2+Fe3+)) = 208°C is obtained.
Walshe (Reference Walshe1986) assumed that the ideal activity of H-deficient Fe3+-chlorite component (a 6) approximates the mole fraction of that component (X 6). In practice, it is not easy to calculate X 6. So, when Fe3+ was incorporated into the octahedral sites of chlorite, the X 6 was tentatively assumed to be calculated from the relation: X 6 = Fe3+(1 – F), where F = 28/(28 + Fe3+). This relation is similar to that of Walshe (Reference Walshe1986), and a convenient assumption in the present study. Finally the logarithmic oxygen gas fugacity (log f O2) can be calculated from
 $$\eqalign{\log f_{O_2} &= 4 \left[(\log a_6 - \log a_3) - \left(\!\!\! - 1.926 \vphantom{\displaystyle{6075.8 \over T(^{\circ} {\rm C}) + 273.15}}\right. \right. \cr &\qquad \left. \left. + \displaystyle{6075.8 \over T(^{\circ} {\rm C}) + 273.15} \right) \right]}$$
Here, as F = 0.966, we obtain log f O2 = –37.7 from equation A4.
The case where the Fe3+/ΣFe ratio is unknown
The site fractions of cations and vacancies in each site, except for Fe3+, are calculated by the same manner as above, using the data below.
Then the logarithmic equilibrium constant [log K(Fe2+)] of reaction A1 is calculated:
 $${\rm log} \ K ({\rm Fe}^{2+} {\rm ) = 3}\log a_{{\rm crdp}}^{{\rm ideal}} {\rm - 3}\log a_{{\rm sud}}^{{\rm ideal}} {\rm -} a_{{\rm Afch}}^{{\rm ideal}} $$
Put the equilibrium constant (= 2.4198) into the equation 6 in the text and the formation temperature, assuming ΣFe = Fe2+: T(log K(Fe2+)) = 211.5°C, is obtained. The difference in estimated temperature for the St Martin sample was derived from the statistical error between the two calibration curves. Furthermore, by iterative calculations until T(log K(Fe2+)) = T(log K(Fe2+Fe3+)), we can obtain the optimum Fe3+/ΣFe ratio. In turn, we calculate a 3 and X 6 following the same path as above, and finally estimate log f O2 based on equation A4. The predicted Fe3+/ΣFe ratio increased with decreasing Fe/(Fe + Mn + Mg) ratio in chlorite, but the resultant log f O2 did not change significantly with the Fe3+/ΣFe ratios.


