


Hypertrophic cardiomyopathy is the leading cause of sudden cardiac death in healthy young athletes.Reference Maron, Doerer, Haas, Tierney and Mueller 1 Hallmarks of the disease include ventricular hypertrophy, myocyte disarray, and both replacement and interstitial fibrosis. Distinguishing between hypertrophic cardiomyopathy and other causes of left ventricular hypertrophy can be difficult. Cardiac MRI has significant advantages over echocardiography for assessment of adults with hypertrophic cardiomyopathy, and newer methods of tissue characterisation may aid in the diagnosis of children with hypertrophic cardiomyopathy.Reference Patel and Kramer 2
The longitudinal relaxation time constant, or T1, can be measured non-invasively in myocardium using cardiac MRI. Native T1 maps, or maps obtained prior to contrast administration, can be analysed separately or combined with post-contrast T1 maps to derive either a partition coefficient or an extracellular volume fraction. Native T1 and extracellular volume are surrogates of extracellular matrix expansionReference Kellman, Wilson, Xue, Ugander and Arai 3 and have been validated histologically.Reference Miller, Naish and Bishop 4 – Reference Child, Suna and Dabir 7
Studies demonstrate lower myocardial strain in areas of replacement fibrosis in paediatric hypertrophic cardiomyopathy.Reference Bogarapu, Puchalski, Everitt, Williams, Weng and Menon 8 Interstitial fibrosis also seems to have an effect on myocardial mechanics in multiple cardiovascular disease states, but this has never been studied in paediatric hypertrophic cardiomyopathy.Reference Wu, An and Yao 9 – Reference Siegel, Olivieri, Gordish-Dressman and Spurney 11 A better understanding of the underlying relationship between myocardial mechanics and markers of fibrosis and myocyte hypertrophy may help clarify disease progression and inform future treatment strategies. The objectives of this study were to evaluate whether T1 mapping, partition coefficient, and extracellular volume mapping improve accuracy of diagnosis in patients with hypertrophic cardiomyopathy and to define the relationship between T1 and extracellular volume mapping and measures of myocardial function, particularly myocardial strain and left ventricular ejection fraction.
Methods
Enrollment
The Vanderbilt Institutional Review Board approved this retrospective study, and the study was performed in accordance with the ethical standards as laid down in the 1964 Declaration of Helsinki and its later amendments or comparable ethical standards. Patients who underwent cardiac MRI between 2015 and 2018 were identified from the paediatric cardiac MRI database. Inclusion criteria were children with a diagnosis of hypertrophic cardiomyopathy and prior cardiac MRI that included a modified Look-Locker inversion recovery. All hypertrophic cardiomyopathy patients had a definitive diagnosis based on family history and either a positive genotype or a phenotype consistent with hypertrophic cardiomyopathy (n = 11), clinical diagnosis with pathologic hypertrophy and known hypertrophic cardiomyopathy causing mutation, or definitive clinical diagnosis of hypertrophic cardiomyopathy with negative genetic testing (n = 14). Patients were excluded if they had an underlying neurologic, metabolic, or other secondary cause of hypertrophic cardiomyopathy, inadequate modified Look-Locker inversion recovery image quality for analysis. Genotype positive phenotype negative was defined as a patient with a known positive genotype but with clinical testing that would not meet criteria for definitive diagnosis of hypertrophic cardiomyopathy.
Control images for our study were acquired from 19 patients, 12–30 years of age, from previous cohorts of either clinically indicated cardiac MRIs or research cardiac MRIs. All controls had normal cardiac MRIs. Exclusion criteria for control cohort were cardiovascular disease, risk factors for cardiovascular disease, muscular dystrophy or unexplained skeletal muscle weakness, any diagnosis that could affect cardiac function or lead to myocardial fibrosis, and contraindication to cardiac MRI with gadolinium. All patients undergoing research cardiac MRI were aged 18–30 and previously healthy. For patients undergoing clinically indicated cardiac MRIs, indications were concern for possible arrhythmogenic right ventricular cardiomyopathy due to either an abnormal electrocardiogram or history of premature ventricular contractions with normal work-up, including normal cardiac MRI, and arrhythmogenic right ventricular cardiomyopathy ruled out; concern for abnormal left ventricular function on echocardiogram with normal function on cardiac MRI; evaluation for possible apical hypertrophic cardiomyopathy with normal cardiac MRI; and evaluation of atypical chest pain with normal work-up.
The electronic medical record was reviewed for genetic test results, Holter monitor results, treatment interventions (pharmacologic management, placement of implantable cardioverter defibrillator or pacemaker, or septal myectomy), and risk stratification criteria for hypertrophic cardiomyopathy (septal thickness greater than 30 mm, history of ventricular tachycardia or unexplained syncope, family history of hypertrophic cardiomyopathy with sudden cardiac death or aborted sudden cardiac death, and inadequate blood pressure response during treadmill test).
Cardiac MRI acquisition
Cardiac MRI was performed on a 1.5 Tesla Siemens Avanto. Functional imaging was performed as previously described using balanced steady-state free precession images in a short-axis stack.Reference Schulz-Menger, Bluemke and Bremerich 12 Intravenous gadolinium contrast (gadopentate dimeglumine, Magnevist®, Bayer Healthcare Pharmaceuticals, Wayne, NJ, USA or gadobutrol, Gadovist®, Bayer Healthcare Pharmaceuticals, Wayne, NJ, USA) was administered through a peripheral intravenous line at a dose of 0.2 mmol/kg. Late gadolinium enhancement imaging was performed using single shot (balanced steady-state free precession) and segmented (turboflash) inversion recovery with optimised inversion recovery to null the signal from the myocardium, as well as phase-sensitive inversion recovery balanced steady-state free precession with an inversion time of 300 ms.
Myocardial tagging was performed in the short axis at the base, level of the papillary muscles, and apex using a segmented k-space fast gradient echo sequence with electrocardiogram triggering. Grid tagging was performed with a spacing of 8 mm and 9–13 phases. Typical imaging parameters included slice thickness 6–8 mm, field of view 340 × 340 mm2, matrix size 256 × 192, and minimum echo time and repetition time. The sequences were breath-holds and parallel imaging with generalised autocalibrating partially parallel acquisition with an acceleration factor of 2 was used. One patient had individual horizontal and vertical tagging performed, and in one patient, tagged images were not analysable.
Breath-held modified Look-Locker inversion recovery sequences were performed prior to and 15 minutes after contrast administration at the left ventricular base, mid-left ventricle, and apex in the short-axis plane.Reference Messroghli, Radjenovic, Kozerke, Higgins, Sivananthan and Ridgway 13 Modified Look-Locker inversion recovery sequences were motion-corrected, electrocardiogram-triggered images obtained in diastole with typical imaging parameters: non-selective inversion with a 35° flip angle, single-shot steady-state free precession imaging, initial inversion time of 120 ms with 80 ms increments, field of view 340 × 272 mm2, matrix size 256 × 144, slice thickness 8 mm, voxel size 1.3 × 1.9 × 8.0 mm3, repetition time of 2.6 ms, echo time of 1.1 ms, parallel imaging factor of 2. The matrix size was decreased to 192 × 128 for heart rates >90 (approximate voxel size 1.8 × 2.1 × 8 mm3). The pre-contrast modified Look-Locker inversion recovery acquired five images after the first inversion with the equivalent of a 3 second pause followed by three images after the second inversion, or 5(3s)3 (as a true 3 second pause is not possible with the current software package, the number of heartbeats used for recovery was varied depending on the average heart rate measured just prior to T1 mapping, with 3 beats used for a heart rate of 60, 4 beats used for a heart rate of 80, 5 beats for a heart rate of 100, and 6 beats for a heart rate of 120; no patient had a heart rate over 120 in this study). The post-contrast protocol was acquired at a 4(1)3(1)2, or four images acquired after the first inversion with a 1 beat pause followed by a second inversion after which three images were acquired, an additional 1 beat pause, then a final inversion after which two images were acquired.Reference Kellman and Hansen 14 Motion correction as described by Xue et al was performed, and a T1 map was generated on the scanner.Reference Xue, Shah and Greiser 15 A goodness-of-fit map was also performed at the time of the scan to evaluate data quality. In six hypertrophic cardiomyopathy patients, the modified Look-Locker inversion recovery was only performed at the mid-left ventricle slice; the basilar slice was deemed inadequate for analysis in one patient and the apical slice in two patients with hypertrophic cardiomyopathy.
Cardiac MRI post-processing
Left ventricular volume, mass, and function were calculated as previously described.Reference Soslow, Damon and Saville 16 The presence or absence of late gadolinium enhancement was qualitatively assessed. Percent of scar was calculated using the 5 standard deviation method on Medis (Medis Medical Imaging Systems, Leiden, The Netherlands) on the phase-sensitive inversion recovery images as per our labs standard protocol. Analysis of myocardial tagged images was performed as previously described using harmonic phase methodology (Diagnosoft Inc., Morrisville, NC, USA).Reference Simpson, Field, Xu, Saville, Parra and Soslow 17 In brief, a contour or mesh was drawn over the tagged image at peak systole by outlining the epicardium and endocardium. The superior right ventricular insertion was identified manually. The contours were performed by the same reader (SS) with verification of each contour by a second reader (JHS) with more than 7 years of experience using the software. The software then calculated the global peak circumferential strain and the circumferential strain values for each segment (16 segment model) and slice (base, mid, and apex).
Using software programmed in MATLAB 2014a (The MathWorks, Natick, MA, USA), regions of interest were manually drawn on native and post-contrast T1 maps within the left ventricular mesocardium in 16 segments using the standard American Heart Association model of segmentation.Reference Cerqueira, Weissman and Dilsizian 18 These regions of interest were contoured by one reader with experience analysing T1 maps and confirmed by a second reader with 6 years of experience in analysing T1 mapping. To evaluate reproducibility, a second reader with experience analysing T1 maps repeated the analysis at the base, mid, and apex in a random sample of 10 hypertrophic cardiomyopathy patients on both the native and post-contrast maps. In addition, hypertrophic cardiomyopathy patients with significant left ventricular hypertrophy (left ventricular thickness >15 mm) had a region of interest drawn in the region of thickest hypertrophy. Only 10 hypertrophic cardiomyopathy patients had concurrent haematocrit levels, so extracellular volume maps were not analysed; instead, synthetic extracellular volume was calculated as described below. Regions of interest were carefully traced to avoid partial volume averaging with blood pool or epicardial fat. Based on the T1 mapping consensus statement, areas of late gadolinium enhancement were not excluded as these areas were felt to be the most focal areas in a continuum of diffuse extracellular matrix expansion.Reference Moon, Messroghli and Kellman 19
Partition coefficient was calculated from the native and post-contrast T1 using the following equation:
 $$\({\rm{Partition \;coefficient}} = {{\left( {{1 \over {{\rm{myocardial \;T}}{1_{{\rm{post}}}}}}} \right) - \left( {{1 \over {{\rm{myocardial \;T}}{1_{{\rm{pre}}}}}}} \right)} \over {\left( {{1 \over {{\rm{blood \;pool \;T}}{1_{{\rm{post}}}}}}} \right) - \left( {{1 \over {{\rm{blood \;pool \;T}}{1_{{\rm{pre}}}}}}} \right)}}.\)$$
Synthetic haematocrit was calculated from the following equation optimised to this magnet:Reference Raucci, Parra and Christensen 20
 $$\({\rm{Synthetic\;hematocrit}} = \left( {315.1{\rm{}}\cdot{\rm{}}\left[ {{1 \over {{\rm{T1 \;blood}}}}} \right]} \right) + {\rm{}}0.213\)$$
The basal, mid, and apical synthetic extracellular volume fraction was calculated from the native and post-contrast T1 and the synthetic haematocrit using the following equation:
 $$\(\scale 88%{\rm{Synthetic\;extracellular\;volume}} = \left[ {{{\left( {{1 \over {{\rm{myocardial \;T}}{1_{{\rm{post}}}}}}} \right) - \left( {{1 \over {{\rm{myocardial \;T}}{1_{{\rm{pre}}}}}}} \right)} \over {\left( {{1 \over {{\rm{blood \;pool \;T}}{1_{{\rm{post}}}}}}} \right) - \left( {{1 \over {{\rm{blood \;pool \;T}}{1_{{\rm{pre}}}}}}} \right)}}} \right]*\left( {1 - {\rm{synthetic\;hematocrit}}} \right)\)$$
In patients with adequate maps at all three slices, global myocardial T1, global partition coefficient, and global synthetic extracellular volume were calculated. Imaging artifact was not contoured. Segments were not included in the analysis if the bounds of the myocardium could not be distinguished from surrounding tissue and blood pool or if image registration was inadequate in those segments.
Statistical analysis
Categorical variables were compared using a Chi-square or Fisher’s exact test and continuous variables were compared using a Wilcoxon rank-sum test. Correlations between continuous variables were obtained using a Spearman’s rho. Reproducibility of native and post-contrast T1 mapping was assessed using intraclass correlation coefficient for absolute agreement. We fit univariate logistic regression models to estimate the probability of hypertrophic cardiomyopathy evaluating the following pre-specified predictors: left ventricular ejection fraction, indexed left ventricular mass, percent late gadolinium enhancement, circumferential strain at mid-left ventricle, native T1 at mid-left ventricle, partition coefficient at mid-left ventricle, and synthetic extracellular volume at mid-left ventricle. The mid-left ventricle slice was used for circumferential strain and T1 mapping because some patients did not have adequate image quality to calculate these measures at either the apex or the base (and thus inadequate images to calculate global values). Multivariable analysis was then performed using those predictors that were significant to determine the best predictors of hypertrophic cardiomyopathy (a total of six models evaluated). Analyses were performed with IBM SPSS statistics, version 25.0 (Armonk, NY, USA: IBM Corp.). Study data were collected and managed using Research Electronic Data Capture tools hosted at Vanderbilt.Reference Harris, Taylor, Thielke, Payne, Gonzalez and Conde 21
Results
Demographics
Thirty hypertrophic cardiomyopathy patients met inclusion and exclusion criteria. The mean age of hypertrophic cardiomyopathy diagnosis was 14.0 ± 2.9 years and the mean age at cardiac MRI was 15.8 ± 2.2. Nineteen hypertrophic cardiomyopathy patients (63%) were male, while 17 controls (89%) were male. Further demographics can be found in Table 1.
Table 1. Demographics

Data presented as mean ± standard deviation or n (percent).
Genetic testing was completed in 28 patients, with 16 testing positive for known hypertrophic cardiomyopathy mutations (Table 2), 10 with negative testing, and 2 with variants of unknown significance. Six patients had an implantable cardioverter defibrillator placed and three had a history of implantable cardioverter defibrillator shock. One patient who did not meet criteria for implantable cardioverter defibrillator placement died during sleep. Thirteen patients had received pharmacotherapy at some point during their medical course, with beta-blockade the most common therapy. Risk factors for sudden cardiac death are listed in Table 2.
Table 2. Clinical characteristics of hypertrophic cardiomyopathy patients

* All non-sustained ventricular tachycardia
Standard cardiac measures
Hypertrophic cardiomyopathy patients had increased indexed left ventricular mass (median 79 g/m2 interquartile range [65, 91] versus 57 g/m2 [54, 62], p < 0.001) and increased left ventricular ejection fraction (69% [63, 71] versus 60% [58, 64], p = 0.001) in comparison to controls. The right ventricular ejection fraction was also higher in hypertrophic cardiomyopathy (64% [60, 68] versus 57% [55, 60], p < 0.001). The median maximal wall thickness of the left ventricle in the hypertrophic cardiomyopathy group was 18 mm [16, 22.5]. A total of 18 hypertrophic cardiomyopathy patients (65%) had late gadolinium enhancement, almost exclusively in areas of pathologic hypertrophy, though some patients had mild late gadolinium enhancement at the right ventricular insertion points. Patients with late gadolinium enhancement had a median percent scar of 3.3% [1.7, 5.1].
Myocardial strain and T1 mapping
The native and post-contrast T1 maps had good reproducibility (native T1: base intraclass correlation coefficient 0.89 p = 0.001, mid intraclass correlation coefficient 0.91 p < 0.001, apex intraclass correlation coefficient 0.90 p = 0.001; post-contrast T1: base intraclass correlation coefficient 0.95 p < 0.001, mid intraclass correlation coefficient 0.96 p < 0.001, apex intraclass correlation coefficient 0.94 p < 0.001). Hypertrophic cardiomyopathy patients had decreased global circumferential strain compared with controls as well as decreased circumferential strain at the base, mid-left ventricle, and apex (Table 3). For example, T1 maps and tagged images are demonstrated in Figure 1. Hypertrophic cardiomyopathy patients had significantly increased global and mid-native T1 compared with controls (Table 3 for all results, including basal and apical). The global and mid partition coefficient and synthetic extracellular volume were not significantly different between hypertrophic cardiomyopathy and control.
Table 3. Comparison of cardiovascular MRI in control and hypertrophic cardiomyopathy patients

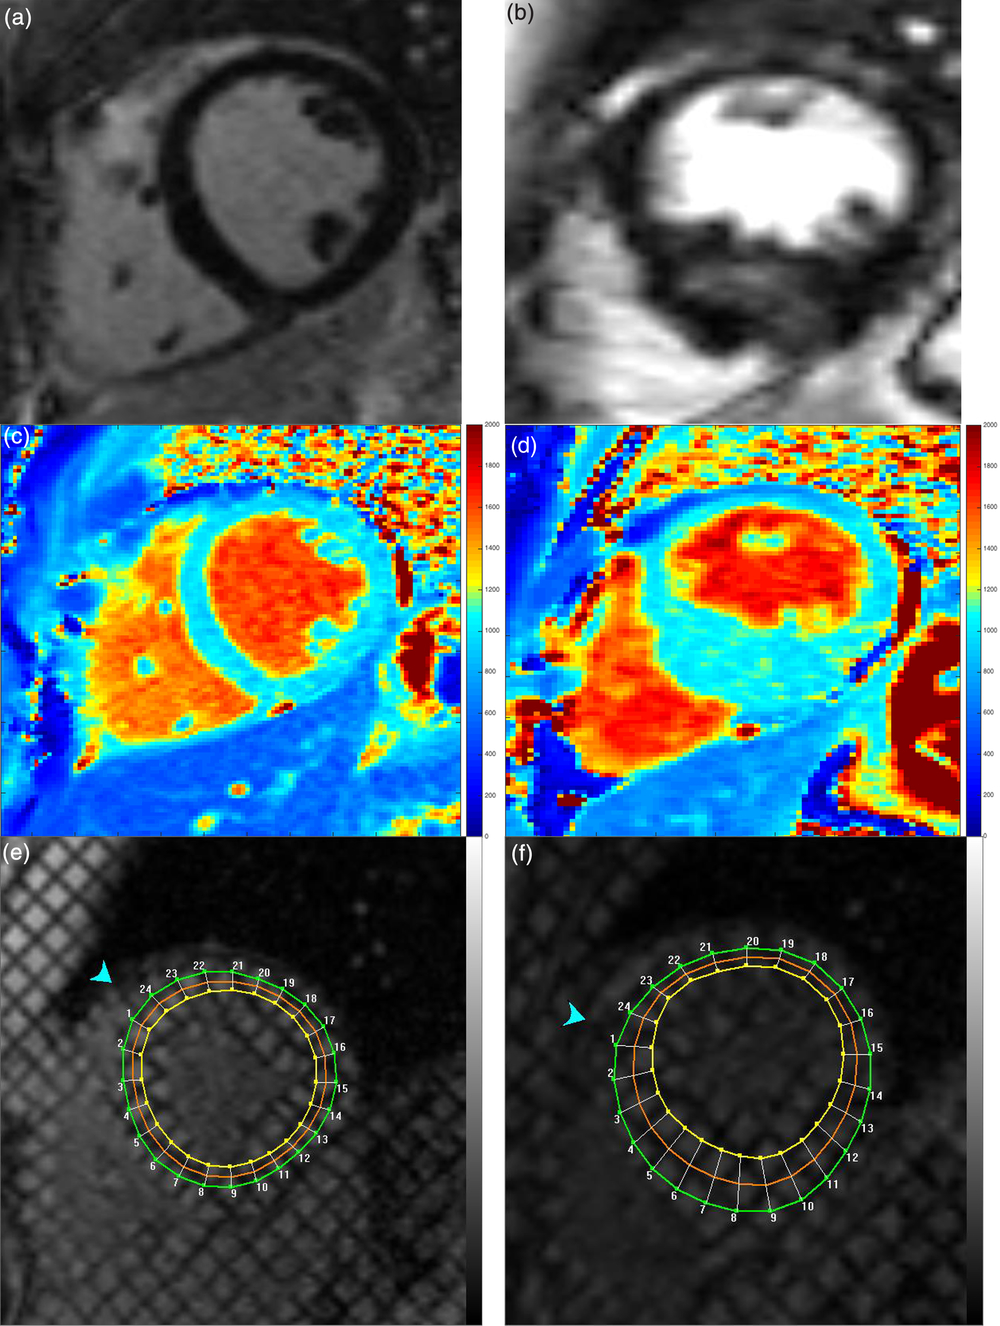
Figure 1. Example in healthy control (left column) and patient with hypertrophic cardiomyopathy (right column). ( a ) and ( b ) late gadolinium enhancement images, ( c ) and ( d ) native T1 maps, and ( e ) and ( f ) tagged images
Native T1 in the area of maximal myocardial hypertrophy was increased compared to the median mid-left ventricle T1 of the control population (1027 ms [1004, 1047] versus 990 [964, 1004], p = 0.001). The partition coefficient and synthetic extracellular volume in the region of maximal hypertrophy were not statistically different between hypertrophic cardiomyopathy and control, suggesting the primary pathology in these regions may be due to myocyte hypertrophy and not extracellular matrix expansion.
Within the hypertrophic cardiomyopathy group, patients with late gadolinium enhancement had significantly increased mid-native T1 compared to those without late gadolinium enhancement; global native T1 was higher but did not reach statistical significance (Table 4 for all results, including basal and apical). The global and mid synthetic extracellular volume were also increased in hypertrophic cardiomyopathy patients with late gadolinium enhancement as were the global and mid partition coefficients (Table 4).
Table 4. Comparison of native T1 mapping, partition coefficient, and synthetic extracellular volume in patients with hypertrophic cardiomyopathy with and without late gadolinium enhancement

Within the hypertrophic cardiomyopathy group, left ventricular ejection fraction had a weak inverse correlation with percent late gadolinium enhancement (ρ = −0.39, p = 0.035) and a strong inverse correlation with global native T1 (ρ = −0.63, p = 0.002). Maximal wall thickness correlated with percent late gadolinium enhancement (ρ = 0.63, p < 0.001). Global T1 correlated with percent late gadolinium enhancement (ρ = 0.44, p = 0.041). Global circumferential strain correlated with global T1 (ρ = 0.51, p = 0.019) and indexed mass (ρ = 0.63, p = 0.004) but not with percent late gadolinium enhancement; however, a sub analysis comparing all segments with and without strain demonstrated worse strain in segments with late gadolinium enhancement (−11.1% [−8.1, −14.2] versus −14.9 [−11.0, −17.8], p < 0.001).
Global synthetic extracellular volume and partition coefficient did not correlate with left ventricular ejection fraction (ρ = −0.3, p = 0.211 and ρ = −0.19, p = 0.432) or global circumferential strain (ρ = 0.09, p = 0.723 and ρ = 0.069, p = 0.785). Both global synthetic extracellular volume and partition coefficient correlated with percent late gadolinium enhancement (ρ = 0.51, p = 0.03 and ρ = 0.48, p = 0.039).
Modelling
Univariate logistic regression analysis demonstrated that left ventricular ejection fraction, circumferential strain at the mid-left ventricle, native T1 at the mid-left ventricle, and indexed left ventricular mass were statistically significant in predicting presence of hypertrophic cardiomyopathy (p < 0.05 for all) (Table 5). Percent late gadolinium enhancement, partition coefficient at the mid-left ventricle, and synthetic extracellular volume at the mid-left ventricle were not significant in predicting hypertrophic cardiomyopathy. Six models were evaluated based on univariate regression results and the model with the highest receiver operating characteristic for prediction of hypertrophic cardiomyopathy included left ventricular ejection fraction and native T1 at the mid-left ventricle (p = 0.001 for left ventricular ejection fraction and p = 0.003 for native T1 at mid-left ventricle); this model had an area under the receiver operating characteristic curve of 0.91 (Fig 2a). However, a scatterplot displaying the predicted probabilities for this model demonstrated some overlap between patients with and without hypertrophic cardiomyopathy (Fig 2b).
Table 5. Univariate logistic regression modelling with diagnosis of hypertrophic cardiomyopathy as outcome

Bold values reached our definition of statistical significance, as defined by p < 0.05.

Figure 2. ( a ) Receiver operating characteristic curve for model using left ventricular ejection fraction and native T1 at the mid-left ventricle to predict a diagnosis of hypertrophic cardiomyopathy. ( b ) Scatterplot of model results demonstrates some overlap in patients with and without hypertrophic cardiomyopathy. ( c ) Scatterplot of same model only in patients without late gadolinium enhancement (milder disease) again demonstrates some overlap of patients with and without hypertrophic cardiomyopathy.
Discussion
The primary findings of this study are that hypertrophic cardiomyopathy patients have increased native T1 compared with controls, native T1 correlates strongly with global circumferential strain and left ventricular ejection fraction, and modeling using multiple cardiac imaging markers may aid in diagnosis of hypertrophic cardiomyopathy.
While native T1 mapping correlated strongly with circumferential strain and left ventricular ejection fraction, the partition coefficient and synthetic extracellular volume did not. Even in the thickest areas of pathologic hypertrophy, partition coefficient and synthetic extracellular volume were not significantly increased compared with controls. These findings may reflect an overall mild phenotype in this cohort, which would also be supported by the relatively low percent late gadolinium enhancement. As expected, the native T1, partition coefficient, and synthetic extracellular volume were increased in hypertrophic cardiomyopathy patients with late gadolinium enhancement. However, native T1 mapping detects abnormalities of both the extracellular matrix and the myocytes, while partition coefficient and synthetic extracellular volume are more specific for extracellular matrix expansion.Reference Swoboda, McDiarmid and Erhayiem 22 We hypothesise that the increased native T1 times are primarily reflecting underlying structural abnormalities in the myocytes, not the extracellular matrix. Indeed, a study by Swaboda et al used multivariable modelling in adult hypertrophic cardiomyopathy patients to demonstrate a correlation between native T1 and myocardial mechanics but not extracellular volume fraction, suggesting that the structural abnormalities resulting in impaired function were cellular.Reference Swoboda, McDiarmid and Erhayiem 22
Previous studies in adult hypertrophic cardiomyopathy have demonstrated a statistically significant difference in native T1 between hypertrophic cardiomyopathy and controls.Reference van den Boomen, Slart and Hulleman 23 Indeed, some reports have suggested that native T1 can be used to distinguish between patients with and without hypertrophic cardiomyopathy.Reference Hinojar, Varma and Child 24 , Reference Puntmann, Voigt and Chen 25 The only paediatric study of which we are aware also demonstrated a significant difference between hypertrophic cardiomyopathy and controls.Reference Parekh, Markl, Deng, de Freitas and Rigsby 26 While use of native T1 in isolation predicts a diagnosis of hypertrophic cardiomyopathy, there was significant overlap between groups. A model combining native T1 with left ventricular ejection fraction provided the highest area under the curve for diagnosis of hypertrophic cardiomyopathy. It is possible that a more comprehensive model that also includes circumferential strain and indexed left ventricular mass would improve segregation of groups, though we were unable to adequately evaluate a more comprehensive model due to sample size limitations.
Partial volume averaging, particularly at the apex or base, can lead to inaccuracies in T1 maps.Reference Messroghli, Moon and Ferreira 27 While we repeated and/or eliminated poor-quality maps, these data could skew the results at these slices. Of note, the model only included T1 mapping at the mid-left ventricle, so is much less likely to be affected by partial volume averaging.
Our patient cohort only included four patients who were genotype positive and phenotype negative, and it is unclear whether this model can distinguish between patients with milder forms of hypertrophic cardiomyopathy and other causes of left ventricular hypertrophy. Evaluation of model performance in patients without late gadolinium enhancement demonstrated relatively good separation between hypertrophic cardiomyopathy and control (Fig 2c), but future studies should be performed comparing mild hypertrophic cardiomyopathy to patients with other causes of left ventricular hypertrophy. While this model is promising, the small sample size necessitates validation in a larger cohort of patients before using clinically. Our intent is to use this model as pilot data for future analyses of larger cohorts of patients with hypertrophic cardiomyopathy. We caution the use of this model in clinical practice at this time.
Left ventricular ejection fraction, indexed left ventricular mass, native T1, and circumferential strain are of particular interest for hypertrophic cardiomyopathy diagnosis because all measures can be obtained without the use of contrast, allowing for shorter scan times and decreasing exposure to gadolinium. Moreover, these measures provide a combination of structural and functional measures for diagnosis. Further studies in a larger cohort could help clarify the diagnostic utility in patients with mild disease and allow for expansion of the number of predictors, potentially improving the model results. These studies should include patients with other causes of hypertrophy, such as hypertension or athlete’s heart, to further evaluate whether native T1 can effectively distinguish between patients with and without hypertrophic cardiomyopathy.
Limitations
This study is limited by a small sample size. In addition, only a small number of patients had haematocrit values drawn at the same time as the cardiac MRIs, so calculation of the extracellular volume was not possible. We elected to use a locally derived model to calculate synthetic extracellular volume. While our previous data suggested that synthetic extracellular volume can lead to clinical errors in individual patients, our data demonstrated that synthetic extracellular volume correlates well with extracellular volume and can be used in research cohorts such as this one.Reference Raucci, Parra and Christensen 20 Given the difficulty in obtaining paediatric control values, particularly for extracellular volume, our age and gender distribution did not match perfectly between hypertrophic cardiomyopathy and controls.Reference Rosmini, Bulluck and Captur 28 Per protocol, the modified Look-Locker inversion recovery sequences were performed in one slice at the base, mid-left ventricle, and apex. Because of this, it was possible that the thickest segment on the T1 maps did not perfectly correspond to the patient’s thickest segment on cine imaging. Placement of modified Look-Locker inversion recovery sequences through the segments with largest pathological hypertrophy could increase the difference we detected between native T1 of the thickest segments and controls.
Some patients with hypertrophic cardiomyopathy did not have either basal (n = 7) or apical (n = 8) T1 mapping analysed as the maps were either not performed or were inadequate. These patients were included in the analysis for all available slices but the missing data could have skewed the results. The change in contrast agents, which have different relaxivity, may have affected late gadolinium enhancement or extracellular volume assessment but was unavoidable as the contrast change was made institution-wide. While some studies suggest that late gadolinium enhancement is more apparent with Gadovist than Magnevist, others suggest similar images for the two contrast agents.Reference De Cobelli, Esposito and Perseghin 29 – Reference Liu, Ma and Liu 31 Though there are minimal available data comparing extracellular volume values with Gadovist and Magnevist, the extracellular volume appears to be relatively contrast independent, with no significant difference or differences of questionable clinical significance between contrast agents.Reference Kawel, Nacif and Zavodni 32 – Reference Kawel, Nacif and Zavodni 34
Conclusions
In this cohort of hypertrophic cardiomyopathy, native T1 was increased in hypertrophic cardiomyopathy compared with control. Native T1 also correlated with circumferential strain, suggesting a relationship between structural and functional abnormalities in paediatric hypertrophic cardiomyopathy. A model including left ventricular ejection fraction and native T1 may aid in the diagnosis of children with hypertrophic cardiomyopathy.
Acknowledgements
The authors would like to acknowledge the developers of the pulse sequence and reconstruction software: Bruce Spottiswoode, Andreas Greiser, Hui Xue, Christopher Glielmi, Shivraman Giri, and Randall Kroeker.
Author Contributions
SS, JHS, and DAP conceived and designed the study, acquired, analysed, and interpreted the data, and drafted the manuscript. KGD, KC, FJR, JC, and JDC helped with data collection and analysis and critically reviewed the manuscript. MX and JCS helped perform statistical analysis and critically reviewed the manuscript. All authors read and approved the final manuscript.
Financial Support
Research reported in this publication was supported by the National Heart, Lung, and Blood Institute of the National Institutes of Health under Award Number K23HL123938 (Bethesda, MD, USA) (Soslow). The content is solely the responsibility of the authors and does not necessarily represent the official views of the National Institutes of Health.
The project described was supported by CTSA award No. UL1 TR002243 from the National Center for Advancing Translational Sciences. Its contents are solely the responsibility of the authors and do not necessarily represent official views of the National Center for Advancing Translational Sciences or the National Institutes of Health.
This work was supported by Haley’s Heart Foundation.
Conflicts of Interest
None.
Ethical Standards
The authors assert that all procedures contributing to this work comply with the ethical standards of the relevant national guidelines on human experimentation and with the Helsinki Declaration of 1975, as revised in 2008, and has been approved by the Vanderbilt Institutional Review Board.


