


Assessment of right ventricular size and function is an important part of the clinical cardiac evaluation; however, quantitative measures using traditional transthoracic echocardiography are challenging.Reference Lai, Geva and Shirali 1 The latest guidelines published by the American Society of Echocardiography encourage the use of quantitative measures in right ventricular evaluation as a practice standard in paediatrics.Reference Lopez, Colan and Frommelt 2 The prognostic and therapeutic values of quantitative right ventricular analysis in patients with heart disease have been well established in the adult literature,Reference Saguner, Vecchiati and Baldinger 3 , Reference Leong, Höke and Delgado 4 with emerging evidence in those with CHD.Reference Mahle, Coon and Wernovsky 5 – Reference Van der Zwaan, Geleijnse and McGhie 9 Quantitative approaches are based on manual measurements consisting of two-dimensional images for linear tracing of chamber dimensions, chamber area by endocardial border tracing, and M-mode images for tricuspid annular plane systolic excursion. These manual measures are time-intensive and vary with experience of the observer.Reference Bleeker, Steendijk and Holman 10 – Reference Kopecna, Briongos and Castillo 14 Although there is clear support for their use, in clinical practice these measures are often replaced with qualitative commentary that may be experience-dependent and vulnerable to significant subjectivity.Reference Lopez, Colan and Frommelt 2 , Reference Davlouros, Niwa and Webb 6
Automated software that can accurately generate quantitative measures would make these measures more readily available to the clinician. Numerous automated software programs designed for left ventricular analysis have been developed and testedReference Michalis, Thomas and Jewitt 15 – Reference Rahmouni, Ky and Plappert 18 ; however, literature on the use of automated right ventricular analysis tools is limited in both the adultReference Oe, Gorcsan and Mandarino 19 – Reference Greiner, André and Heimisch 21 and paediatric populations.Reference Mahle, Coon and Wernovsky 5 , Reference Kimball, Witt and Khoury 22 , Reference Helbing, Bosch and Maliepaard 23 EchoInsight® (Epsilon Imaging, Ann Arbor, Michigan, United States of America) was selected because of its specific right ventricle application and automated potential.Reference Gao, Bortman and Mahmood 24 This software employs speckle-tracking technology to monitor myocardial movement through the cardiac cycle, generating numerous measures simultaneously with minimal user input. The right ventricle application of this software has been tested in adults with compelling resultsReference Medvedofsky, Addetia and Hamilton 25 ; however, it has never been tested in paediatrics. This study aimed to validate the use of EchoInsight® in children with normal intracardiac anatomy by assessing its ability to produce semi-automated measurements of the right ventricle comparable to standard manual measurements.
Materials and methods
Subjects
This study was approved by the Institutional Review Board of Advocate Health Care. We prospectively enrolled children referred for a screening echocardiogram categorised into five age groups: birth-2 months, 2 months 1 day-12 months, 12 months 1 day-4 years, 4 years 1 day-12 years, 12 years 1 day-17 years 11 months. Those with normal results were included; children with CHD were excluded. Demographic data were obtained including biophysical measures, race and ethnicity, gestational age for infants less than 12 months, and indication for the transthoracic echocardiogram. Biophysical measures were referenced to published percentiles of weight, height/length, weight-for-length, and body mass index obtained from an online source (PediTools.com).
Transthoracic image acquisition
All transthoracic echocardiograms were performed using either the iE33 or the EPIQ 7 ultrasound system (Philips Healthcare, Andover, Massachusetts, United States of America). Images were reviewed on a Merge Cardio Workstation (Merge Healthcare, Chicago, Illinois, United States of America). Transthoracic echocardiograms were reviewed for completeness, and to ensure right ventricular imaging was adequate (minimum 30 frames per second). A single cardiac cycle of an apical four-chamber view and an M-mode through the lateral tricuspid annulus was required for analysis. Those with inadequate or incomplete imaging for right ventricular analysis were excluded.
Manual reference measurements
Manual measurements were performed according to recommendations of the American Society of Echocardiography for the performance of a paediatric echocardiogramReference Lopez, Colan and Frommelt 2 :
End-diastolic area and end-systolic area: End-diastole was defined as the frame in which the tricuspid valve closes, and end-systole was defined as the frame immediately preceding tricuspid valve opening (result given in centimeters squared). Right ventricular endocardial border was traced for both end-diastolic and end-systolic phases between the trabeculae and the compacted myocardium.
Right ventricular fractional area change: Calculated as end-diastolic area minus end-systolic area, divided by end-diastolic area, and multiplied by 100 (result given in percentage of end-diastolic area).
Right ventricular dimensions: Basal diameter was measured as the maximal minor-axis dimension in the basal one-third of the right ventricle. Mid-cavity diameter was measured as the middle one-third of the right ventricle at the level of the papillary muscles. Length was measured as the long axis from the tricuspid valve plane to the right ventricular apex (results given in centimeters).
Tricuspid annular plane systolic excursion: M-mode focused on the lateral tricuspid annulus measured as distance moved towards the right ventricular apex (results given in centimeters).
Semi-automated (software-enhanced) analysis
Digital cine loops were analysed using the semi-automated software (EchoInsight®). The software was specifically designed for right ventricular analysis. The selected cine loop was uploaded and processed by the software. The right ventricular endocardial border was then traced by the user at any phase of the cardiac cycle, with manual adjustments for the appropriate thickness of the endocardium. We selected the frame containing closure of the tricuspid valve as a default for the initial trace. After performing an automated endocardial border refinement process, the software employs speckle-tracking technology to monitor frame-by-frame myocardial movement during a single cardiac cycle; it does not utilise the electrocardiogram for the analysis (Supplementary Figure S1). End-diastole is identified by the software as the frame with the largest right ventricular area and end-systole as the frame with the smallest right ventricular area. The software then produces the described measurements of right ventricular size and function (Figs 1–5). There is also an opportunity for the user to “fine tune” the tracing and initiate reanalysis; however, this was intentionally omitted. Any retracing creates entirely new results; there is no averaging by the software.
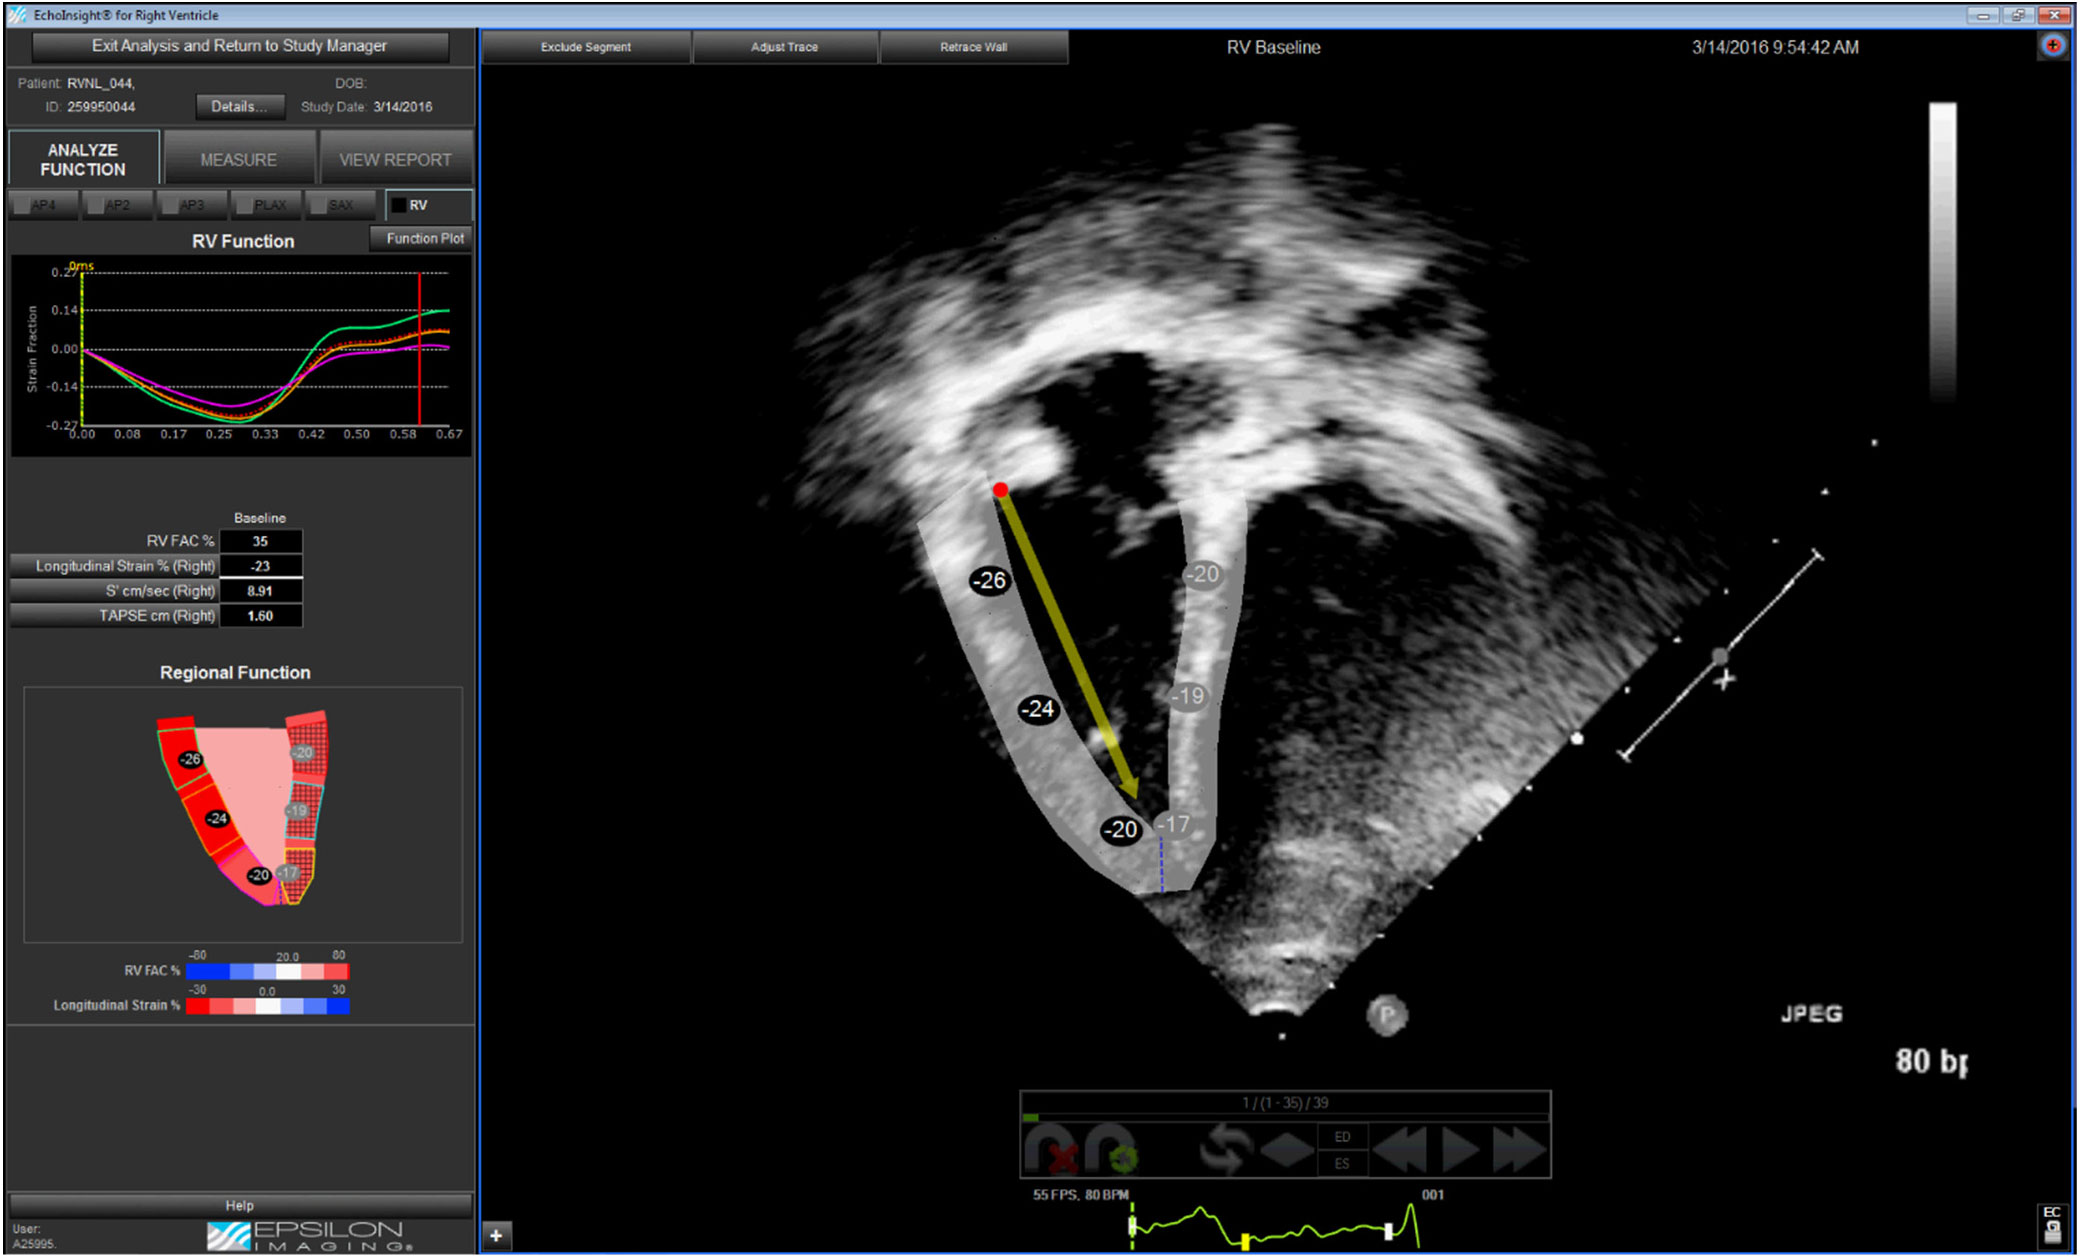
Figure 1. Apical four-chamber view with EchoInsight® tracking of the right ventricular myocardium in end-diastole. This tracking is used to generate tracings of dimensions. The arrow represents the tracking of the direction and displacement of the lateral tricuspid valve hinge used to measure tricuspid annular plane systolic excursion.

Figure 2. Apical four-chamber view with EchoInsight® tracking of the right ventricular myocardium in end-systole.

Figure 3. EchoInsight® tracing of right ventricular end-diastolic area.

Figure 4. EchoInsight® tracing of right ventricular end-systolic area.

Figure 5. EchoInsight® tracing of right ventricular basilar, mid-cavitary, and longitudial dimensions.
Reliability analysis
Images for a randomly selected group of 25 individuals were assessed for reproducibility. Both manual and semi-automated measurements were assessed for intra-observer reliability using measures by the primary observer (A.K.M.) repeated 1 month later and blinded to the first measures. Inter-observer reliability was assessed using the primary observer’s (A.K.M.) measures compared to a second, blinded observer’s (J.L.) measures. Mean differences and intraclass correlations with 95% confidence intervals based on a mixed effects model for absolute agreement were calculated to assess intra- and inter-observer measurement reliability. The intraclass correlation coefficient was chosen as it reflects the degree of correlation and agreement between measures. The intraclass correlation coefficient values reflect the level of reliability between measures, and coefficients over 0.9 and 0.7 are considered acceptable reliability for intra- and inter-observer reliabilities, respectively. Mean relative percent difference, demonstrating rater variability, was calculated as the mean of the ratio of absolute difference to average of each pair of repeated measurements expressed as a percentage.
Statistical analysis
Continuous data are reported as the mean and standard deviation unless specified otherwise. Discrete data are reported as frequencies and percentages. Agreement between the manual (considered the reference measure) and semi-automated measurements was tested using linear regression with Pearson’s correlation and Bland–Altman plots of the mean difference reported as bias.Reference Bland and Altman 26 Agreement between measurements was also reported as mean relative percent difference, calculated as the difference over the mean of the manual and semi-automated measurements for each patient and averaged for the total sample. Positive values for the bias or relative mean difference reflect a larger value from the manual measure and negative values reflect a larger value from the semi-automated measure. Relationships between relative mean difference and age for right ventricular measurements were tested using linear regression reported as R2 statistic reflecting the ratio of variance. All statistical tests were two-sided, unless otherwise specified, and were performed using IBM SPSS version 21.0 (IBM Corp., Armonk, New York, United States of America). Significance level was set as a p value of less than 0.05.
Results
Out of 557 patients identified, 491 (88%) had adequate views of the right ventricle to allow for analysis. None were excluded based on subjective image quality, but 66 were excluded due to inadequate frame rate on the original clip. Additional exclusions were due to abnormal findings (n = 27) or due to incomplete images (n = 231). Incomplete images included tricuspid valve M-mode or tissue Doppler, as S’ measures were initially intended to be included in the analysis. Data on why technicians did not complete the protocol and obtain all views were not collected but could include patient agitation and technician non-compliance. Thus, 233 (42%) patients’ images were eligible for inclusion and analysis. The most common indication for these echocardiograms was murmur (n = 77), chest pain (n = 17), known or suspected Kawasaki disease (n = 13), sickle cell disease (n = 13), suspected CHD not otherwise specified (n = 13), known or suspected arrhythmia (n = 10), systemic hypertension (n = 10), and numerous other indications (each with n < 10, total n = 80).
Demographics
Table 1 shows patient demographic information and basic echocardiographic information. The study population ranged in age from 0 days to 17 years 11 months (mean 5.5 years, standard deviation ± 6.1 years); 104 of 233 patients were female (45%). The patients’ weight ranged from 0.66 to 89.90 kg; body surface area ranged from 0.10 to 2.10 m2. One patient in each of the two oldest age groups was obese (body mass index > 30 kg/m2). All patients had a normal heart rate for age, and normal right ventricular size and function by subjective assessment. Frame rates were higher in the youngest age group, but similar in successive groups. The mean frame rate for the captured images was 50 Hz (standard deviation ± 19 Hz); although due to digital compression, all images were analysed by EchoInsight® at a frame rate of 30 Hz.
Table 1. Demographics and basic echo information

BMI=body mass index; BSA=body surface area; CGA=corrected gestational age. Values listed as mean ± standard deviation. BMI reported for age greater than 4 years. CGA reported for up to age 12 months
Reliability
The results of intra- and inter-observer reliability are shown in Table 2. Intra-observer reliability for the semi-automated method was greater than 0.9 for all measures. Inter-observer reliability for the semi-automated method was also good with all intraclass correlations over 0.87. Manual intra-observer intraclass correlation was also over 0.9 for all measures except for fractional area change (0.73, 95% confidence interval 0.46–0.87). Manual inter-observer reliability was acceptable for all measures (intraclass correlation over 0.76) except for fractional area change which was poor (intraclass correlation 0.28, 95% confidence interval −0.21–0.63). There was no difference in reliability between manual and semi-automated measures except for fractional area change. Intra- and inter-observer reliability for fractional area change was better with the semi-automated method.
Table 2. Intra and inter-observer reliability

EDA=end-diastolic area; ESA=end-systolic area; FAC=fractional area change; ICC=intraclass correlation coefficient; Mid=mid-cavity; RV=right ventricle; TAPSE=tricuspid annular plane systolic excursion
Agreement between methods
Echocardiographic values for the complete sample and within each age category are shown in Table 3. Agreement between manual and semi-automated measurements is shown in Table 4 as Pearson’s correlation and bias based on Bland–Altman plots. The reported bias was represented by the mean difference for each of the listed variables, along with the mean relative percent difference. Correlations for the combined sample were strong between methods for all measures (r > 0.84) except for fractional area change (r = 0.5). Bias was acceptable (3.2–10.8%) for all measures except for fractional area change and tricuspid annular plane systolic excursion, for which the relative difference was large (33.5 and 43%, respectively).
Table 3. Manual and semi-automated analysis

Basal D=basal diameter; EDA=end-diastolic area; ESA=end-systolic area; FAC=fractional area change; Mid D=mid-cavity diameter; RV=right ventricle; semi-auto=semi-automated measurement; TAPSE=tricuspid annular plane systolic excursion. Values listed as mean ± standard deviation. Shaded results consistently overestimate manual measures. Bolded results consistently underestimate manual measures. p values represent the statistical significance of the under/overestimation
Table 4. Manual and semi-automated bias/correlation

EDA=end-diastolic area; ESA=end-systolic area; FAC=fractional area change; RV=right ventricle; TAPSE=tricuspid annular plane systolic excursion. Bias reported as mean difference and percent difference of mean (relative difference). Correlation [R] obtained using Pearson’s ocrrelations test
Direction of difference between measures
In measures that showed low bias and those with larger bias, the difference between manual and semi-automated measures was usually consistent as an over- or underestimation relative to the manual measures. The right ventricular end-systolic area showed a significant and consistent overestimation by the semi-automatic measures in most age groups, and right ventricular mid-cavity diameter was overestimated in ages over 4 years. The right ventricular fractional area change, basal diameter, length, and tricuspid annular plane systolic excursion demonstrated a consistent underestimation in all five age groups (p values are noted in Table 3).
Bias between manual and semi-automated methods decreases with age
Relative difference was larger for the measures of right ventricular end-systolic area, fractional area change, basal diameter, length, and tricuspid annular plane systolic excursion within the younger age groups. To examine whether there was a linear trend between age and bias (mean relative percent difference), linear regression models were tested for each right ventricular measure (Table 5). The larger the R2 statistic the greater the amount of variance in bias accounted for by age. Right ventricular fractional area change, length, and tricuspid annular plane systolic excursion have the largest R2 values. Scatterplots of percentage of mean difference and age (Fig 6) demonstrated the amount of variability experienced for the right ventricular fractional area change and tricuspid annular plane systolic excursion measures, particularly for those at younger ages.
Table 5. Relationship between age and percentage of mean difference

EDA=end-diastolic area; ESA=end-systolic area; FAC=fractional area change; RV=right ventricle; TAPSE=tricuspid annular plane systolic excursion

Figure 6. Scatterplots of percentage of mean difference versus age. BASL DIAM=basal diameter; EDA=end-diastolic area; ESA=end-systolic area; FAC=fractional area change; LONG DIMEN=length; MIDCAV DIAM=mid-cavitary diameter; RV=right ventricle; TAPSE=tricuspid annular plane systolic excursion.
Discussion
In a single-centre prospective study, we tested a commercially available software program capable of semi-automated right ventricular analysis in a cohort of children with normal cardiac structure and function to validate its use in the paediatric population. We found good correlation and low percent bias between manual and semi-automated measures of right ventricular dimensions. Fractional area change and tricuspid annular plane systolic excursion had larger differences between manual and semi-automated evaluation though these differences decreased with age.
A similar study by Medvedofsky et al was conducted using the same semi-automated software in adults and found good correlation between the semi-automated and manual methods for right ventricular dimensions.Reference Medvedofsky, Addetia and Hamilton 25 Fractional area change and tricuspid annular displacement had lower correlations (r = 0.7–0.74) with larger bias (up to 22%). This is similar to our data in that the dimension measures match well and functional measures have more variability between methods of measurement. They also found 90% of images could be analysed by the software, which is very similar to the 88% found in our study.
In Medvedosky’s study, one advantage they found in the semi-automated method was that all measures were performed in 30 seconds, whereas manual measures took 4 minutes.Reference Medvedofsky, Addetia and Hamilton 25 This aspect was intentionally omitted from our data collection in effort to focus purely on validity of the semi-automated analysis. It seems unlikely that significantly different timing of analysis would be obtained in children. It should also be noted, in that study, as in ours, adjustments were not made to the computer-generated trace to assess the algorithms’ ability to measure with minimal input. This approach may have limitations in paediatrics where smaller structures at higher heart rates lead to amplification of any small differences in measurement. Measure of smaller hearts may have led to worse average correlation for fractional area change and tricuspid annular plane systolic excursion in our study. The correlation and bias improved in each age group with the oldest age groups approaching those in the adult study. Given these data, it may be necessary to adjust the tracings for more accurate measures when using the semi-automated software, especially in younger patients.
Even with adjustment, right ventricular fractional area change may continue to show the most variation between methods as it has been shown to have high intra- and inter-observer variability.Reference Knight, Schwaiger and Krupickova 27 The poor correlation of fractional area change despite good correlation of right ventricular area measurements can be explained by a calculation error, with small differences in area being compounded in the product of the formula. This is particularly problematic in the smallest patients where small differences in area measurements lead to higher errors in the calculation of fractional area change. Similarly, a few millimeters difference in tricuspid annular plane systolic excursion is significant in small children, and we saw larger bias in this group with improvement in older age groups.
Reliability is important for these measures, and the semi-automated method had good reliability for all measures for both intra- and inter-observer reliability. The semi-automated method was statistically significantly better for fractional area change than reliability for the manual method, which could be an important advantage. The manual measures for inter-observer reliability were poor and were a limitation of this study. This can be partially explained by the small size of many patients’ hearts and sub-optimal views of the right ventricular endocardium. However, inter-observer reliability must be addressed in studies moving forward to validate our findings. Strengths of this study were the intra-observer reliability and the consistency achieved by the primary observer performing all measures used in analysis.
The semi-automated measures were consistent in their variance to manual measures, either larger or smaller, for fractional area change, tricuspid annular plane systolic excursion, and multiple right ventricular dimensions. This shows consistency in the way in which measures were performed. For most measures, the bias was small. However, our findings from measures of tricuspid annular plane systolic excursion and fractional area change highlight a need for future research. For instance, right ventricular end-systolic area was usually overestimated, which may have led to the underestimation of fractional area change for the semi-automated methods. Adjusting the trace for end-systolic area could help improve agreement in future studies.
Future directions
Additional validation should be done to optimise the use of the semi-automated analysis, specifically when measuring the right ventricle in children. Our findings suggest several areas that can be optimised for future paediatric measurements. Manual adjustment of tracings is advised, as discussed above, and should not add much time to a single analysis. The adjustment can be done for right ventricular areas and to manually adjust the direction of the tricuspid annular plane systolic excursion measurement (towards the apex of the image) to mimic manual measures. This was not done in our study to keep the process as automated as possible but should be used in future studies. Frame rates of 50 Hz or more are recommended for this software; however, all analysis was done at 30 Hz as a result of image compression that occurred when clips were exported from our server for analysis. Frame rate should be considered when using this software, particularly for paediatric analysis where better tracking can be achieved with higher frame rates in patients with higher heart rates.
While the intent of this study was to validate its ability to replicate manual measurements, future studies may consider comparison to cardiac MRI in order to assess the accuracy of the semi-automated software. This would require significant financial support and added levels of consent, especially for younger patients who would require sedation or general anesthesia and endotracheal intubation to complete the procedure.
Limitations
Although 88% of acquisitions were adequate to perform semi-automated analysis, only 42% were acceptable for inclusion due to incomplete images for manual measurements needed for complete comparison. Numerous technicians with variable experience completed the original imaging studies. Despite being trained to follow to a standard protocol, many exclusions were attributed to incomplete images and even those with complete images had some sub-optimal imaging. This presents an opportunity for quality improvement to ensure completeness and quality imaging specific to the right ventricular echocardiogram. Better imaging may also help improve reliability for manual measurements, which is important for future studies.
Manual tricuspid annular plane systolic excursion measurements were performed using a lateral tricuspid annulus M-mode acquisition, whereas the semi-automated tricuspid annular plane systolic excursion measure utilised the selected two-dimensional cine clip. For some patients, these clips were obtained during different parts of the study. The angle may have changed between clips and thus caused variation between clips used for manual versus semi-automated analysis.
Conclusions
The semi-automated software (EchoInsight®) was capable of generating multiple measures of right ventricular dimensions with good reliability that were similar to those generated by manual measurements. Right ventricular fractional area change and tricuspid annular plane systolic excursion had larger differences between manual and semi-automated evaluation, though these differences decreased with age. The semi-automated software had adequate intra- and inter-observer reliability and had superior reliability compared to manual measurement in this study. This semi-automated software (EchoInsight®) offers an acceptable alternative to manual measurements for right ventricular dimensions. Future studies that involve modification of semi-automated tracings may improve semi-automated performance of functional indices.
Author ORCIDs
Aron McCloud 0000-0003-0875-8986
Acknowledgements
The authors extend sincere gratitude for the support of the Advocate Children’s Heart Institute, the Advocate Center for Pediatric Research, and the Advocate Children’s Hospital cardiac sonographer team in completing this project.
Financial Support
This research received no specific grant from any funding agency, commercial, or not-for-profit sectors.
Conflicts of Interest
None.
Ethical Standards
This study was approved by the Institutional Review Board of Advocate Health Care (IRB number 6293) with appropriate waiver of consent.
Supplementary material
To view supplementary material for this article, please visit https://doi.org/10.1017/S1047951119001641


