


Milrinone is a phosphodiesterase III inhibitor that induces pulmonary and systemic vasodilation and improves diastolic heart function without increasing myocardial oxygen consumption. Reference Giaccone, Zuppa and Sood1 Milrinone is often used in adults and children with decompensated heart failure, but is only approved by the United States Food and Drug Administration for use in adults. 2 Despite lack of approval in children and limited safety data, milrinone is often used off-label for pulmonary hypertension, decompensated heart failure, and shock with vasoconstriction. Reference Bishara, Seto, Trope and Parshuram3–Reference Lindsay, Barton and Lawless5
Previously published adult literature regarding milrinone commonly cite plasma concentrations >500 ng/ml to be associated with adverse events. These rare adverse events include hypotension, arrhythmia, and thrombocytopenia. Reference Cox, Calcutt, Morrison, Akers, Davis and Lenihan6–Reference Young and Ward8 Studies characterising the pharmacokinetics of milrinone have been performed in neonates and children; however, these studies were not intended, nor large enough, to detect dosing and exposure relationships to rare adverse events. Reference Giaccone, Zuppa and Sood1,Reference Lindsay, Barton and Lawless5,Reference Hornik, Yogev and Mourani9–Reference Hallik, Ilmoja and Tasa16 Hypotension is a rare adverse event that may be related to systemic exposure of milrinone, but the true exposure–safety relationship in children is unknown. This knowledge gap is primarily due to difficulties measuring systemic exposures and the need for sufficiently large patient cohorts to detect these rare adverse events.
An alternate approach to large drug trials that is both feasible and cost effective is utilising previously developed population pharmacokinetic models to predict individual drug exposures in a cohort extracted from the electronic health record. Electronic health record data have been previously used to characterise dose–safety relationships of drugs in children, but exposure assessments remain limited predominantly to medications undergoing routine therapeutic drug monitoring with invasive plasma concentration measurement. Reference Ku, Wu and Greenberg17
In this study, we leverage the available dosing and clinical data from a multicentre electronic health record-derived repository and a paediatric population pharmacokinetic model developed from opportunistically collected pharmacokinetic data to predict exposures in children treated with milrinone. Reference Hornik, Yogev and Mourani9 We then use these predicted exposures to characterise their relationship with safety data and systemic hypotension, which were collected in the electronic health record.
Methods
Data source and formatting
This study was approved by the Duke Institutional Review Board with a waiver of informed consent. From a previously developed multicentre electronic health record-informed real-world data registry, Reference Hornik, Atz and Bendel18 we identified all children 17 years of age or younger treated with intravenous infusion doses of milrinone. The repository was created from nine sites around the United States with 386,159 inpatient encounters from 264,709 children using the Patient-Centered Clinical Research Network data model. We defined an encounter as a course of uninterrupted milrinone infusion. The period of observation was time from the start of milrinone infusion through its discontinuation, pause, or interruption, plus a follow-up period, ending at the initiation of a milrinone subsequent administration, up to 24 hours. We also recorded any bolus doses of milrinone received during an encounter. For subsequent analysis, only the first encounter was retained for each admission. We extracted demographic data, including gestational age, postnatal age, gender, weight, height, and the closest serum creatinine value, measured before the time of milrinone administration from the electronic health record for each subject. If multiple assessments of weight and height were collected during an admission, the result closest to the encounter start time was used. Baseline values were defined as the last value prior to the start of the observation period, no more than 12 hours prior. For each dose, we extracted the infusion rate (mcg/kg/min), duration of infusion (min), total dose (mcg/kg), and the time and date of infusion. Milrinone dosing information for all encounters was harmonised to mcg/kg/min for infusions and mcg/kg for bolus doses. Subjects with missing dosing parameters, weight, demographics, or those without an available baseline serum creatinine value before dosing with milrinone were excluded from the analysis, and we did not impute any clinical data. We estimated creatinine clearance using the modified Schwartz equation. Reference Schwartz and Work19
We collected all systolic and diastolic blood pressure measurements (in mmHg) during milrinone infusion and up to the first four hours of the follow-up period, as well as date and time of assessment. Dates and times of blood pressure measurement recorded in the electronic health record were also extracted and used as the time points for exposure simulation. A blood pressure measurement immediately prior to milrinone administration was used as a baseline to compare subsequent changes in blood pressure. Hypotension was defined according to age, using the Pediatric Advanced Life Support guidelines. Reference Kleinman, Chameides and Schexnayder20 We defined minimal systolic and diastolic blood pressure as the lowest values recorded during the observation period. We defined clinically significant hypotension as hypotension (as defined above) that occurred within the same time point as a serum lactate of >3 mg/dl. Patients who did not have a lactate value drawn during the observation period had the closest lab value drawn to the time observed used instead.
Exposure simulation
A previously developed population pharmacokinetic model for milrinone in children under 21 years of age Reference Hornik, Yogev and Mourani9 was used to simulate exposures in the subjects extracted from the electronic health record. The prior study was a multi-centre study that included 74 patients with 111 opportunistically collected plasma samples. The model equations are provided in the Supplementary Methods.
For the purpose of simulation, fixed- and random-effect parameters were fixed to the final model estimates. Predicted milrinone plasma concentrations at each assessment of blood pressure were chosen to represent drug exposure. Individual simulated concentrations incorporated both the effects of clinical characteristics included as covariates in the pharmacokinetic model and the effect of remaining interindividual variability. A sensitivity analysis was also performed wherein population predictions that ignore remaining interindividual variability were used. We chose plasma concentrations at time of blood pressure measurement as exposure targets because prior studies have suggested safe plasma concentrations of 100–300 ng/ml in children after cardiac surgery and mean plasma concentrations >500 ng/ml to be associated with adverse events in adults. Reference Cox, Calcutt, Morrison, Akers, Davis and Lenihan6,Reference Garcia Guerra, Joffe, Senthilselvan, Kutsogiannis and Parshuram11 All exposure simulations were performed using NONMEM (version 7.4.3, ICON Development Solutions, Ellicott City, MD) with run management performed using Pirana (version 2.3.8). Reference Keizer, van Benten, Beijnen, Schellens and Huitema21
Statistical analysis
Standard summary statistics, including counts (percentages), medians (quartile 1, quartile 3), and graphing techniques, were used to characterise all study variables. When applicable, chi-square, Fisher’s exact, and Wilcoxon rank sum tests were used to compare categorical and continuous variable distributions between groups. We stratified unadjusted analyses by age, time after dose, and clinically relevant variables, including level of respiratory support received at the time of drug administration and plasma lactate concentrations as surrogate markers for inadequate tissue oxygen delivery at the time of milrinone dosing. We performed linear and logistic regressions to evaluate subject-level relationships between exposure measurements and systolic or diastolic blood pressure, change in systolic or diastolic blood pressure, or hypotension, adjusting for subject postnatal age, weight, height, and sex. We performed all statistical analyses using Stata 15.1 (College Station, TX, USA) and defined statistical significance as a p-value < 0.05.
Results
We included 399 children with a median (interquartile values [IQV]) postnatal age of 1 year (0, 5) who received 428 intravenous doses of milrinone. The median infusion rate of milrinone was 0.31 mcg/kg/min (0.29, 0.49) (Table 1). The median duration of infusion was 67.7 hours (24.8, 139.8). The median simulated individual plasma concentration of all milrinone concentrations was 80.3 ng/ml (35.8, 148.6) at a median of 10.5 hours (4.8, 17.3) after the first dose. The median value of the highest plasma concentration of milrinone achieved was 110.7 ng/ml (48.4, 206.2). There were 52/399 (13%) and 16/399 (4%) subjects with simulated maximum plasma concentrations greater than 300 ng/ml and 500 ng/ml, respectively. The maximum simulated plasma concentrations were statistically higher as infusion rate increased (Table 1, p < 0.001). Median serum creatinine was 0.41 mg/dl (0.29, 0.59), and median estimated creatinine clearance was 107 ml/min/1.73 m2 (50, 145). Only 6/399 (2%) subjects met the Food and Drug Administration definition of severe renal impairment and had an estimated creatinine clearance of less than 30 ml/min/1.73 m2.
Table 1. Demographic data and drug dosing of subjects exposed to milrinone.
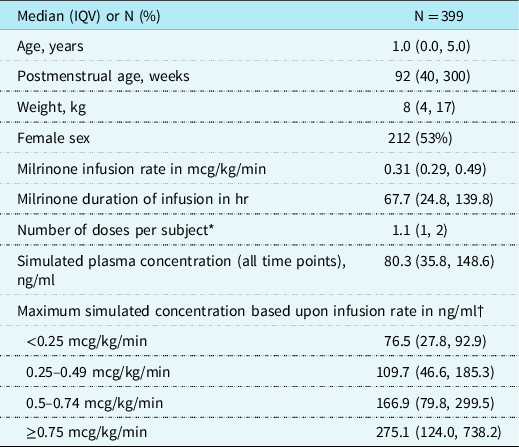
* Doses per subject include bolus doses or adjustments of infusion rates.
† p < 0.001.
IQV = interquartile value.
Median baseline (IQV) systolic and diastolic blood pressures were 94 mmHg (77, 105) and 55 mmHg (46, 62), and 3/399 (0.75%) subjects met the definition of hypotension at the time of milrinone initiation (Table 2). The median (IQV) of the lowest systolic and diastolic blood pressures recorded for each subject over the study period were 74 mmHg (60, 85) and 35 mmHg (25, 42), respectively. The median (IQV) change in systolic blood pressure was 0 (−9, 9) and median change in diastolic blood pressure was −2 (−12, 7). At least one episode of hypotension occurred in 178/399 (45%) subjects. Unadjusted scatter plots did not show a significant association between simulated plasma concentrations of milrinone and systolic or diastolic blood pressure (Fig 1). Plots were similar when repeated in a subset of infants (<1 year of age) (Fig 2). All results were similar when plotting population instead of individual predictions (data not shown). Eight percent of hypotensive subjects received a bolus dose within 24 hours of infusion initiation vs. 6% of subjects who did not have hypotension (p = 0.424). The median duration infusion [IQV] was not statistically different between subjects who became hypotensive (70.48 hours [18.68, 42.60]) versus those who did not (58.05 hours [28.48, 133.98], p = 0.99). Similarly, the rate of infusion did not significantly differ between subjects who became hypotensive (0.31 [0.30, 0.50]) versus those who did not (0.30 mcg/kg/min [0.29, 0.45], p = 0.11).
Table 2. Blood pressure data of subjects exposed to milrinone

IQV = interquartile value

Figure 1. Association between simulated milrinone plasma concentration and systolic and diastolic blood pressure. ( a ) All simulated milrinone plasma concentrations versus concomitant systolic blood pressure; ( b ) all simulated milrinone plasma concentrations versus concomitant diastolic blood pressure; ( c ) all simulated milrinone plasma concentrations versus concomitant absolute change in systolic blood pressure from baseline; ( d ) all simulated milrinone plasma concentrations versus concomitant absolute change in diastolic blood pressure from baseline. Milrinone plasma concentrations cut-offs previously associated with efficacy are shown with horizontal red dashed lines.

Figure 2. Association between simulated milrinone plasma concentration and systolic and diastolic blood pressure in infants <1 year of age. ( a ) All simulated milrinone plasma concentrations versus concomitant systolic blood pressure; ( b ) all simulated milrinone plasma concentrations versus concomitant diastolic blood pressure; ( c ) all simulated milrinone plasma concentrations versus concomitant absolute change in systolic blood pressure from baseline; ( d ) all simulated milrinone plasma concentrations versus concomitant absolute change in diastolic blood pressure from baseline. Milrinone plasma concentrations cut-offs previously associated with efficacy are shown with horizontal red dashed lines.
A mixed linear regression with random intercept model was run and did not reveal an association between milrinone concentration and systolic blood pressure (slope coefficient 0.0014, 95% confidence interval [CI; −0.002, 0.005], p = 0.4), but did reveal a small inverse association with diastolic blood pressure (slope coefficient −0.0063, 95% CI [−0.0096, −0.0031], p > 0.001). When the model was run to examine an association with milrinone concentration and change in systolic and diastolic blood pressure, both had a small, but statistically significant inverse relationship (systolic: slope coefficient −0.008, 95% CI [−0.015, −0.001]) (diastolic: slope coefficient −0.015, 95% CI [−0.024, −0.007). Predicted milrinone plasma concentrations did not differ between times of hypotension relative to those without hypotension (Fig 3). We also did not observe a significant difference in measured systolic or diastolic blood pressure when predicted milrinone plasma concentration was above the therapeutic threshold of 300 ng/ml (Fig 4). We did not observe higher maximum plasma concentrations of milrinone in subjects without hypotension at baseline who became hypotensive (median 92 ng/ml IQV [47, 186]) compared to those who maintained normal blood pressure throughout (122 ng/ml [57, 207]), p = 0.16). Similarly, the proportion of subjects with hypotension did not differ between those whose simulated milrinone concentrations exceeded the toxicity threshold of 500 ng/ml and those whose did not (7/16 [44%] vs. 171/383 [45%], p = 0.99). There were no incidences of clinically significant hypotension in patients whose simulated milrinone concentration exceeded the toxicity threshold of 500 ng/ml. In multivariable regression adjusted for postnatal age, the highest simulated milrinone plasma concentration was not associated with the occurrence of hypotension (odds ratio [OR] 0.9994, 95% CI [0.9980, 1.0008]), nor was there an association between plasma concentration and progression of normotension to hypotension (OR 0.9995, 95% CI [0.9981, 1.0009]).

Figure 3. Distribution of simulated milrinone plasma concentrations by presence or absence of systolic hypotension. The box represents 25th and 75th percentiles of the distribution, with the median displayed as a solid line within the box. The whiskers are 1.5× the interquartile range of the distribution, and outliers outside of the whiskers are omitted from the plot to improve clarity. The horizontal solid red lines display milrinone plasma concentrations previously associated with efficacy. IPRED = individual predicted concentrations.

Figure 4. Measured ( a ) systolic and ( b ) diastolic blood pressure during times with versus without simulated milrinone plasma concentrations above the therapeutic threshold of 300 ng/ml. The box represents 25th and 75th percentiles of the distribution, with the median displayed as solid line within the box. The whiskers are 1.5× the interquartile range of the distribution, and outliers outside of the whiskers are omitted from the plot to improve clarity. The horizontal solid red lines display systolic and diastolic blood pressure cut-offs of 70 mmHg and 30 mmHg, respectively, which will commonly represent clinically significant hypotension.
Finally, we compared milrinone exposures between children with episodes of clinically significant hypotension. This combination of findings occurred in only 10/399 (2%) subjects; however, the highest simulated milrinone plasma concentrations were generally higher (median 251 ng/ml, IQV [129, 329]) in subjects with clinically significant hypotension compared to subjects with hypotension without concomitant lactate elevation (86 ng/ml [44, 173]) and subjects who did not suffer an episode of hypotension (122 ng/ml [57, 208], p = 0.002). Nevertheless, the relationship of higher plasma concentrations seen with clinically significant hypotension versus hypotension alone versus no hypotension was not retained in the multivariable analysis (OR 1.01 [95% CI; 0.998, 1.01]).
Discussion
We evaluated the relationship between predicted milrinone exposures and hypotension in children by combining data from an electronic health record-derived inpatient data repository with predicted exposures using a previously developed population pharmacokinetic model. We simulated milrinone concentrations within a similar range of values previously reported in this population. Reference Hornik, Yogev and Mourani9 While we did not find a significant relationship between simulated exposures of milrinone and hypotension, we successfully evaluated the feasibility of this alternate design to characterize exposure–safety relationships. This novel study design is cost-effective, efficient, and minimizes risk by applying models to existing data and reducing the need for prospective plasma sampling and supplementing post-market surveillance studies in children.
Systemic hypotension is a clinically significant and well-described adverse event associated with milrinone administration in adults and children. Reference Ramamoorthy, Anderson, Williams and Lynn15,22,Reference Nanimatsu, Saikawa, Maeda, Fukuoka and Takaki23 The largest prospective pediatric trial of milrinone conducted to date enrolled 238 children 0–6 years of age receiving milrinone demonstrated systolic blood pressure decreased by almost 10% within the first 4–8 hours of milrinone infusion at both low and high doses. Reference Hoffman, Wernovsky and Atz13 However, only 2.6% and 1.3% of the children in the high-dose (0.75 mcg/kg/min) and low-dose (0.25 mcg/kg/min) arms, respectively, suffered clinically significant hypotension. This estimate is similar to the prevalence we observed in our cohort, where 9/399 (2%) of children had at least one systolic blood pressure consistent with clinically significant hypotension. Within the context of the clinical trial, clinically significant hypotension was defined based on a combination of blood pressure measurement and need for intervention. This is much different than capturing all recorded systolic blood pressure measurements as was done in our electronic health record-derived data repository. Under the latter circumstances, erroneous measurements, chronically low blood pressures, or intermittent and self-resolved episodes of hypotension related to other patient interventions (e.g., repositioning of critically ill patients or administration of bolus doses of sedation) are all captured. The repository also did not capture all variables needed to define interventions to raise blood pressure, such as intravenous fluid bolus or inotropic medication administration, nor indications for any of these interventions. This could lead to fewer recorded episodes of hypotension, elevated plasma lactate, and clinically significant hypotension. Future analysis could be performed to identify hypotensive episodes associated with interventions to raise blood pressure, to help identify instances of clinically significant hypotension.
Prior studies have characterised a concentration range associated with efficacy (100–300 ng/ml) and showed that greater exposure did not confer further benefit. Reference Bailey, Levy, Kikura, Szlam and Hug10,Reference Baruch, Patacsil, Hameed, Pina and Loh24 Our study did not observe a significant difference in measured systolic or diastolic blood pressure when predicted milrinone plasma concentration was above the therapeutic threshold of 300 ng/ml. In the absence of a comprehensive study evaluating the exposure–safety relationship of milrinone in children, targeting plasma concentrations in the 100–300 ng/ml range may be reasonable. Reference Gist, Mizuno, Goldstein and Vinks12,Reference Mizuno, Gist and Gao25 Although not the aim of our study, our data do not suggest that more aggressive monitoring of plasma exposures through therapeutic drug monitoring or other methods would result in improved safety of milrinone in children as multivariable regression did not retain significance when examining the highest dose of milrinone on clinically significant hypotension (OR 1.01; 95% CI 0.99, 1.02; p = 0.06).
In adult populations, plasma concentrations >500 ng/ml have been associated with increased risk of adverse events, including systemic hypotension. Reference Larsson, Liedholm, Andersson, Keane and Henry14 Nevertheless, particularly in populations with cardiac dysfunction, the interplay between milrinone therapeutic effect, adverse effects, and underlying systemic and cardiovascular physiology, including fluid status and preload, are complex. Reference Garcia Guerra, Joffe, Senthilselvan, Kutsogiannis and Parshuram11,Reference Nanimatsu, Saikawa, Maeda, Fukuoka and Takaki23,Reference Vogt26,Reference Remme, van Hoogenhuyze, Kruijssen, Pieper and Bruggeling27 Since milrinone is both a positive inotrope and systemic vasodilator, it may improve cardiac output and subsequent blood pressure in subjects with abnormally high systemic vascular resistance or abnormal myocardial contractility. Reference Shipley, Tolman, Hastillo and Hess28–Reference Sato30 As a result, large interpatient variability in milrinone exposure, including plasma concentrations greater than 500 ng/ml, has been found in paediatric pharmacokinetic trials without a demonstrable effect on safety profiles. Reference Gist, Mizuno, Goldstein and Vinks12,Reference Mizuno, Gist and Gao25 Our study confirms these findings, with a similar proportion of hypotension observed among the 16/399 (4%) subjects with predicted milrinone concentrations above the 500 ng/ml threshold compared to those who did not meet this threshold, and no episodes of clinically significant hypotension in the 16 subjects with concentrations >500 ng/ml.
Limitations
Studying drug safety based on real-word data, as is done in the context of post-marketing surveillance systems, is a worthwhile endeavour that can yield meaningful data, in addition to the data collected within a clinical trial. Reference Smith, Benjamin and Murphy31 Nonetheless, given the potential generalisability of our approach to other drugs, it is important to highlight some overall limitations. First, despite the obvious differences in data collection and analysis strategies, neither our analysis nor any previously conducted paediatric trials were able to definitely characterise the relationship between milrinone exposure and the occurrence of systemic hypotension. Furthermore, clinically significant hypotension could be defined in another way, without lactate elevation as a strict criterion, which would increase the occurrence of this variable. Second, current methods of extracting data from electronic health records are mostly restricted to objective data points captured in individual fields. More complex safety events would be difficult to capture, since they would require a more comprehensive analysis of multiple complex electronic health record data points. Third, while exposure simulation is a cost-effective and feasible approach to explore rare adverse events, it is not as robust as actual concentration measurements in a clinical trial with a population pharmacokinetic model exactly tailored to the collected data. Finally, the high interindividual variability in population pharmacokinetic models could affect our ability to identify relationships that do exist between exposure and adverse events. To address this limitation, we did repeat predicted exposure–safety relationship assessment using population rather than individual predictions, which do not incorporate interindividual variability into the simulation, which were not statistically different.
Conclusions
In conclusion, we successfully leveraged a population pharmacokinetic model and electronic health record data to evaluate the relationship between simulated plasma concentration of milrinone and the occurrence of systemic hypotension, respectively. Despite several limitations mentioned above, these findings are consistent with prospectively collected data from prior studies and support the broader applicability of our novel, efficient, and cost-effective study design for the examination of drug exposure–response and –safety relationships.
Supplementary material
To view supplementary material for this article, please visit https://doi.org/10.1017/S1047951121003103
Acknowledgements
Erin Campbell, MS served as the medical editor for review and submission of this manuscript. Ms. Campbell did not receive compensation for her contributions apart from her employment at the institution where this study was conducted.
Financial support
S.J.C. was supported by the National Institute of General Medical Sciences and the Eunice Kennedy Shriver National Institute of Child Health & Human Development of the National Institutes of Health under Award Number T32GM086330. The content is solely the responsibility of the authors and does not necessarily represent the official views of National Institutes of Health.
D.G. received salary support for research from the NICHD (5K23HD083465 and 5R01HD096435). The content is solely the responsibility of the authors and does not necessarily represent the official views of the National Institutes of Health.
C.P.H. receives salary support for research from National Institute for Child Health and Human Development (NICHD) (1K23HD090239), the National Heart Lung and Blood Institute (NHLBI) (R61/R33HL147833), the United States Food and Drug Administration (1R01-FD006099, PI Laughon; and 5U18-FD006298, PI: Benjamin), the United States government for his work in paediatric clinical pharmacology (Government Contract HHSN275201800003I, PI: Benjamin under the Best Pharmaceuticals for Children Act), the non-profit Burroughs Wellcome Fund, and other sponsors for drug development in adults and children (https://dcri.org/about-us/conflict-of-interest/).
Conflict of interest
None.
Ethical standards statement
Not applicable.


