


It has long been held that the development of hypertension may begin in pre-adolescence and adolescence. Evidence is now increasing that screening during these ages may permit detection of early evidence of hypertensive disease. Since blood pressure tends to track along the same percentiles throughout life, children with higher blood pressures are more likely to become hypertensive adults.Reference Kilcoyne, Richter and Alsup1–Reference Bao, Threefoot, Srinivasan and Berenson3 In this respect, a Task Force was instituted by the American Academy of Pediatrics in 1977 to develop normative data for blood pressures in children and adolescents. Updated versions were issued in 1987, 1996, and 2004.4–6 In 1999, Menghetti et al.Reference Menghetti, Virdis and Strambi7 developed a national standard level of blood pressure for Italian children, having screened a large sample of the population.
The number of recordings needed to determine blood pressure during childhood is a matter of debate. Some authorities advocate taking three pressures, and using the average of the three readings, or of the last two readings. Others recommend only one recording. The truth is that frequent measurements probably represent more accurately the state of the individual patient in terms of blood pressure.Reference Hohn8 According to the United States Task Force, elevated pressures must be confirmed on repeated visits before characterizing a child as having hypertension.6 Considering this variability, pressures measured during adolescence should be taken into account in any longitudinal programmes designed to detect hypertension for this age group. There are few Italian studies addressing this issue.Reference Genovesi, Giussani and Pieruzzi9 Furthermore, an important, and still unresolved, question is whether it is correct to use the normative tables established by the United States Task Force to identify hypertensive subjects in other countries or geographic areas. In fact, evidence already exists to show that their use can overestimate the prevalence of hypertension.Reference Menghetti, Virdis and Strambi7 In clinical practice, nonetheless, physicians practising in Italy generally still use nomograms derived from the measurements made in the United States of America, rather than the specific Italian ones.Reference Genovesi, Giussani and Pieruzzi9
The aim of the Sardinian Hypertensive Adolescents Research Programme Study, which for the sake of simplicity we will subsequently describe as the SHARP study was, first, to estimate the prevalence of high blood pressure in a population of Italian adolescents of school age, and second, to clarify whether it is better to use tables collated by United States Task Force rather than specific Italian population charts in order to identify hypertension amongst Sardinian children.
Materials and methods
The SHARP study was a longitudinal long term investigation carried out in Sardinia, Southern Italy, to gather information about the prevalence of hypertension in children, and its anthropometric, biochemical, and clinical determinants.
To derive the data, we studied 839 children, of whom 441 (52.6%) were male, drawn from the second-grade schools. Our aim was to investigate the prevalence of hypertension by conducting prospective longitudinal assessment of blood pressure over a period of 3 years. All children were enrolled from 10 different schools in Cagliari, the chief town of Sardinia, and in its province. Of the schools, 2 were located in Cagliari City, and 8 in its province. The selected children were representative of the population of children in both the town and the surrounding countryside of Sardinia, a region with a relatively small number of inhabitants. Most were living in Cagliari and in the surroundings. Information about the study, and the measurements to be made of blood pressure, were previously disclosed both to the children and their parents. Each child had his or her blood pressure measured every 6 months for a period of 3 years, with 5 separate measurements made from February, 2005, to June, 2007, with the ages of the children ranging from 11 to 14 years during this period. We excluded 65 children, since they were not present on at least 4 of the 5 days of screening. An additional 57 children did not take part in the study due to the failure to obtain informed written consent from the parents. The protocol for the study was approved by the University of Cagliari Ethics Committee.
Screening was performed according to a standardized and previously reported recording protocol.Reference Hohn8 All children had their blood pressure measured in their right arm, using a standard mercury sphygmomanometer. Measurements were made by two trained physicians after the subjects had rested quietly for at least 10 minutes in a silent classroom. The achievement of a quiet state was checked by measuring the pulse at the wrist.
We made 5 consecutive measurements for each child, recording both systolic and diastolic pressures, and their mean was used for the analysis. A cuff of appropriate size was chosen relative to the circumference of the upper arm, choosing from 2 cuffs with different bladder widths. We used a paediatric cuff for those with circumferences equal to or smaller than 22 centimetres, and an adult cuff for those with circumference exceeding 22 centimetres. In this way, we ensured that the cuff covered two-thirds of the length of the upper arm.Reference Clark, Lieh-Lai, Sarnaik and Mattoo10
The head of stethoscope was placed over the pulse in the brachial artery, proximal and medial to the cubital fossa, which was positioned at the level of the heart, the head of the stethoscope being about 2 centimetres below the bottom edge of the cuff. We used the first and fifth phases of the Korotkoff sounds to define systolic and diastolic pressures, respectively. We took care to deflate the cuff slowly, at a rate of 2 millimetres of mercury per second.
We then plotted the readings adopting, first, the principles of the American Task Force on High blood pressure in Children and Adolescents,6 second, the criterions selected by Menghetti et al. to develop the specific Italian tables,Reference Menghetti, Virdis and Strambi7 and, third, the distribution curves of our specific study.
We defined children as hypertensive when their systolic and/or diastolic pressures were above the 95th percentile at the initial measurement, and remained elevated in the subsequent screenings.6, Reference Hohn8 If the classifications proved different for systolic and diastolic measurement, we defined hypertension on the basis of combined systolic and diastolic values.
Values were expressed as mean plus or minus standard error for each study group. The specific centile curves of systolic and/or diastolic blood pressure derived from our study were constructed by fitting a third-order polynomial model of blood pressure on age and height using multiple regression analysis. The Cochran-Mantel-Haenszel test was used to compare elevated pressures between genders. The relationship between age and 95th percentile trend of systolic and/or diastolic blood pressure in boys and girls was sought by Pearson’s correlation coefficients, and by plotting the corresponding regression lines. Values of p less than 0.05 were set as the minimum level of statistical significance throughout the paper. All statistical analysis was performed using SPSS for Windows version 11.0 (SPSS Inc., Chicago, IL, USA).
Results
In Table 1, we show the prevalence of elevated readings after each of the 5 longitudinal screenings, according to the 3 different criterions used to define the children as being hypertensive. The proportions of children thus defined proved very different in consequence of the method of reference, and declined throughout the period of study.
Table 1 The prevalence (%) of hypertension after first, second, third, fourth and fifth screenings respectively, according to the three different criterions we used to define the children as hypertensive.
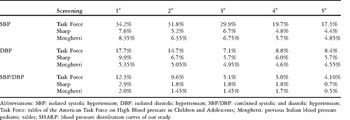
Abbreviations: SBP: isolated systolic hypertension; DBP: isolated diastolic hypertension; SBP/DBP: combined systolic and diastolic hypertension; Task Force: tables of the American Task Force on High Blood pressure in Children and Adolescents; Menghetti: previous Italian blood pressure pediatric tables; SHARP: blood pressure distribution curves of our study.
The number of children whose systolic and/or diastolic blood pressures were above the 95th percentile at the initial measurement, and remained elevated in the subsequent screenings, is shown in Figure 1 and Table 2, with analysis stratified according to gender.
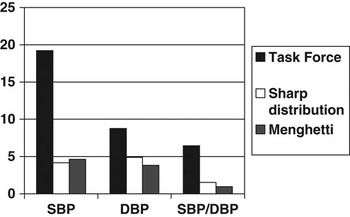
Figure 1 Bar graph shows the percentages of isolated systolic (SBP), isolated diastolic (DBP) and combined systolic and diastolic (SBP/DBP) persistent hypertensive subjects, according to the principles of the American Task Force on High Blood Pressure in Children and Adolescents, our BP frequency distribution curves, the criterion selected by Menghetti.
Table 2 The prevalence (%) of subjects whose systolic and/or diastolic blood pressure was above the 95th percentile at first check and remained elevated in the subsequent screenings, according to the three different criterions we used to define the children as hypertensive.
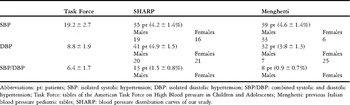
Abbreviations: pt: patients; SBP: isolated systolic hypertension; DBP: isolated diastolic hypertension; SBP/DBP: combined systolic and diastolic hypertension; Task Force: tables of the American Task Force on High Blood pressure in Children and Adolescents; Menghetti: previous Italian blood pressure pediatric tables; SHARP: blood pressure distribution curves of our study.
The highest percentages of children with isolated systolic, isolated diastolic, and combined systolic and diastolic pressures being above the 95th percentile were obtained when using the tables made by the American Task Force on High Blood pressure in Children and Adolescents. Use of these tables, and measurements, suggested that 19.2%, 8.8%, and 6.4% of the children, respectively, were hypertensive. The lowest numbers of children deemed to have isolated systolic hypertension were found using the distribution curves from our specific study, at 4.2%. The lowest percentages of children with isolated hypertensive diastolic pressures at 3.8%, and combined systolic and diastolic hypertensive pressures, at 0.9%, were found using the tables prepared by Menghetti and colleagues. On the whole, when using the curves acquired in the United States of America, very high percentages of children were considered hypertensive when compared to the curves derived from our own specific study, at 34.4% plus or minus 3.3% versus 10.6% plus or minus 2.1% respectively (p less than 0.00001). In contrast, we found similar incidences when using the Italian study as our reference, at 9.4% plus or minus 2.0% versus 10.6% plus or minus 2.1%, respectively, these differences not being statistically significant.
Analysis by gender failed to reveal any statistically significant differences in the percentages of hypertensive males and females subjects. Using our curves, 44 males, or 5.2% plus or minus 1.5%, were deemed hypertensive, versus 45 females, or 5.4% plus or minus 1.6%. When using the tables of Menghetti and colleagues, the respective numbers were 42 males, or 5.0% plus or minus 1.5%, versus 37 females, or 4.4% plus or minus 1.4%. We found that the mean systolic blood pressure was 4 millimetres of mercury higher in males than in females, at 114 versus 110 millimetres of mercury. The mean diastolic blood pressure did not significantly differ, at 64 versus 65 millimetres of mercury.
We also compared the three distributions of pressures derived from the different curves focusing on the 95th percentile (Fig. 2). The difference in systolic blood pressure between males and females at the 95th percentile was 5 millimetres of mercury, specifically 134 versus 129 millimetres of mercury, among 13-year-olds. No difference was noted among 11 and 12-year-olds. No difference for gender was found for the 95th percentile values of diastolic blood pressure.
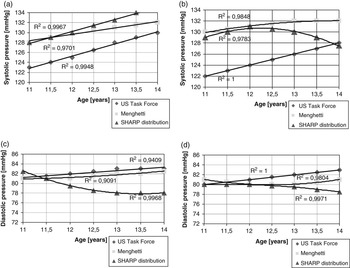
Figure 2 Trend of the 95th percentile of isolated systolic blood pressure according to the American Task Force tables, the SHARP study distribution curves and the criteria selected by Menghetti in boys (Panel a) and girls (Panel b). Trend of the 95th percentile of isolated diastolic blood pressure according to the same three references in boys (Panel c) and girls (Panel d).
Discussion
Our study confirms that, notwithstanding a little difference in measurement in millimetres of mercury for the same percentiles, the prevalence of all the forms of hypertension, be they systolic isolated, diastolic isolated, or combined systolic and diastolic, is always overestimated when using the tables for blood pressure prepared by the United States Task Force in comparison with specific Italian nomograms. It is likely that this reflects the fact that the population of the United States of America is made up of four great racial groups, namely White, Hispanic, African-American and Asian, and hence is very heterogeneous, while the Southern European population shows more homogeneity.Reference Sorof, Lai, Turner, Poffenbarger and Portman11 The findings, nonetheless, indicate that the American nomograms are specific for their target population, and are unsuitable for the screening of blood pressure in our children. Our purposes are better served by comparing our specific data with the data available from 21 Italian studies, prepared by Menghetti et al.Reference Menghetti, Virdis and Strambi7 according to the recommendations of the American Task Force, and developing in this way national tables of blood pressure suitable for screening Italian children.
During the 3 years over which time we screened our students, the number with elevated pressures has declined. This is well known as the phenomenon of regression towards the mean. Although the initial screening at first identifies a large number of students as having inconstant elevations of pressure, repeated screening shows that only a few have persistent hypertension.Reference Fixler, Laird, Fitzgerald, Stead and Adams12, Reference Din-Dzietham, Liu, Bielo and Shamsa13 This is a principle that occurs in every event in nature. In fact, when taking a couple of independent measurements from the same distribution, samples far from the mean on the first set will be closer to the mean on the second set. Regression toward the mean is a mathematical inevitability. Any measurement of any variable shows such regression to the mean.Reference Bland and Altman14
The overall prevalence of hypertension revealed in our Sardinian population, namely isolated systolic hypertension plus isolated diastolic plus combined systolic and diastolic levels, according to both the curves of distribution derived from our study, at 10.6% plus or minus 2.1%, and the table produced by Menghetti and colleagues, at 9.4% plus or minus 2.0%, was higher than levels reported internationally, where the range is generally from 1 to 5%.Reference Lande, Kaczorowski, Auinger, Schwartz and Weitzman15 We found isolated diastolic hypertension to be most prevalent using our own curves, and isolated systolic hypertension most prevalent using the tables of Menghetti and colleagues. In this respect, other studies on juvenile high blood pressure have sometimes shown a higher frequency of isolated systolic hypertension, sometimes a higher frequency of isolated diastolic hypertension, and sometimes the prevalence of combined systolic and diastolic hypertension.Reference Kilcoyne, Richter and Alsup1, Reference Fixler, Laird, Fitzgerald, Stead and Adams12, Reference Sinaiko16
When we focus our attention on the trends for the 95th percentiles, especially in females, they are a little different in comparison with those reported in other studies.Reference Menghetti, Virdis and Strambi7 This may reflect the earlier transition to maturity of our Southern Italian students compared with American or middle-northern Italian ones. An early menarche is known to be associated with increased systolic blood pressure, while there is a similar inverse relationship between age at menarche and diastolic blood pressure.Reference Remsberg, Demerath, Schubert, Chumlea, Sun and Siervogel17 Apart from one, all of the 398 girls in our study reported their menarche to have occurred no later than when they were 13 years old. A previous study reported both systolic and diastolic pressures increased significantly with age for boys, but not for girls.Reference Gilbert, Percy, White and Romero18 Additional studies are needed to clarify this issue.
Until now, there have been few studies of the distribution of blood pressures in a Southern European population of children and adolescents. Indeed, to our knowledge, ours is the first longitudinal screening of the same subjects performed in Southern Europe, and certainly the first in Italy. Our findings show the need to use population-specific charts when screening for hypertension in childhood, and confirm that the tables prepared by the Task Force established in the United States of America overestimate the prevalence of hypertension in Italian children.Reference Menghetti, Virdis and Strambi7
The tables provided by Menghetti et al. in 1999 represented the first important attempt to provide Italian national blood pressure nomograms for children. These standards were prepared using the data available from 21 studies conducted in Italy from 1988 through 1994. The use of those age and sex-adjusted Italian charts reduces the prevalence of hypertensive children compared with the numbers derived using the tables prepared in the United States of America. Their commendable attempt, however, was less than perfect due to some methodological differences in the form of screening among the various studies, for example the use of isolated versus repeated measurements of blood pressure, a not very homogeneous distribution of the subjects studied, most of whom came from the middle and the north of Italy, and the long time of the survey.
Our Sardinian study emphasises the need to integrate these standards with more up-to-date and representative reports on Italian children, as has been done in the United States of America since 1987, to increase the number of subjects to be checked, and so to obtain better national coverage in order to represent more completely all geographic, socio-economic, and ethnic aspects of the population of our country.Reference Menghetti, Virdis and Strambi7
Clinicians from every ethnic group or geographic area in the world, through recording blood pressure routine, should produce their own national nomograms relating to age, gender and height, derived from their genetic, nutritional, cultural, ethnic and social backgrounds. Although the standards established in the United States of America have been adopted worldwide, many local percentile curves are still being used, especially in North Europe.Reference De Man, Andrè and Bachmann19
Our study has its limitations. First, it remains difficult to following those identified as being at risk throughout their whole life to verify if the high pressure currently recorded in adolescence will really track in adult hypertension, and second, the need to increase the number of examined students, and to extend the screening to other age ranges.
Acknowledgments
Our research was supported by Regione Autonoma della Sardegna – Assessorato alla Sanità. We gratefully thank Professor Rinaldo Vallascas (Laboratory of mechanical and clinical measurements – University of Cagliari), the assistants who collected the data (Silvia Marras, psychologist; Carla Matta, psychologist), and especially the families who took part in the study.


