


Cardiovascular disease is the main reason of mortality and morbidity in patients with chronic kidney disease. Reference Jardine and McLaughlin1,Reference Chavers, Molony, Solid, Rheault and Collins2 Left ventricular hypertrophy and left ventricular systolic and diastolic dysfunction are the most common cardiovascular abnormalities, which are important causes of morbidity and mortality in chronic kidney disease. Reference Dyadyk, Bagriy and Yarovaya3,Reference Rakhit, Zhang, Leano, Armstrong, Isbel and Marwick4 These cardiac abnormalities might result from a variety of mechanisms, including uremia, sodium and fluid retention, hypertension, anemia, hyperparathyroidism, and abnormalities in the calcium–phosphate homeostasis. Reference Rakhit, Zhang, Leano, Armstrong, Isbel and Marwick4,Reference Anna, Matilda and Jacek5 Early detection of cardiovascular disease in children with chronic kidney disease would provide an opportunity for targeted intervention in patients to prevent cardiovascular morbidity and mortality. Reference Schoenmaker, Kuipers and Lee6
In patients with chronic kidney disease, conventional transthoracic echocardiography is unable to detect early deterioration of cardiac function. Reference Edwars, Hirth, Ferro, Townend and Steeds7,Reference Shawky, Hamdy and Elmadboluy8 Tissue Doppler imaging is a convenient method to detect early cardiac dysfunction. However, the most important disadvantage of this method is the angle dependency of the Doppler technique. Therefore, this study aimed to document the subclinical cardiac dysfunction in the early stages of chronic kidney disease using novel echocardiography techniques, such as two-dimensional speckle-tracking echocardiography. Reference Voigt, Pedrizzetti and Lysyansky9,Reference Rakha, Hafez, Bakr and Hamdy10 The advantages of this method are that it is angle independent, less load-dependent, easier to analyse and interpret compared with tissue Doppler imaging, and has less variability between different echocardiographers or the same echocardiographer at different times. Reference Rakha, Hafez, Bakr and Hamdy10
Methods
Participants
This prospective study was conducted at the outpatient pediatric nephrology and cardiology departments of the Dokuz Eylul University. The local ethics committee approved this prospective study (registration number: 2014/13-08). The study population included 34 paediatric patients with chronic kidney disease (19 females and 15 males, mean age 10.5 ± 4.1 years, range 2–18 years) with the glomerular filtration rate less than 90 ml/minute/1.73 m2. Stages of patients were determined according to the kidney disease: improving global outcomes (KDIGO) classification. 11 The glomerular filtration rate of children with chronic kidney disease was calculated by the Schwartz formula. The exclusion criteria were as follows: acute renal failure, congenital or acquired heart disease, low ejection fraction (EF < 60%), arrhythmia, other systemic diseases, and suboptimal image quality. Transthoracic echocardiographic evaluations were performed, 2 hours before haemodialysis. Anthropometric measurements, arterial blood pressure, and 12-lead electrocardiography of the patients were recorded. The selected control group consisted of 37 sex- and age-matched healthy participants with normal physical, laboratory, electrocardiography, and transthoracic echocardiographic results.
Echocardiographic studies
Echocardiographic examinations were performed using an ultrasound device (model iE33, Philips Medical Systems, Netherlands) with an S5–1-MHz transducer by the same observer, blinded to the clinical condition of the patients. Two researchers who were similarly blinded to the clinical condition and grouping of the patients performed the data analysis offline.
The transthoracic echocardiography images were obtained in standard parasternal, apical, and subcostal views. The interventricular septal diastolic and systolic thicknesses, left ventricular end-diastolic and end-systolic diameters, and left ventricular posterior wall diastolic and systolic thickness were measured in the parasternal long-axis M-mode echocardiographic evaluation. The systolic function was assessed from apical four-chamber and two-chamber views by measuring the left ventricular ejection fraction and shortening fraction using the modified biplane Simpson’s method. The mitral valve inflow Doppler flow was measured in an apical four-chamber image. Mitral early filling (E), late filling (A), and the E/A ratio were derived to evaluate the left ventricular diastolic function. The pulmonary artery systolic pressure was determined using the Bernoulli equation for the Doppler continuous wave measurement of tricuspid valve insufficiency flow. The right atrial pressure was evaluated using the inferior caval vein inspiratory collapsibility. Using these measurements, the left ventricular mass was computed according to the Devereux formula. The left ventricular mass index was calculated as the ratio between left ventricular mass and body surface area. The left atrial end-diastolic volume was calculated using the prolate ellipsoid method. The left atrial volume index was measured by dividing the left atrial end-diastolic volume by the body surface area calculated using the Mosteller formula.
Colour tissue Doppler echocardiography
The left ventricular myocardial colour tissue Doppler imaging was assessed during both contraction and relaxation. The sample volume was placed at the lateral margin of the mitral annulus on the apical four-chamber view. At least four consecutive cardiac cycles were recorded during the best image quality for evaluation. A Doppler frame scanning rate of 100–140 Hz with 40–80 frames/seconds was used. The systolic velocity (S’), early diastolic myocardial velocity (E’), late diastolic myocardial velocity (A’) at the time of atrial contraction, and E’/A’ ratio were determined. Late diastole was determined using the index of left ventricular compliance: a ratio of peak trans-mitral early filling (E) velocity to early diastolic mitral annular (E’) velocity.
Two-dimensional speckle-tracking echocardiography
For the speckle-tracking echocardiographic evaluation with simultaneous electrocardiography at frame rates of 70–100 frames/second, apical four-chamber, apical three-chamber, and apical two-chamber images were recorded in the apical view and in the parasternal short-axis view apical, medial, and basal images. At least four consecutive cardiac cycles were recorded during the best image quality for evaluation. The recorded images were transferred onto a DVD and analysed on a computer using the QLAB software (Philips Medical Systems). The mitral annulus lateral and septal and the left ventricular apical endocardial planes were marked for each apical three chambers, providing for automated generation of the left ventricular wall by the programme. The left ventricular endocardial–myocardial border was adjusted manually on the systolic frames. Peak systolic strain, peak systolic strain rate, and global strain values were calculated automatically by the software for the six segments (apical, middle, and basal) based on septum and left ventricular lateral wall motion values. In all the three parasternal views, the endocardial–myocardial border was adjusted manually after the programme automatically generated the ventricular wall.
Speckle-tracking echocardiography is a new technique for evaluating the ventricular function. Regional myocardial functions are evaluated with tissue Doppler echocardiography and speckle-tracking echocardiography. Due to the angle dependence in tissue Doppler echocardiography, the velocity measured with a transducer may differ depending on the variations in tethering and heart motion. On the contrary, in speckle-tracking echocardiography, regional myocardial functions can be evaluated along both the longitudinal and transverse axes regardless of the angle and direction of motion. In speckle-tracking echocardiography, the myocardium is divided into 17 segments, reflecting as much coronary perfusion as possible (Fig 1). And the dimensional deformations, that is, “strain” and deformation velocity in these segments, are evaluated as “strain rate.” Besides segmental functions, global functions were also evaluated. Published reports have shown the superiority of these parameters over transthoracic echocardiography and tissue Doppler imaging in identifying ventricular dysfunction.

Figure 1. Shematic diagram ( a ) of the LV segmentation, in apical four-chamber ( b ), three-chamber ( c ), and two-chamber views ( d ).
Study power
In this sample size, the effect size was calculated as 0.67, at 85% power and 0.05 alpha error, using the G * Power 3.1.9.2 software.
Statistical analysis
Statistical analyses were performed using the Statistical Package for the Social Sciences (SPSS) software, version 22.0 (SPSS Inc., Chicago, IL, United States of America). Continuous data were described as mean ± standard deviation, while categorical data were presented as the number of patients. The chi-square test was used for comparing categorical variables, while parametric continuous variables were compared using the Student’s t-test. Data were checked for normal distribution using the Kolmogorov–Smirnov test. The correlation between two variables was calculated using Pearson’s correlation coefficient (r) analysis of variance. A value of p < 0.05 was considered statistically significant. The evaluations were repeated by a second, independent observer, to assess inter-observer variability. Inter-observer variability was calculated by dividing the absolute difference between observations by the mean of the two observations.
Results
Cohort characteristics
The characteristics of the patients and the control group are shown in Table 1. The mean age of the 34 patients (19 female and 15 male) with chronic kidney disease was 10.5 ± 4.1 years, while that of 37 healthy volunteers (20 female and 17 male) was 9.8 ± 4.2 years. No significant differences were found between the two groups in terms of sex, age, weight, and body mass index (p > 0.05). The glomerular filtration rate mean was 37.5 ± 26.2 ml/minute/1.73 m2 in the patient group. Eight patients were in class II, 10 in class III, 6 in class IV, and 10 in class versus of chronic kidney disease. Among the patients, 10 were on regular haemodialysis treatment. The main causes of chronic kidney disease were congenital renal anomalies (41%), reflux nephropathy (32%), and glomerular disease (26%). The systolic and diastolic blood pressure values of the patients were also significantly higher than those of the controls (p < 0.05). A total of 14 patients were treated with antihypertensive medications.
Table 1. Demographic and clinical characteristics of the study population
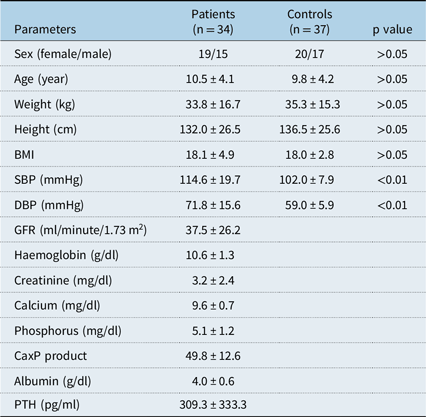
BMI, Body mass index; Ca, calcium; DBP, diastolic blood pressure; GFR, glomerular filtration rate; P, Phosphorus; PTH, parathyroid hormone; SBP, systolic blood pressure
Echocardiographic findings
The transthoracic echocardiography, Doppler, and colour tissue Doppler imaging results are summarised in Table 2. Analysis of transthoracic echocardiographic data of the two groups showed no significant differences in the interventricular septal and left ventricular posterior wall diastolic thicknesses, left ventricular end-diastolic and end-systolic diameters, ejection fraction, shortening fraction, left ventricular mass, and left atrial volume index between the groups. However, pulmonary artery systolic pressure, pulmonary artery diastolic pressure, and left ventricular mass index were significantly higher in the patient group compared with the controls (p < 0.01). No significant difference was found in the mitral E value, mitral A value, and E/A ratio between the groups. The colour tissue Doppler imaging showed a significant decrease in the E’ value, which resulted in a significant decrease in the E’/A’ and increase in the E/E’ ratios between the groups (p < 0.05). However, no significant difference was found in the S’ and A’ values between the groups.
Table 2. Echocardiographic, Doppler, and tissue Doppler imaging parameters of the study population

Ef, Ejection fraction; Fs, fractional shortening; IVSd, end-diastolic interventricular septum thickness; LAVI, left atrial volume index; LV A’, left ventricular (LV) wall late diastolic velocity; LVDd, end-diastolic LV dimension; LVDs, end-systolic LV dimension; LV E’, LV wall early diastolic velocity; LVMI, LV mass index; LVPWd, end-diastolic LV posterior wall thickness; LV S’, LV wall systolic velocity; mitral A, late diastolic velocity; mitral E, early diastolic velocity; PAPd, pulmonary artery diastolic pressure; PAPs, pulmonary artery systolic pressure
Speckle-tracking echocardiography
The speckle-tracking echocardiographic results of the left ventricular longitudinal peak strain, global strain, and systolic strain rate in the study group are given in Table 3. The apical four-chamber, three-chamber, two-chamber, and total global strain values were significantly lower in the patients group compared with the control group (p > 0.01). Moreover, the peak systolic strain values in all segments were lower in the patient group, compared with the control group, but this difference was statistically significant in all 15 segments (p < 0.05). The longitudinal systolic strain rate of all 17 segments was lower in the patients. However, this difference was statistically significant only in the measurements of all six segments (p < 0.05).
Table 3. Comparison of left ventricular longitudinal strain and strain rates between patients and controls

APA, Apical anterior; API, apical inferior; APL, apical lateral; APS, apical septal; BA, basal anterior; BAL, basal anterolateral; BAS, basal anteroseptal; BI, basal inferior; BIL, basal inferolateral; BIS, basal inferoseptal; MA, mid-anterior; MAL, mid-anterolateral; MAS, mid-anteroseptal; MI, mid-inferior; MIL, mid-inferolateral; MIS, mid-inferoseptal
Circumferential peak strain, global strain, and systolic strain rate values of the left ventricular wall results of the study group are given in the Table 4. The apical, mid, basal, and total global circumferential strain values were lower in the patient group, but this difference was statistically significant in the apical global and total global strain values (p < 0.05). The circumferential segmental strain values in the all 14 segments were lower in the patients group, compared with the control group. However, this difference was statistically significant only in the measurements of all three segments (p < 0.05). Circumferential systolic strain rates of all six segments were lower in the patients. However, this difference was statistically significant only in the measurements of all two segments (p < 0.05).
Table 4. Comparison of left ventricular circumferential strain and strain rates between patients and controls

APA, Apical anterior; API, apical inferior; APL, apical lateral; APS, apical septal; BA, basal anterior; BAL, basal anterolateral; BAS, basal aneroseptal; BI, basal inferior; BIL, basal inferolateral; BIS, basal inferoseptal; MA, mid-anterior; MAL, mid-anterolateral; MAS, mid-anteroseptal; MI, mid-inferior; MIL, mid-inferolateral; MIS, mid-inferoseptal
According to the KDIGO classification, the second and third stages of chronic kidney disease were compared with the fourth and fifth stages of the disease (Table 5), and no significant differences were found among the results of conventional, and Doppler echocardiography, and colour tissue Doppler imaging, and speckle-tracking echocardiography measurements (p > 0.05).
Table 5. Comparison of echocardiographic parameters between early-stage with late-stage chronic kidney disease and normotensive with hypertensive chronic kidney disease

LV A’, Left ventricular (LV) wall late diastolic velocity; LVDd, end-diastolic LV dimension; LVDs, end-systolic LV dimension; LV E’, LV wall early diastolic velocity; LVMI, LV mass index; LV S’, LV wall systolic velocity; mitral A, late diastolic velocity; mitral E, early diastolic velocity; PAPs, pulmonary artery systolic pressure; TS, total strain
A comparison of chronic kidney disease with and without hypertension (Table 5) showed that the left ventricular mass index was significantly higher in the group with hypertension (p < 0.05). However, No difference was found in the other values between the hypertensive and non-hypertensive groups, as in the comparison of early-stage and late-stage chronic kidney disease (p > 0.05).
The relationship between laboratory findings and speckle-tracking echocardiography results in chronic kidney disease is summarised in Table 6. No correlation was found of longitudinal and circumferential global and total global strain values with haemoglobin, creatinine, albumin, Calcium–phosphorus product and parathyroid hormone levels and glomerular filtration rate (p > 0.05).
Table 6. Correlation between speckle tracking echocardiography and laboratory findings

Ca, calcium; GFR, glomerular filtration rate; P, Phosphorus; PTH, parathyroid hormone; TS, total strain
p < 0.05 significant
The inter-observer variability for E’/A’ ratio, global longitudinal strain, and global circumferential strain analysis was evaluated in a randomly selected sample of 15 patients. The inter-observer variability for E’/A’ ratio, global longitudinal strain, and global circumferential strain was 4.8, 5.8, and 5.6%, respectively.
Discussion
Cardiovascular disease is a major complication in patients with chronic kidney disease and has a major impact on the morbidity and mortality of these patients. Several risk factors, such as hypertension caused by volume overload, anaemia, sodium retention, abnormalities in the calcium–phosphate homeostasis, and arteriovenous fistulas, might contribute to the development of cardiovascular disease. In addition, myocardial fibrosis resulting from chronic inflammation and accumulation of uremic toxins and chronic local ischemia due to insufficient vasodilator response, known as myocardial stunning, contribute to ventricular dysfunction. Reference Dyadyk, Bagriy and Yarovaya3,Reference Rakhit, Zhang, Leano, Armstrong, Isbel and Marwick4 Transthoracic and Doppler echocardiography evaluation generally show normal results in the early stages of cardiac involvement. Cardiac dysfunction in the subclinical stage may be recognised using methods such as speckle-tracking echocardiography. Early diagnosis of patients with evidence of cardiac dysfunction would be advantageous. Therefore, it might be beneficial for the early start of effective treatment. Four recently published studies evaluated the ventricular function in paediatric patients with chronic kidney disease, using speckle-tracking echocardiography.
Demetgul et al, in their study comparing chronic kidney disease in pediatric patient and healthy control groups, found that the peak systolic strain values were significantly lower in the longitudinal and some circumferential segments in the patient group. Reference Demetgul, Giray, Delibas and Hallioglu12 In a similar study, Yan et al found that peak systolic velocities decreased in the longitudinal basal and apical segments in the adult patients with chronic kidney disease. Reference Yan, Li and Hao13 In this study, although left ventricular systolic function as assessed by transthoracic echocardiography appeared to be normal in all cases, the pathological findings of systolic dysfunction were revealed by speckle-tracking echocardiography. All of the global longitudinal strains, some of the global circumferential strains, and most of the segmental strain values were significantly lower in the patient group than the control group.
Huis et al compared dialysis patients, renal transplant patients, and the healthy control group, and found that dialysis patients and renal transplant patients had statistically significantly lower longitudinal strain values than the control group. However, there was no statistically significant difference between dialysis patients and renal transplant patients. Reference Huis, Schoenmaker and Groothoff14 Especially the absence of any difference between the two patient groups suggested that irreversible cardiac impairment started early and cardiac functions did not improve after transplantation. A study conducted on patients with non-uremic hypertension showed that systolic dysfunction occurred in the late stages, although ventricular hypertrophy was detected in the early stages. On the contrary, systolic dysfunction has been shown to start early due to myocardial fibrosis with the effect of chronic inflammation and uremic toxins on patients with chronic kidney disease. Reference Scharer, Schmidt and Soergel15,Reference Santos and Shah16 In line with the previous studies, this study compared the early-stage (stage 2–3) and late-stage (stage 3–4) chronic kidney disease groups with the control group and found that both early-stage and late-stage longitudinal global and circumferential global strain values were statistically significant compared with those of the control group. However, no statistically significant difference was found between the early-stage and late-stage chronic kidney disease. Huis et al evaluated the left ventricular systolic function of the control group with dialysis and transplant with tissue Doppler imaging; they did not detect any statistically significant difference in the S’ wave velocities, as in this study. Reference Huis, Schoenmaker and Groothoff14 This suggested that tissue Doppler imaging changes occurred late in the left ventricular systolic dysfunction and speckle-tracking echocardiography was superior to tissue Doppler imaging in detecting systolic dysfunction.
Rakha et al found that global and segmental longitudinal and circumferential strain values were lower than those before dialysis in patients with end-stage chronic kidney disease. They explained that blood volume, arterial pressure, electrolytes, and deterioration in neuronal response triggered acute cardiac stress as a result of haemodialysis. Reference Rakha, Hafez, Bakr and Hamdy10 Similar studies reported on the activation of different ways of injury in the chronic period of haemodynamic and metabolic changes triggered by haemodialysis. As a result of such endothelial dysfunction, inflammatory activation, high-energy phosphate depletion, and impaired neuronal response, a pathology called “myocardial stunning” due to ischemia and fibrosis was developed. Furthermore, the aforementioned explained the ejection fraction invariance caused by the development of the active compensatory hyperkinesia of unaffected segments during myocardial stunning. Reference Hothi, Rees, Marek, Burton and McIntyre17,Reference Zuidema and Dellsperger18 However, Burton et al in their study on adult patients, showed that reversible segmental left ventricular dysfunction progressed and became irreversible within 1 year in patients undergoing haemodialysis. Reference Burton, Jefferies, Selby and McIntyre19 As a result, it was assumed that all segments were affected by myocardial stunning during the period when ejection fraction started to decrease. On the contrary, several other studies on paediatric and adult patients showed that the global longitudinal strain value did not change after haemodialysis. Reference Mendes, Ribeiras and Adragão20,Reference Murata, Dohi and Onishi21–Reference Lang, Badano and Mor-Avi24 In this study, while the segmental longitudinal strain rate and the circumferential strain rate were lower in 23 segments compared with the control group, only 8 segments were statistically significant. Similarly, Demetgul et al found a statistically significant decrease in the longitudinal and circumferential strain rate values in the patient group. Reference Demetgul, Giray, Delibas and Hallioglu12 In addition, despite no difference in the mitral E/A ratios between the patient and control groups, they showed that the diastolic strain rate was statistically significantly lower in the patient group compared with the control group, and early diastolic dysfunction could be detected in addition to the left ventricular systolic dysfunction.
On the contrary, the longitudinal global strain and circumferential global strain values were statistically significantly lower in both early- and late-stage chronic kidney disease groups compared with the control group.
In summary, the present study showed that speckle-tracking echocardiography might be useful in the early detection of left ventricular systolic dysfunction in children with chronic renal failure. The ease of use of these techniques and the availability of reference values might suggest their possible use in the follow-up of patients with chronic kidney disease. Demonstration of early cardiac effects in these patients might help minimise cardiac impairment by taking precautions. Further studies are needed to determine the clinical significance of these findings.
Study limitations
This study had several limitations. The first was that the study population was relatively small. The second was that the after-dialysis parameters were not evaluated in the patient group. The third was that laboratory markers were not used that might have shown cardiac involvement.
Financial support
This research received no specific grant from any funding agency, commercial or not-for-profit sectors.
Conflict of interests
None.
Ethical standards
The authors assert that all procedures contributing to this work comply with the ethical standards of the relevant national guidelines on human experimentation and with the Helsinki Declaration of 1975, as revised in 2008, and has been approved by the University of Dokuz Eylul Research Ethics Board.
Data availability statement
The datasets generated during and/or analyzed during the current study are not publicly available but are available from the corresponding author on request.


