


Recurrent lower respiratory tract infections are common in patients with significant post-tricuspid left-to-right shunt lesions. An episode of acute lower respiratory tract infection entails extensive immunologic and inflammatory activity occurring at the respiratory membrane. Local imbalance of pulmonary vasoconstrictors and vasodilators and hypoxic pulmonary vasoconstriction, contribute to increased pulmonary artery pressure during the acute phase, which is reversible once the infection and inflammation subside. Reference Yuan, Yang and Lee1–Reference Mizgerd3 Local hypoxic pulmonary vasoconstriction is a physiological response, which diverts blood flow to the well-ventilated lung segments, thus curtailing the ventilation-perfusion mismatch. Reference Marshall, Hanson, Frasch and Marshall4,Reference Dunham-Snary, Wu and Sykes5 Other reasons for the change in pulmonary artery systolic pressure may include changing haemodynamics during lower respiratory tract infection causing change in pulmonary artery pressure. Alterations in systemic blood pressure may have a variable influence on pulmonary artery pressure. Studies in children with structurally normal heart have demonstrated that pulmonary artery pressure rises significantly during lower respiratory tract infection and the rise correlates with the clinical severity of lower respiratory tract infection. Reference Bardi-Peti and Ciotu6–Reference Sreter, Budimir, Golub, Dorosulic, Pusic and Boban11 The quantum of rise in pulmonary artery pressure has varied from 7 to 12 mmHg. Reference Bardi-Peti and Ciotu6,Reference Ilten, Senocak, Zorlu and Tesic9,Reference Sreter, Budimir, Golub, Dorosulic, Pusic and Boban11
There is a surprising lack of data regarding the change in pulmonary artery pressures in children with CHD and lower respiratory tract infection. Children with left-to-right shunt have different vascular beds and hyperkinetic pulmonary hypertension. Reference Rabinovitch, Haworth and Vance12,Reference Heath and Edwards13 The impact of lower respiratory tract infection on the pulmonary artery pressure in these children is of obvious physiologic and clinical interest. Accordingly, we aimed at determining the change in pulmonary artery pressures non-invasively in patients with intracardiac left-to-right shunt, ventricular septal defect, or patent arterial duct during and after an episode of lower respiratory tract infection.
Materials and methods
In a single-centre prospective study, infants and children with acyanotic CHD (ventricular septal defect and patent arterial duct), presenting to cardiology outpatient service, or emergency, with acute lower respiratory tract infection were recruited. Study was approved by the Institutional Ethics Committee and was conducted between November, 2018 and January, 2020. Lower respiratory tract infection was defined according to the World Health Organization definition of pneumonia. 14 As children with increased pulmonary blood flow can have fast breathing and chest in drawing as part of heart failure symptoms, the presence of fever and radiological evidence of pneumonia were also taken as prerequisites for defining lower respiratory tract infection. Informed consent was taken from the patient’s legally authorised representative. Patients were excluded from the study if they had cyanotic CHD, or concomitant presence of obstructive lesions like mitral stenosis or pulmonary vein stenosis or coarctation of aorta. Preterm infants, patients with clinically recognisable chromosomal abnormalities or syndromes, and patients requiring mechanical ventilation or inotropes were also excluded.
For the purpose of the study, radiological severity was empirically graded into three categories. On chest radiograph, the presence of infiltrates in <1/3 lung fields was classified as a radiological mild disease. Disease was classified as moderate when infiltrates were present in >1/3 but <1/2 of lung fields. Presence of infiltrates in >1/2 of lung fields or the presence of any consolidation was classified as severe disease. Reference Scott, Wonodi and Moïsi15 Non-invasive blood pressure assessment was done in all patients using appropriate size cuff. Echocardiogram was done in standard views. Reference Lopez, Colan and Frommelt16 Shunt gradient was measured using continuous-wave Doppler from the parasternal long-axis view. Three readings were taken and the image with the best envelope was used to calculate the shunt gradient. Pulmonary artery systolic pressure was calculated by subtracting ventricular septal defect or patent arterial duct peak systolic gradient from systolic blood pressure. All the echocardiographic examinations were performed by a single well-experienced technician and all studies were reviewed by a senior paediatric cardiologist.
Appropriate treatment of respiratory illness was carried out as per paediatrician and paediatric cardiologist. Resolution of lower respiratory tract infection was defined clinically by resolution of fever, cough, and fast breathing and return to the previous baseline status. Within 14 +− 4 days of the complete resolution of lower respiratory tract infection, an echocardiogram was repeated to assess the pulmonary artery pressure using shunt gradient and systolic blood pressure.
Statistical analysis was performed using IBM SPSS Statistics software for Windows, version 23 (IBM Corp., Armonk, NY, USA). Data are presented as mean ± standard deviation or median and interquartile range (IQR; 25th, 75th centile). Normality of data was checked using Kolmogorov–Smirnov test. Wilcoxon signed-rank test was used for comparison between the patient variables during lower respiratory tract infection and after its resolution. Pulmonary artery systolic pressure change > 10 mmHg was considered as clinically significant empirically. All data of the group with a significant rise in pulmonary artery systolic pressure during lower respiratory tract infection were compared with the same data of the group without a significant rise in pulmonary artery systolic pressure during lower respiratory tract infection. Continuous haemodynamic and echocardiographic variables were compared using Mann–Whitney test. Chi-square test was used to compare ordinal and categorical variables. P < 0.05 was considered statistically significant. The correlation between the change in pulmonary artery systolic pressure during lower respiratory tract infection and continuous parameters was assessed with the Spearman’s rho correlation coefficient.
Results
During the study period, 54 children were recruited. Four patients died due to worsening lower respiratory tract infection and five patients could not duly return to complete the study within the stipulated time. Final analysis was done on 45 children as they had both evaluations, i.e., during lower respiratory tract infection and after its resolution. Median age of study patients was 5 months (range 1–36 months). Forty-one children had ventricular septal defect and four children had patent arterial duct. Thirty-three children had peri-membranous ventricular septal defect, four children had muscular defect, two children had doubly committed defect, and two children had inlet ventricular septal defect. Median defect size was 5.5 mm (IQR 4.5−7.55). All the children had severe pneumonia according to the World Health Organization clinical classification. Reference Heath and Edwards13 According to the radiological classification, 16 (35.5%) children had severe lower respiratory tract infection, 18 (40%) children had moderate disease, and 11 (24.4%) children had mild disease.
As shown in Table 1, during lower respiratory tract infection, the median heart rate was 148/min (140–160). Median respiratory rate was 64/min (57–66). Median oxygen saturation by pulse oximetry was 98% (98–99). Four children had oxygen saturation of less than 95%. Out of these, three children had oxygen saturation <90%. Venous blood gas pH value was available for 41 children. Median pH value was 7.391 (7.37–7.41). Four children had a pH value < 7.35. Median partial pressure of CO2 value was 38 mmHg (IQR 34−42.5). Partial pressure of CO2 more than 45 mm Hg was present in three children.
Table 1. Haemodynamic and echocardiographic variables during lower respiratory tract infection and after its resolution

* P-value of comparison between medians
BP = blood pressure; cPAAT = corrected pulmonary artery acceleration time; IQR = interquartile range (25th, 75th centile); LRTI = lower respiratory tract infection; LVEF = left ventricle ejection fraction; PAAT = pulmonary artery acceleration time; PASP = pulmonary artery systolic pressure; SpO2 = oxygen saturation
During lower respiratory tract infection, the median shunt gradient was 31 mm Hg (13.5–43). Shunt gradient was <=20 mmHg in 18 (40%) children. Fourteen children (31.1%) had shunt gradient between 21 and 40 mmHg. Shunt gradient was >40 mmHg in 13 (28.8%) children. Pulmonary artery systolic pressure was derived by subtracting shunt gradient from systolic blood pressure. Median pulmonary artery systolic pressure during lower respiratory tract infection was 60 mmHg (42–74) (Table 1).
Children were re-evaluated after resolution of lower respiratory tract infection. Median number of days between the initial study and re-evaluation was 18 days (range 16–36 days). Median heart rate, respiratory rate, and systemic systolic blood pressure were significantly different after resolution of lower respiratory tract infection, as compared to during lower respiratory tract infection. (Table 1) Median shunt gradient after resolution of lower respiratory tract infection was 32 mmHg (15–42.5).
Figure 1 shows pulmonary artery systolic pressure values of all patients during lower respiratory tract infection and after its resolution, in the form of a line diagram. Pulmonary artery systolic pressure during lower respiratory tract infection was significantly higher than the pulmonary artery systolic pressure after resolution of lower respiratory tract infection (p-value<0.0001). Analysing mild, moderate, and severe infection separately revealed that in all the subgroups, pulmonary artery systolic pressure was significantly higher during infection compared to that after resolution of infection with p -values-0.04, 0.01, and 0.007, respectively (Table 2).

Figure 1. Line diagram showing PASP values of all study patients during LRTI and after resolution of LRTI.
LRTI=lower respiratory tract infection; PASP=pulmonary artery systolic pressure
Table 2. Pulmonary artery systolic pressure, during LRTI and after resolution of LRTI, according to radiological severity

IQR = interquartile range (25th, 75th centile); LRTI = lower respiratory tract infection; PASP = pulmonary artery systolic pressure
Change in pulmonary artery systolic pressure after resolution of infection was assessed in all children. Thirty-five children had a rise in pulmonary artery pressure during lower respiratory tract infection. But 10 children had a fall in pulmonary artery systolic pressure during lower respiratory tract infection. Significant rise was defined as a rise in pulmonary artery systolic pressure >10 mmHg during lower respiratory tract infection. Similarly, significant fall was defined as a fall in pulmonary artery systolic pressure >10 mmHg during lower respiratory tract infection.
Significant rise in pulmonary artery systolic pressure during lower respiratory tract infection was present in 20% of patients (n = 9). Using chi-square test, there was a significant association between oxygen saturation by pulse oximetry < 92% during infection and a significant rise in pulmonary artery systolic pressure during infection (X2 (1)=12.85; p-value <0.0001). Also, there was a significant association between pH <7.35 during infection and a significant rise in pulmonary artery systolic pressure during infection (X2 (1)=8.69; p-value = 0.003). Systolic blood pressure (during infection) was significantly higher in patients who showed a significant rise in pulmonary artery systolic pressure during infection (p-value = 0.033). Also, defect size was significantly larger in this subgroup of patients (p-value = 0.047) (Table 3 and Supplementary Table 1). On correlation analysis, both these factors showed a very weak correlation. Change in systolic blood pressure was significantly higher in the patients who had a significant rise in pulmonary artery systolic pressure during infection (p-value = 0.044). There was a positive correlation between change in pulmonary artery systolic pressure and change in systolic blood pressure (Spearman’s rho 0.568; p-value <0.001). But R2 was 0.345 indicating a weak correlation. Change in pulmonary artery systolic pressure did not vary significantly with the radiological severity of lower respiratory tract infection. The children who had no hypoxia or acidosis (n = 4), but a significant change in pulmonary artery systolic pressure could not be differentiated from others by any of the clinical characteristics.
Table 3. Comparison of haemodynamic variables between the patient subgroups who had a significant rise in PASP during LRTI as compared to those without a significant rise in PASP
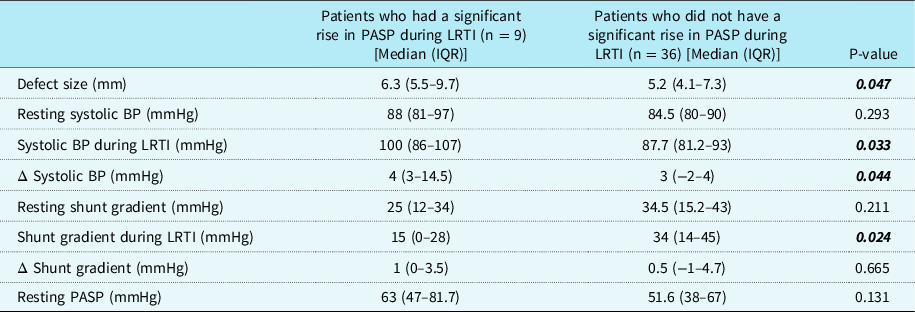
BP = blood pressure; IQR = interquartile range (25th, 75th centile); LRTI = lower respiratory tract infection; PASP = pulmonary artery systolic pressure; Δ Systolic BP = change in systolic BP; Δ Shunt gradient = change in shunt gradient
Significant fall in pulmonary artery systolic pressure during lower respiratory tract infection was present in only one patient. Remaining patients (n = 35) had no significant change in pulmonary artery systolic pressure during lower respiratory tract infection. Pulmonary Artery Acceleration Time and corrected Pulmonary Artery Acceleration Time were not significantly different during lower respiratory tract infection and after its resolution (p-value = 0.375 and 0.484, respectively) (Supplementary Table 1). There was no correlation of Pulmonary Artery Acceleration Time or corrected Pulmonary Artery Acceleration Time with the severity of lower respiratory tract infection, pulmonary artery systolic pressure, or change in pulmonary artery systolic pressure, or shunt gradient.
Discussion
This study adds important heamodynamic information regarding the status of pulmonary artery systolic pressure during lower respiratory tract infection in the patients with a post-tricuspid shunt. Acidosis and hypoxia are well-known pulmonary vasoconstrictors. But in the absence of hypoxia or acidosis, the impact of lower respiratory tract infection in children with CHD and left-to-right shunt is not well studied. Previous studies in children without heart disease have reported that pulmonary artery pressures increase by 7–12 mmHg during lower respiratory tract infection. Reference Bardi-Peti and Ciotu6,Reference Ilten, Senocak, Zorlu and Tesic9,Reference Sreter, Budimir, Golub, Dorosulic, Pusic and Boban11 Some of these studies have used indirect parameters for pulmonary artery pressure measurement like time to peak velocity, or ejection time, Reference Bardi-Peti and Ciotu6 or ratio of right ventricle pre-ejection period with ejection time and acceleration time, Reference Du, Li, Wang and Li7 as surrogates of pulmonary artery pressure and observed significantly higher values during acute illness than at follow-up. Utilising similar parameters viz., time to peak velocity and systolic time intervals, Pahl et al, reported no change in pulmonary artery pressures in infants with bronchiolitis. Reference Pahl and Gidding17 These parameters are not reliable measures of pulmonary artery pressures, especially when the pressures are elevated. Previous studies show a correlation between Pulmonary Artery Pressure and Acceleration Time. Reference Mohammad Nijres, Bokowski, Mubayed, Jafri, Davis and Abdulla18 However, Pulmonary Artery Acceleration Time and corrected Pulmonary Artery Acceleration Time did not correlate with the severity of lower respiratory tract infection, or shunt gradient, or pulmonary artery systolic pressure in our study population.
Few studies have used tricuspid regurgitation jet velocity to estimate pulmonary artery pressure during lung infection and demonstrated a reduction in pulmonary artery pressure by the disappearance of tricuspid regurgitation jet or decrease in right ventricular systolic pressure. Reference Sreeram, Watson and Hunter8,Reference Ilten, Senocak, Zorlu and Tesic9 In adults with community-acquired pneumonia, increase in pulmonary artery systolic pressure with increasing radiological severity of pneumonia was described in one study, but changes were less than 5 mmHg in majority of the patients and in only 3.3% (n = 2) showed a rise of >20 mmHg. Reference Sreter, Budimir, Golub, Dorosulic, Pusic and Boban11
There is sparse information on the change in pulmonary artery pressures during lower respiratory tract infection in children with CHD as most studies have excluded such patients. Reference Bardi-Peti and Ciotu6–Reference Ilten, Senocak, Zorlu and Tesic9 Kimura et al, recently studied 150 children with respiratory syncytial virus bronchiolitis, of which 40 children had CHD. Reference Kimura, McNamara, Wang, Fowke, West and Philip10 However, the details of the CHD and the quantum of fall in pulmonary artery pressure were not reported by the authors. Reference Kimura, McNamara, Wang, Fowke, West and Philip10
In our study, the pulmonary artery systolic pressure during lower respiratory tract infection was significantly higher as compared to the pulmonary artery systolic pressure after resolution of lower respiratory tract infection in children with post-tricuspid left-to-right shunts. The difference in median pulmonary artery systolic pressure between the two states is statistically significant, but it may not be clinically significant. Reference Ranganathan, Pramesh and Buyse19 We arbitrarily chose a value of >10 mmHg to define significant change, as lesser variations in addition to being clinically insignificant, may also occur due to differences in the haemodynamics during lower respiratory tract infection as compared to the basal state. Although systolic blood pressure was significantly higher during lower respiratory tract infection, the change in systolic pressure had only a weak correlation with the change in pulmonary artery systolic pressure. Also, defect size had a weak correlation with the change in pulmonary artery systolic pressure.
No study has reported a fall in pulmonary artery pressure during lower respiratory tract infection. We observed a slight fall in pulmonary artery systolic pressure in 20% of patients during lower respiratory tract infection although only one patient had a significant fall (>10 mmHg) in pulmonary artery systolic pressure during lower respiratory tract infection. Such a response could possibly result from the local release of nitric oxide (NO) due to activation of macrophage nitric oxide synthase. Reference Mizgerd3 Higher levels of nitric oxide have been observed in exhaled air of patients with pneumonia. Reference Adrie, Monchi, Dinh-Xuan, Dall’Ava-Santucci, Dhainaut and Pinsky20
Previous studies have shown that the degree of rise in pulmonary artery pressure correlates with the severity of lower respiratory tract infection. In all the studies, the World Health Organization clinical classification was used for defining the severity of lower respiratory tract infection. 14 In our study, all the children had severe pneumonia as per World Health Organization clinical classification. We observed no association between the change in pulmonary artery pressure and radiological severity of lower respiratory tract infection. There was no significant difference between the baseline pulmonary artery pressure amongst the children who had a significant rise in pulmonary artery pressure during lower respiratory tract infection as compared to those who didn’t. Hypoxia and/or acidosis were present in five patients in our study and caused a significant rise in pulmonary artery pressures. The patients in whom pulmonary artery pressures increased significantly in the absence of hypoxia or acidosis could not be distinguished from others (without such increase) by any clinical or echocardiographic parameters in this study.
Limitations
The number of patients studied is relatively small, but this is the largest study in patients with CHD and lower respiratory tract infection. We excluded patients requiring ventilation and inotropic support for the sake of uniformity, and to avoid confounding by different levels of oxygenation or acidosis. We only studied pulmonary artery systolic pressures as the presence of a left-to-right shunt lesion provided a window that has not been exploited previously. Further, whether the changes in pulmonary artery systolic pressure would differ according to the aetiology of infection is not known. The causative organisms for the lower respiratory tract infection were not analysed separately and bacterial as well as viral infection were included.
Conclusions
In the absence of hypoxia or acidosis, lower respiratory tract infection in patients with post-tricuspid left-to-right shunt causes only a mild increase in the pulmonary artery systolic pressure that is statistically significant, but may not be clinically significant in majority of the patients.
Supplementary material
To view supplementary material for this article, please visit https://doi.org/10.1017/S1047951120004734.
Acknowledgement
None.
Authors’ contributions
Shyam Sunder Kothari conceived the idea of study. All authors contributed to the study design. Material preparation, data collection, and analysis were performed by Sakshi Sachdeva and Shyam Sunder Kothari. The first draft of the manuscript was written by Sakshi Sachdeva and all authors provided important intellectual content on previous versions of the manuscript. All authors read and approved the final manuscript. All authors agree to be accountable for all aspects of the work in ensuring that questions related to the accuracy or integrity of any part of the work are appropriately investigated and resolved.
Funding
This research received no specific grant from any funding agency, commercial, or not-for-profit sectors.
Conflicts of interest
None.
Ethical standards
The authors assert that all procedures contributing to this work comply with the ethical standards of the Helsinki Declaration of 1975, as revised in 2008. Ethical approval was granted by the Institute Ethics Committee for Postgraduate Research, All India Institute of Medical Sciences, Ansari Nagar, 110029, New Delhi, India (Date: 5-10-2018/Ref No.: IECPG-418/30.08.2018, RT-23/27.09.2018).


