


Balloon aortic valvuloplasty is a commonly employed treatment for children with congenital aortic stenosis as an effective method to relieve valve obstruction. Reference Maskatia, Ing and Justino1–Reference Petit, Gao and Goldstein9 The goal of balloon aortic valvuloplasty is palliative, essentially delaying further aortic valve intervention for as long as possible. Reference Fratz, Gildein and Balling10 There was an early recognition that the ratio between the balloon diameter and the angiographic derived aortic valve diameter – the balloon-to-annulus ratio – plays an important role in resultant aortic valve insufficiency. Indeed, early studies of balloon aorticvalvuloplasty demonstrated a positive relationship between balloon-to-aortic annulus ratio and aortic valve insufficiency, with the risk of significant aortic valve insufficiency rising significantly beyond a balloon-to-aortic annulus ratio of 1.1:1. Reference Rocchini, Beekman and Ben Shachar11,Reference Rao, Thapar and Wilson12 Aortic valve insufficiency may be well-tolerated acutely, but over time is progressive, and in the setting of left ventricular dilatation, can by itself be an indication for aortic valve replacement or surgical palliation. Reference Demkow, Ruzyllo and Ksiezycka13,Reference Petit, Maskatia and Justino14 As valve insufficiency remains a common complication of aortic valvuloplasty that can significantly influence long-term outcomes, Reference Sandhu, Lloyd and Crowley5,Reference Galal, Rao and Al-Fadley15,Reference Zaban, Herrmann and Hoyer16 advances that reduce valve insufficiency but preserve gradient reduction should continuously be pursued.
As balloon-to-annulus ratio is recognised to be an important factor when performing aortic valvuloplasty, accurate measurement of the valve annulus is critical. The imaging modality used to measure the aortic valve annulus has not been standardised, and modalities have unique characteristics and drawbacks. For example, angiography essentially highlights the lumen or internal calibre of a vessel or chamber and has excellent imaging resolution. However, the calibration of angiographically attained images can be difficult, with smaller objects vulnerable to a greater degree of measurement error. Reference Wunderlich, Roehrig and Fischer17 Echocardiography excels at highlighting soft tissue, and the valve leaflets themselves, but resolution is less than angiography. To date, there are no studies evaluating the influence of imaging modality on the aortic valve annulus measurement, and resulting balloon-to-aortic annulus ratio, and whether this has any effect on outcomes following balloon aortic valvuloplasty. We sought to assess whether the method of valve annulus measurement plays a role in the outcomes following valvuloplasty.
Methods
Patient selection
We reviewed institutional records for children who underwent balloon aortic valvuloplasty between 1 January, 2007 and 1 January, 2014 at Children’s Healthcare of Atlanta and Cincinnati Children’s Hospital Medical Centre, as two-member institutions of the Congenital Catheterisation Research Collaborative. As previously described, the Collaborative performs multi-centre research in CHD, taking advantages of centre-specific variation and larger cohort sizes to assess impact of therapy on outcomes in CHD. Reference Petit, Glatz and Qureshi18,Reference Petit, Qureshi and Glatz19 Both centres use a Toshiba catheterisation lab system. The Institutional Review Boards of both centres approved the study. Patients who underwent balloon aortic valvuloplasty for isolated valvar aortic stenosis were included in the study. Patients who had missing or incomplete catheterisation records were excluded from the study. Patients who did not have pre-operative echocardiograms within 30 days of the procedure were also excluded as annulus measurements may not reliably reflect the annulus at the time of intervention. All pre-valvuloplasty echocardiograms were reviewed and measurements made by independent, blinded reviewers (SL, KG, CP, and RS).
Of the candidates who met the inclusion and exclusion criteria, basic demographic informations including age (months), weight (kilograms), height (centimetres), and body surface area were recorded. The medical history was reviewed, and the presence of other cardiac lesions was recorded.
Echocardiogram
Aortic valve annulus diameter was measured in early systole, demarcated on the electrocardiogram tracing immediately after the QRS complex, in the parasternal long-axis view as the distance between the hinge points of the visualised leaflets (Fig 1). Aortic valve insufficiency was graded using the standard methods as published from the American Society of Echocardiography as none/trace (0), mild (1), moderate (2), or severe (3). Reference Quinones, Douglas and Foster20 The change in aortic insufficiency was noted as the difference between the first available post-balloon aortic valvuloplasty echocardiogram and the pre-valvuloplasty echocardiogram.
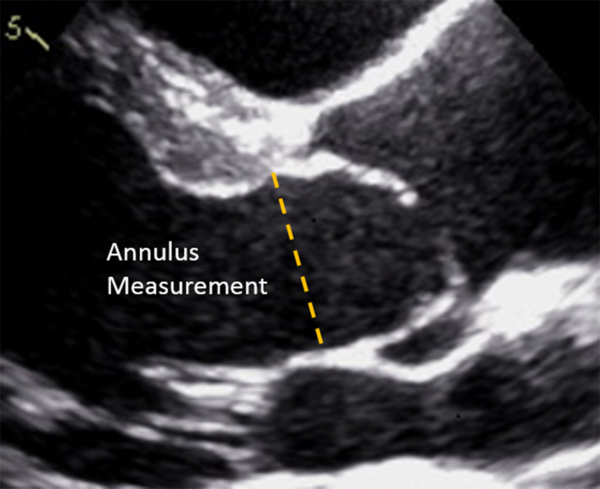
Figure 1. Measurement of the aortic valve annulus diameter in the parasternal long-axis view during echocardiography. The aortic valve annulus diameter was measured as the distance between the hinge points for the visualised anterior and posterior leaflets.
Catheterisation measurements
Catheterisation records of all valvuloplasty procedures were reviewed. All aortic valve annulus measures were performed by authors CJP and BHG. The aortic valve annulus was measured via left ventricular angiography, during systole with the leaflets in the open position, and in 30 degree right anterior oblique projection. The automated geometric calibration provided by the lab vendors was used for angiographic calibration. The catheterisation baseline transaortic valve gradient and reduction in valve gradient following balloon aortic valvuloplasty was noted. The largest rated balloon diameter used during each valvuloplasty procedure was recorded. The balloon diameter was also measured retrospectively at peak inflation (CJP and BHG) to determine diameter of the largest balloon used for valvuloplasty. The balloon size chosen during the interventional procedure was based on the angiographic measurement of the aortic valve. Operators continued to upsize the balloon by 0.5–1.0 mm increments until the transaortic valve gradient decreased to less than 30 mmHg or the valvar insufficiency was at least moderate.
Calculation of balloon-to-annulus ratios
The balloon-to-aortic annulus ratio was calculated for both the aortic valve diameter as measured by echocardiogram and catheterisation, using the maximum balloon diameter used during the procedure. For those procedures where double-balloon valvuloplasty was performed (n = 3), the effective balloon diameter was determined by a previously described and validated conversion formula. Reference Yeager21,Reference Radtke, Keane and Fellows22 Balloon-to-aortic annulus ratios were considered at thresholds of >1.0:1, >1.1:1, and >1.2:1.
Statistical analysis
Data are presented as frequencies and percentages, medians and interquartile ranges, or mean values and 95% confidence intervals where appropriate. The primary endpoint for this study was aortic insufficiency+, defined as a change in post-valvuloplasty insufficiency ≥2 degrees from baseline. Secondary endpoints included post-valvuloplasty insufficiency ≥ moderate and the reduction in aortic valve gradient. Concurrent measures taken by both catheterisation and echocardiogram were assessed using paired tests. Specifically, Wilcoxon signed-rank tests were employed for continuous data due to right skewness, and McNemar’s tests were used for categorical variables; moreover for non-paired, two-sample testing, Wilcoxon rank-sum tests were utilised. One-way analysis of variance was employed to test for differences in change in annulus diameter by patient age groups (<1 month, 1–12 months, and >12 months). Two-way repeated measures one-way analysis of variance with interaction was used to test for differences in balloon-to-aortic annulus ratio measurement (angiographic versus echocardiographic) within patient age groups. The assumptions of normality for both change in annulus diameter and balloon-to-aortic annulus ratio measurement outcomes were tested and confirmed using histograms, quantile–quantile plots, and the evaluation of model residuals. Finally, analysis of covariance was utilised to study the relationship between balloon-to-aortic annulus ratio and gradient reduction between catheterisation and echocardiogram measures. Normality diagnostics were similarly assessed and confirmed. All analyses were performed in SAS v.9.4 (Cary, NC), and statistical significance was measured at 0.05.
Results
Patients
Patient characteristics and data from catheterisation are shown in Table 1. There were 98 children included in the study, with a median age of 2.1 months (Interquartile range (IQR): 0.2–105.5 months) at time of balloon aortic valvuloplasty. Most patients had isolated aortic valve stenosis without other heart disease. The median pre-intervention peak-to-peak gradient was 58.0 (IQR: 48.0–70.0) mmHg, and the median reduction in gradient was 35.5 (IQR: 26.0–43.0) mmHg. Double-balloon valvuloplasties were rare, with only 3 (3.1%) patients undergoing the double-balloon technique, and 95 (96.9%) patients undergoing single-balloon valvuloplasty.
Table 1. Demographic and catheterisation characteristics.

BAV=balloon aortic valvuloplasty; BSA=body surface area.
There were no significant patient demographic differences between the institutions, aside from slightly older patients in one institution (p = 0.020). However, procedural factors between institutions were equivalent including pre-valvuloplasty gradient (p = 0.341), reduction in gradient (p = 0.229), angiographic balloon-to-aortic annulus ratio (p = 0.849), and echocardiographic balloon-to-aortic annulus ratio (p = 0.230) (data not shown).
Balloon-to-annulus ratios and aortic valve diameter measurements
Based on imaging modality, paired comparisons of the aortic valve annulus diameter and balloon-to-aortic annulus ratio were performed. The median aortic valve diameter as measured by echocardiography was 7.5 mm (IQR: 6.1–14.8) and was significantly lower than the angiographically obtained measured diameter of 8.2 mm (IQR: 6.8–16.0) (p < 0.001). This resulted in a lower angiographic balloon-to-aortic annulus ratio compared to echocardiographic balloon-to-aortic annulus ratio; the median echocardiographic ratio was 1.1 (IQR: 1.0–1.1), while the median angiographic ratio was 0.9 (IQR: 0.9–1.0) (p < 0.001). Agreement in “High” balloon-to-aortic annulus ratio readings at thresholds of 1, 1.1, and 1.2 between the angiographic and echocardiographic measures was further considered (Table 2). In each case, significant disagreement was observed (all p < 0.05), with catheterisation agreeing with echocardiogram on only 20/64 (31.2%), 9/41 (22%), and 2/12 (16.7%) for “High” balloon-to-aortic annulus ratio values at thresholds of 1, 1.1, and 1.2, respectively.
Table 2. Paired differences in balloon-to-annulus ratio by imaging modality.

BAR=balloon-to-annulus ratio.
Paired differences evaluated using McNemar’s tests (exact McNemar’s tests when expected frequency <5.)
The numeric difference between echocardiographic and angiographic measurements (i.e., disagreement) was associated with several patient and clinical characteristics (Table 3). A greater discrepancy was observed in patients with smaller aortic valve annulus diameters. The relationship between the balloon-to-aortic annulus ratio difference and aortic valve annulus diameter was significant at all levels of disagreement (10% p = 0.046, 15% p = 0.041, and 20% p = 0.044). Body weight, measured in kilograms, did not associate with discrepancy. Patient age at balloon aortic valvuloplasty was not associated with a difference between angiographic balloon-to-aortic annulus ratio and the echocardiographic derived ratio; however, neonates were noted to have a larger disagreement between these two ratios (p = 0.044).
Table 3. Demographic and clinical characteristics by successive BAR disagreement percent in aortic valve annulus diameter.
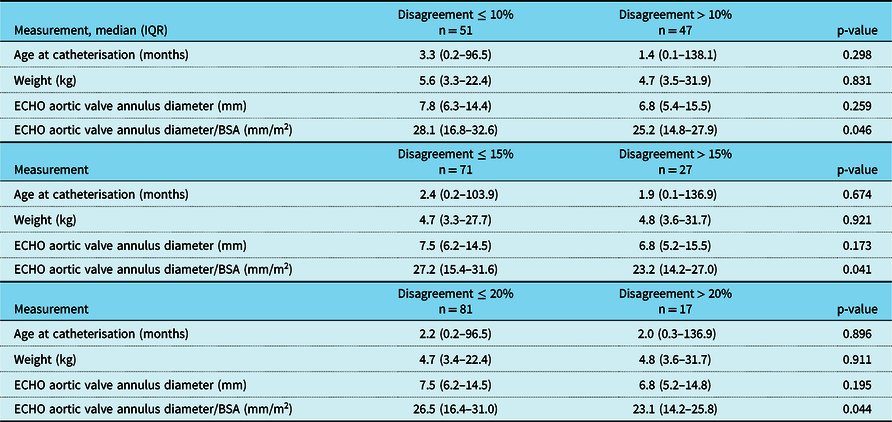
BAR=balloon-to-annulus ratio; ECHO=echocardiogram.
Procedural outcomes following valvuloplasty
Among the entire cohort, the values of angiographic balloon-to-aortic annulus ratio averaged significantly lower than echocardiographic derived ratio (mean: 0.96, 95% CI: 0.93, 0.99 versus mean: 1.07, 95% CI: 1.04, 1.09, respectively; p < 0.001). Moreover, average angiographic values remained significantly lower than echocardiographic values at all levels of patient age, <1 month (p < 0.001), 1–12 months (p = 0.008), and >12 months (p < 0.001) (Fig 2). A higher echocardiographic ratio was positively associated with ≥ moderate insufficiency post-valvuloplasty (p = 0.040), while angiographic balloon-to-aortic annulus ratio was not associated with ≥ moderate insufficiency post-valvuloplasty (p = 0.136) (Table 4). An echocardiographic balloon-to-aortic annulus ratio >1.1 was associated with valvar insufficiency ≥ moderate, while angiographic ratio >1.1 was not associated with valvar insufficiency ≥ moderate.

Figure 2. Repeated measures two-factor one-way analysis of variance interaction mean value plots considering balloon-to-aortic annulus ratio by imaging modality and age groups. Results indicate significant differences in balloon-to-aortic annulus ratio values between imaging modalities for all age categories. This difference appears to be most profound in neonates. Estimates are presented as mean values and 95% confidence intervals.
Table 4. Differences in BAR measurements between moderate AI groups.

AI=aortic insufficiency; BAR=balloon-to-annulus ratio.
When aortic insufficiency ≥ moderate is used as the measured outcome, more patients with ≥ moderate insufficiency had an echocardiographic ratio of >1.1 than angiographic ratio of >1.1 (Table 4). While the overall balloon-to-aortic annulus ratio values are higher by echocardiography, the proportion of aortic valvuloplasties with an echocardiographic ratio of >1.0 is greater than the proportion with an angiographic ratio of >1.0 (Fig 3). Out of those patients with an increase in aortic insufficiency demonstrated by a change in severity by 1, 2, or 3 grades, the majority (45/55, 81.8%) fall below an angiographic balloon-to-annulus ratio of 1. In contrast, using the echocardiographic derived balloon-to-annulus ratio, the majority with an increase in valvar insufficiency fall above the 1:1 threshold (35/55, 63.6%). Among the cohort subset with any increase in aortic insufficiency, only 3 (5.5%) had an angiographic balloon-to-annulus ratio of >1.1, while 21 (38%) had an echocardiographic derived ratio of >1.1 (p < 0.001).

Figure 3. Balloon-to-aortic annulus ratio and change in aortic valve insufficiency by measurement method. Scatterplots illustrating balloon-to-aortic annulus ratio versus change in aortic valve insufficiency as measured by imaging modalities. More cases of severe changes in aortic valve insufficiency were captured by balloon-to-aortic annulus ratio > 1.0 with balloon-to-aortic annulus ratio determined by echocardiogram (plot on the right). Almost all cases where aortic valve insufficiency changed by 2 more had an echocardiographic balloon-to-aortic annulus ratio > 1.0.
There was no association between balloon-to-aortic annulus ratio and reduction in aortic valve gradient. Figure 4 shows the results of an analysis of covariance analysis, demonstrating linear trends between balloon-to-aortic annulus ratio and reduction in gradient when across balloon-to-aortic annulus ratio imaging modalities. There were neither associations between angiographic and echocardiographic balloon-to-annulus ratios with valve gradient reduction, individually (angiographic p = 0.886 and echocardiographic p = 0.219), nor a difference in trend line slopes (p = 0.494).

Figure 4. Analysis of covariance plot considering the relationship between catheter reduction in gradient and balloon-to-aortic annulus ratio by imaging modality. analysis of covariance analysis demonstrating reduction in gradient (mmHg) against balloon-to-aortic annulus ratio. Filled dots represent angiographic balloon-to-aortic annulus ratio, and hollow dots represent echocardiographic balloon-to-aortic annulus ratio. The line with the more positive slope (dashed line) represents the line of best fit for echocardiography. No significance difference in slopes was observed (p = 0.494).
Discussion
Studies have shown the influence of valvular morphology on outcomes, including aortic valve tear patterns that could in turn influence the amount of aortic insufficiency developing post procedure. Reference Petit, Gao and Goldstein9,Reference Maskatia, Justino and Ing23-Reference Gao, Sachdeva and Goldstein27 It appears that valve substrate has a major impact on outcomes following valvuloplasty. Nevertheless, technical factors – specifically balloon-to-aortic annulus ratio – have clearly been shown to impact outcomes following aortic valvuloplasty. Particularly, these studies have demonstrated that a rising balloon-to-aortic annulus ratio is associated with higher incidence of important aortic insufficiency. Reference Zeevi, Keane and Castaneda28-Reference Moore, Egito and Mowrey30
While the balloon-to-aortic annulus ratio is a known determinant of the risk of aortic insufficiency post valvuloplasty, the method used to determine the ratio has varied by centre, and by report. Our study demonstrates that in fact, when operators use the catheter-derived measurement, the calculated ratio appears rarely to be >1.1. This would seem to reflect prudence on the part of the interventionalists. In contrast to this seeming prudence, the balloon-to-aortic annulus ratio (when using the echocardiogram-based annulus measurement) was often >1.1, exceeding even 1.2 in many cases. While neither angiography nor echocardiography has been defined previously as the gold-standard for valve annulus measurement, there is a reason to believe that echocardiographic measurement may be superior. There are at least two issues which may limit the reliability of the angiography-derived measurement of the aortic valve annulus diameter. First, angiographic imaging of tissue, particularly valvar tissue is often challenging, while other methods of imaging – echocardiography and MRI, for example – excel at tissue imaging. Second, the calibration of angiographic measurements is imperfect as a rule. Reference Wunderlich, Roehrig and Fischer17,Reference Badger, Arya and Loan31 Geometric calibrations used for catheter-based measurements assume a pre-determined isocentre – the locus between the radiation source and the image sensor. This focal point is often assigned at a predetermined distance above the level of the catheterisation table. While fixed isocentre calibration can conceivably work on the straight lateral view, the anterior–posterior projection isocentre is less reliable in children who vary tremendously – from 2 kg to >100 kg – in size. Furthermore, very often even the lateral camera is angulated in a long-axial projection, nullifying in essence the verity of lateral fixed isocentre calibration. These challenges in calibration are accentuated when the structures being measured are smaller, compounding the calibration and inherent measurement errors.
Interestingly, Chubb et al found a similar phenomenon at play in the measurements of pulmonary valve annuli in children undergoing balloon pulmonary valvuloplasty. Reference Chubb, Ward and Worme32 In their study, angiography-derived measure of the pulmonary valve annulus regularly exceeded the echocardiographic measure in over 150 children undergoing balloon pulmonary valvuloplasty, resulting in significant discrepancies in the balloon-to-aortic annulus ratio for these procedures. The investigators estimated that the ratio might vary up to 37% based upon methodology of annulus measurement alone. Similar to the experience with aortic valvuloplasty, balloon selection for pulmonary valvuloplasty has been shown to have important effects on the development of pulmonary valve regurgitation. Reference Pathak, Pockett and Moore33
Our data, which demonstrate a smaller aortic valve annulus dimension using echocardiography, appear to reinforce error-prone calibration. Given this outcome, it suggests that the catheter-derived measurement overestimates the actual aortic valve annulus, which may inadvertently lead operators to select larger balloon catheters for valvuloplasty.
Our study revealed some potential patient and morphological factors that influence the measurement of aortic valve annulus diameter. We found that in smaller children, and those with smaller aortic valves, there is a greater disagreement between the echocardiography- and angiographic-based measurements of aortic valve annulus diameter. One possibility is that smaller valves are more difficult to measure accurately in the catheterisation lab due to technical factors such as radiographic beam calibration or image size adjustment accounting for patient size. Another is the lack of standardisation of angulation for aortic valve annulus measurement. While a long-axis view of the left ventricle and outflow tract is perhaps the best angle for measurement of the annulus, often operators utilise a straight AP or lateral image for measurement. If the aortic valve is to be measured in the catheterisation lab, operators should use caution for younger children, or those with smaller valves compared to body surface area as these have been shown to have larger discrepancies.
Limitations of the study include its retrospective nature, though there is a correlation between technical measurements and outcomes, there is no definitive demonstration of causality without a randomised prospective clinical trial. The study also did not control for valvuloplasty operator or anatomical factors of the valve morphology, which may be an important determinant of outcomes. Catheter measurements were determined by several skilled operators during an extended timeline of more than 5 years, while the echocardiogram measurements were read by KG, CP, SL, and RS within the year of the study. In addition, it is known that the aortic annulus is not perfectly round; therefore, oblique measurements in a single frame may lead to error in annulus measurement. Despite these limitations, the clinical results remain plausible. There was sufficient statistical power despite the small sample size.
Conclusion
Angiography has been traditionally used for measurement of the aortic valve annulus for cases of balloon aortic valvuloplasty. Angiographic calibration methods may be problematic, which can lead to an overestimation of the aortic valve annulus. Following echocardiographic assessment of the aortic valve annulus, using a balloon-to-aortic annulus ratio of >1.1 is associated with a greater proportion of significant aortic insufficiency development. Incorporating echocardiographic measurement of the aortic valve annulus can aid in determining optimal valvuloplasty balloon size. Operators should entertain using both echocardiographic and angiographic measurements of the aortic valve when performing aortic valvuloplasty.
Acknowledgements
None.
Financial support
This research received no specific grant from any funding agency, commercial, or not-for-profit sectors.
Conflicts of interest
None.
Ethical standards
All study procedure complied with the ethical standards of the Helsinki Declaration and have been approved by the Institutional Research Boards of Children’s Healthcare of Atlanta and Cincinnati Children’s Medical Center.


