


Since the inception of percutaneous pulmonary valve implantation by Bonhoeffer in 2001,Reference Bonhoeffer, Boudjemline, Saliba, Merckx, Aggoun and Bonnet1 the use of balloon interrogation of the right ventricle outflow tract has played a key role in both sizing and defining a landing zone for the valve and, in conjunction with angiographic coronary evaluation, determining the risk of coronary compression due to the anatomic distortion following valve deployment.Reference Bonhoeffer, Boudjemline and Qureshi2–Reference Lurz, Gaudin, Taylor and Bonhoeffer9
Coronary balloon testing refers to a 2 step assessment wherein an angioplasty or sizing balloon is inflated across the intended landing zone for the new valve in the right ventricular outflow tract, before performing simultaneous aortic root and/or selective coronary angiography, to identify coronary compression or a high-risk spatial relationship between the right ventricular outflow tract and the CA or aortic root. This has been reported to be a concern in approximately 5% of all pulmonary valve implantation, guiding the operator to change their approach for valve implantation, or to abandon the percutaneous option in favour of traditional open-heart surgical valve replacement.Reference Morray, McElhinney and Cheatham10,Reference Mauri, Frigiola and Butera11
Despite the widespread reliance on this test, the occurrence of coronary compression has been described clinically and angiographically after pulmonary valve implantation in cases when the coronary balloon test classified these patients as non-risk or lower risk, calling into question the accuracy of this method. Also, there is no practical method to determine the false positive rate.Reference Mauri, Frigiola and Butera11–Reference Kostolny, Tsang and Nordmeyer13
Potential causes of inaccurate performance have been suggested, with attention placed more on the visual-spatial limitation of fluoroscopic bi-plane images rather than anatomical deformations induced by the rigid equipment used during the testing and valve implantation procedure. There has been little quantitative assessment of these factors and the inaccuracies induced by extrapolating coronary compression testing to the anatomical relationships produced by valve deployment.Reference Pockett, Moore and El-Said14,Reference Goreczny, Zablah, McLennan, Ross and Morgan15
The purpose of this study was to evaluate the ability of balloon coronary compression testing during pulmonary valve implantation to predict the final spatial relationship between the implanted valve and the CAs and to explore how variations in substrate, equipment, and technique can influence this.
Materials and methods
Study design
This is a retrospective single-centre study, based on chart review of patients who underwent percutaneous pulmonary valve implantation between January 2018 and December 2019. All procedures were performed under general anaesthesia and following a defined protocol for pulmonary valve implantation. All such patients with enough angiographic data to compare the right ventricular outflow tract position before and after the valve deployment were included.
Demographic and clinical data such as sex, age, weight, height, main diagnosis, and right ventricular outflow tract substrate were collected. Procedural data such as valve type, size of valve, type of guide wire, and type and size of test balloon were also collected.
Coronary balloon test
Our usual protocol for balloon coronary compression testing has been described elsewhere but in essence involves inflation of a balloon of the same nominal diameter as the proposed percutaneous valve (±1 mm), whilst simultaneously performing selective coronary angiography using 3D rotational angiography.Reference Malone, Fonseca and Fagan16 Those images are then qualitatively assessed to determine areas of flattening or compression of the CA related to the position of the inflated balloon. In our practice, this is done by analysing both the unprocessed 3D rotational angiogram, then a 3D reconstruction of the inflated balloon and CA, and finally by analyzing MPR data from a CT-like reconstruction of the 3DRA using the Philips XperCT software package.
Image acquisition
Stored fluoroscopic and acquired cineangiography imaging were reviewed using the Siemens Syngo® dynamics system. Two time points during the PPVI procedure were identified, and stil-frame images at these points were selected for quantitative and qualitative analysis. The first point (T1) was during balloon interrogation coronary testing, and the second time point (T2) was following valve deployment, after withdrawal of the delivery system and guide wire.
Images T1 and T2 were taken at the same fluoroscopic angle, as close to a straight lateral projection as possible.
Difference assessment
These images (T1 and T2) were downloaded as high-quality JPEG images and objectively assessed to interrogate spatial relationships between the outflow tract, outlined with the interrogation balloon inflated, and after pulmonary valve deployment. Although the ideal measurement would be between the posterior margin of the outflow tract and the nearest CA during balloon testing and after placement of the percutaneous pulmonary valve, this would provide numerous practical drawbacks, including the requirement for coronary angiography after valve placement. This is not a standard practice and short of repeating the 3DRA imaging there remains a difficulty in identifying a consistent coronary region in a lateral view which would allow a perpendicular distance to be measured from the outflow tract to that vessel.
We, therefore, elected to use the distance between the posterior wall of the sternum and the posterior wall of the right ventricular outflow tract (defined by either the posterior edge of the balloon or the valve frame) to determine the relative position of the right ventricular outflow tract during balloon coronary compression testing and after valve implantation. If the widely accepted assertion related to balloon testing is that compression of the CA during the balloon test predicts a similar impingement due to an implanted valve, then it follows that we should not see discrepancy in the final valve position compared with the balloon position in an AP direction (lateral plane). Otherwise put, our null hypothesis would be upheld if there was no significant difference between the position of the testing balloon and the position of the implanted valve frame.
Three measurements were performed to estimate the distance between the posterior border of right ventricular outflow tract and the sternum along the length of the balloon at T1 and the valve frame at T2. Two measurements of fixed radiolucent structures were identified and used for calibration purposes to ensure parity between the fluoroscopic images used at T1 and T2 (Fig 1).

Figure 1. Distance between the posterior border of the right ventricular outflow tract and the sternum. During the quantitative assessment three measurements (1, 2, 3) were performed to establish the difference between the right ventricular outflow tract posterior border at T1 (a) and T2 (b). The location of these measurements was defined based on the overlaid image (c).
We considered how much discrepancy between the predicted position of the valve and the actual position would be deemed important in the context of predicting coronary compression, and based on previous publications which considered a distance of 5 mm between the right ventricular outflow tract and the CA as ‘low-risk’, we used a difference of 5 mm or greater between T1 and T2 as an arbitrary definition of inaccuracy.
As a sense check, and in order to qualitatively demonstrate this alignment issue, the right ventricular outflow tract position at T1 and T2 relative to the chest wall was visualized by exporting the images as JPEGs and overlaying them. The superimposed image was aligned based on anatomical reference points, such as sternal wires, vertebral bodies, and other fixed radiolucent devices previously implanted in the thoracic cavity (Fig 2).
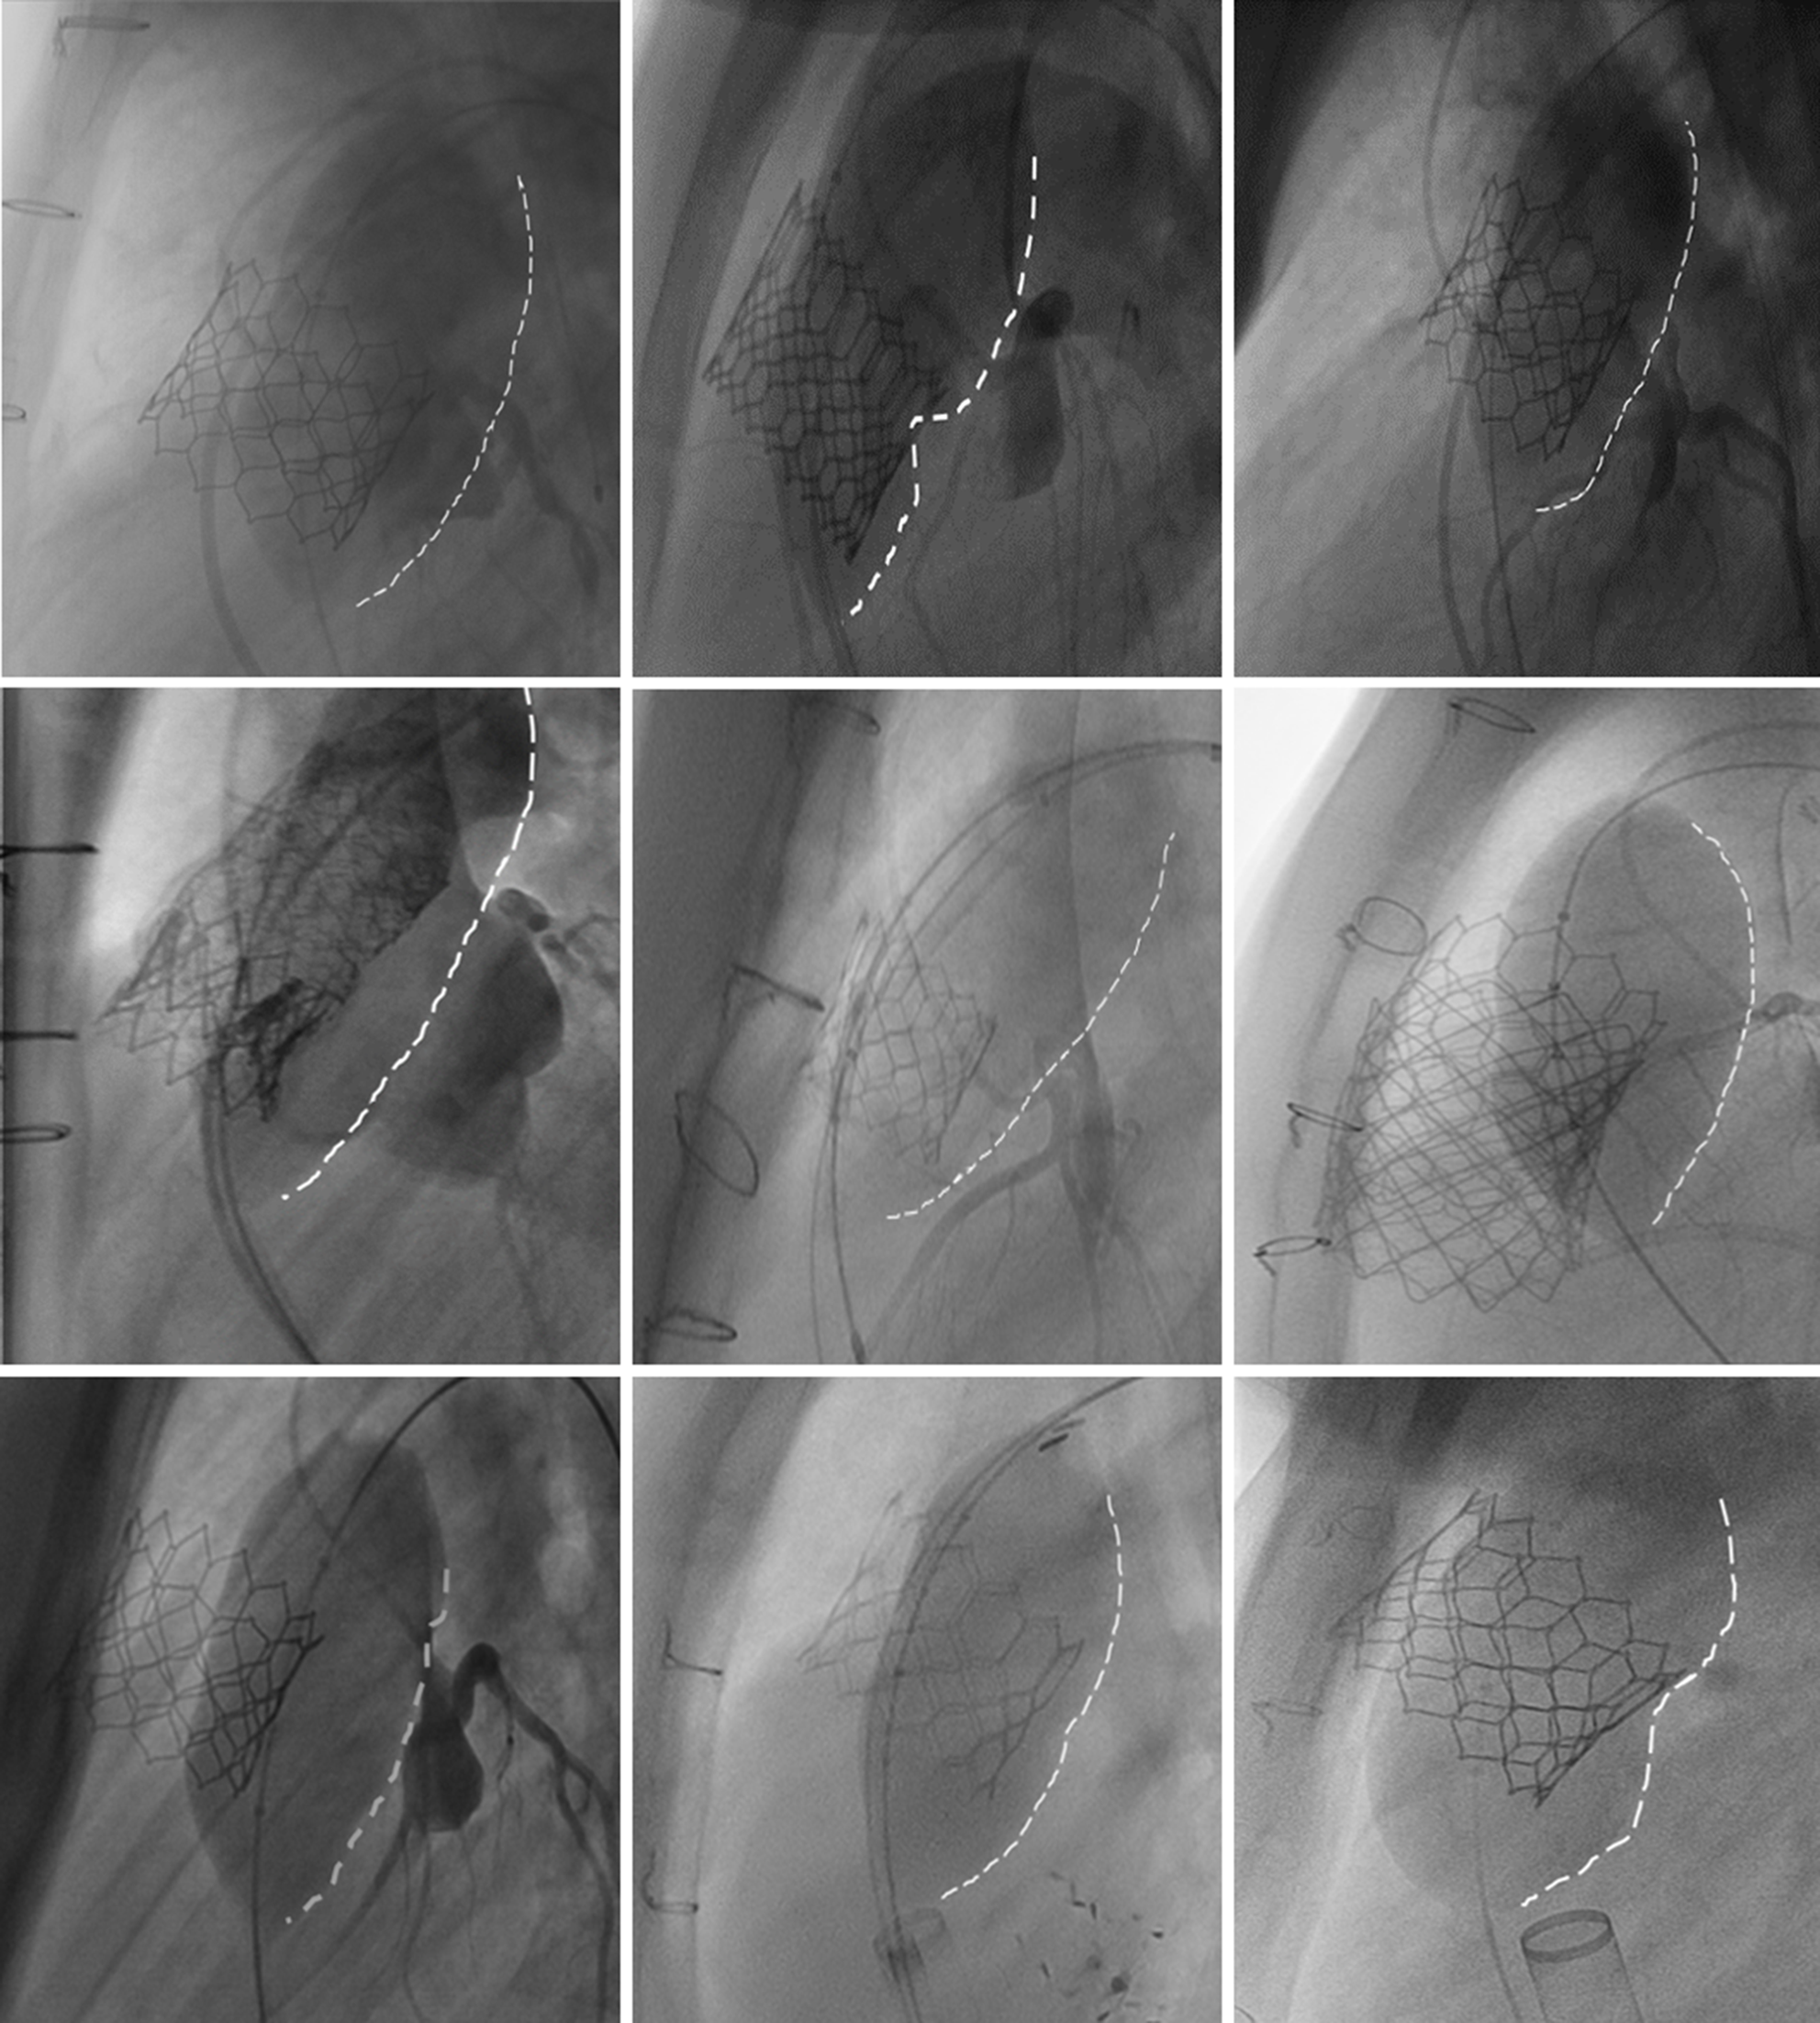
Figure 2. Posterior position of the testing balloon compared to the valve. In these examples, we have overlaid the coronary compression balloon test with the final valve image at the same angiographic angle. In each case, you can easily see that the balloon position is more posteriorly positioned that the final valve position. It is not clear how each individual part of the heart (specifically, the right ventricular outflow tract and the aortic root and coronary arteries) moves during balloon testing; therefore, we limited our analysis to determine the relative position of the posterior border of the right ventricular outflow tract [posterior border of the balloon (white-dashed line) or valve frame] with respect to the posterior wall of the sternum.
After a quantitative and qualitative review of the images, patient studies were classified as demonstrating an ‘inaccurate balloon test’ if the following two criteria were met.
-
1. A difference of 5 mm or more was found when comparing the distance between the right ventricular outflow tract posterior wall and the sternum at time points T1 and T2.
-
2. A qualitative misalignment between the balloon position and the valve position was noted with an overlay of the two images, without discrepancy in the relative position of other structures that would suggest an alignment issue between T1 and T2. Also, the clinical presence of coronary compression after valve implantation would have classified the test as an inaccurate balloon test.
If both of these criteria were not met, the studies were deemed to have described an ‘accurate balloon test’. The process of image overlay is explained in figure A in the supplementary material.
Statistical analysis
Statistical analysis was performed using SPSS version 22 (SSPS, Chicago, Illinois). Categorical data were summarised by frequency and percentage. Continuous data were classified based on their distribution, using mean and standard deviation for parametric data and median and interquartile range for non-parametric.
Association for categorical data was evaluated using the Pearson χ 2 test, and the strength of association was measured through Cramer’s V. The difference between continuous variables was tested with the Mann–Whitney U-test. For all our analyses, an alpha of 0.05 was established.
Results
Population and procedural description
From January 2018 to December 2019, 84 patients underwent pulmonary valve implantation at our centre, 36 of whom had archived calibrated imaging studies that allowed scrutiny of balloon and valve position at the same X-ray viewing angle.
During this period, patients were predominantly male (75%), with a median age of 17 years (IQR 15 years). Median weight was 53.5 kg (IQR = 31.1), and median BMI was 20.2 kg/m2 (IQR = 6.2 2 kg/m2). Tetralogy of Fallot was the most common cardiac diagnosis (55.6%), and patients with right ventricular outflow tract conduits were the most common substrate overall (50%), and the most common indication for valve replacement was a combination of valve stenosis an insufficiency (63.9%).
During pulmonary valve implantation for balloon testing, the wire most commonly for guidance was the Amplatzer Super stiff (Boston Scientific, Natick, MA, USA) (55.6%), and the balloon most frequently used was Atlas (BARD Peripheral Vascular Inc., AZ, USA) (44.4%). The valve most frequently deployed was Edwards Sapien S3 (77.8%) with a median device size of 23 mm (IQR = 4 mm). These results are summarised in Table 1.
Table 1. Baseline and procedural characteristics

Values are median (IQR) or n (%).
BMI = body mass index; RVOT = right ventricle outflow tract; TGA = transposition of great arteries; TOF = tetralogy of Fallot.
* = p < 0.05.
None of the patients in our cohort during this period had clinical or imaging evidence of coronary compression after either balloon testing or after valve implantation.
Balloon test performance
Quantitative assessment
When the difference in distance between the posterior border of right ventricular outflow tract and the sternum at T1 and T2 was evaluated, we found a mean difference of 2.9 ± 5.1 mm (range −11.0, 17.9 mm). The average difference and the range for the three measurement performed for the quantitative assessment are summarised in Table 2.
Table 2. Measurements between the posterior border of right ventricular outflow tract and the sternum.

Values are mean ± SD (range).
M = measurement.
Based on the wide range of differences between these two time points, and given the quantitative normality of the data set, we evaluated its distribution and compared it with an ideal range distribution of 0 ± 5 mm. For our data, a wider distribution than this was seen, mostly deviated to the right, practically implying that a more posterior position of the right ventricular outflow tract with the balloon inflated was observed when compared with the position after the valve deployment (Fig 3).

Figure 3. Distribution of the observed difference between the right ventricular outflow tract posterior wall at T1 and T2. (a) Comparison between the distribution observed in our population (dark line) and the ideal distribution expected for this test (grey line). (b ). Posterior position of the balloon compared with the final position of the valve.
Associated factors
Based on the overlaid images and the quantitative assessments, 13 cases were classified as having inaccurate balloon test (36.1%). Data from these 13 cases were then compared with data from the cases classified as ABT. As summarised in Table 1, the variables associated with inaccurate balloon test were previous right ventricular outflow tract subsets (p = 0.005, Cramer’s V = 0.546), balloon used during BT (p = 0.042), and size of the implanted device (inaccurate balloon test = 29 mm versus ABT = 23 mm, p < 0.001). The rest of variables (age, sex, weight, BMI, cardiac diagnosis, indication for replacement, wire used during BT, and type of device implanted) were not significant.
Discussion
The concept of coronary compression and the evolution of tests to try and predict it continue to provide consternation for congenital interventional cardiologists. Our study does not provide any new method or predictor for compression; instead, it seeks to partially quantify the inherent inaccuracy of using balloon testing to predict coronary compression.
In this study, our arbitrary definition of an inaccurate coronary balloon test was met in 36.1% of cases. A difference in the position of the testing balloon and the eventually positioned valve of as much as 18 mm was found.
Among all the baseline characteristics, the right ventricular outflow tract substrate was the only feature that showed an association with an inaccurate balloon test, with conduits demonstrating less variation between balloon and valve. The relative rigidity and fixation of a conduit may improve its spatial stability during coronary balloon test and decrease the degree of anatomical deformation induced by a stiff wire and long balloon. Moreover, where the substrate was a native outflow tract, the test was mostly classified as inaccurate (66.7%), suggesting that the outflow tract and its associated anatomy was softer and more malleable, rendering it more prone to deformation during the balloon coronary compression test.Reference Schievano, Coats and Migliavacca17,Reference Schievano, Capelli and Young18
In those patients in whom the indication for valve replacement was predominant stenosis, the coronary assessment was also more accurate, aligning with the findings related to conduits, with the stiffness in right ventricular outflow tract limiting the transitory deformation during balloon assessment; hence, this is probably not an independent risk factor but instead a demonstration of two codependent variables. Previous studies have shown how some anatomical features increase inaccuracy during coronary assessment, supporting our assertion that right ventricular outflow tract substrate characteristics are predictably associated with the degree of accuracy of compression testing.Reference Schievano, Capelli and Young18–Reference Tanase, Georgiev, Eicken and Ewert22
Among the procedural characteristics, the use of sizing balloons was observed more frequently in the group with an inaccurate test; however, the fact that our practice is to use a sizing balloon in native outflow tracts and a reinforced Kevlar balloon when assessing conduits and calcified stenosis suggests that the balloon type is not a truly independent predictor. This issue has been previously described when MRI or CTA-reconstructed images are superimposed in right ventricular outflow tract during pulmonary valve implantation.Reference Goreczny, Zablah, McLennan, Ross and Morgan15
When the type of device implanted was evaluated, we found a lower frequency of Melody valves in the group with an inaccurate test. This finding did not present a statistical association, and it is necessary to clarify that in our centre Melody valves are not used for native right ventricular outflow tract pulmonary valve implantation. Hence, the type of valve goes along with the outflow tract substrate. The same can be said for the balloon and hence eventually valve size, both of which are linked completely to the substrate being a conduit or not.
Without a doubt, the ability to predict the likelihood of a pulmonary valve implantation causing coronary compression is complex and unclear. Intuition tells us that the concept of balloon coronary compression testing is likely inaccurate but more likely to result in false positives than false negatives. This assumption is supported by our analysis which suggests that the combination of a stiff wire and long balloon being held taught around the outflow tract produces more posterior deviation of the right ventricular outflow tract than an unconstrained relatively short valve and stent frame. A true like-for-like comparison could have been achieved by contrasting a 3DRA coronary angiogram after valve placement with the 3DRA coronary angiogram during balloon sizing. But, as mentioned in the methods section, coronary assessments after valve placement without clinical concerns are rarely indicated. As this study represents a retrospective assessment of our routine clinical practice, we felt that our surrogate markers were relevant and justifiable.
In the future, preprocedural MRI and CT may fulfill the promise of a predictive computational model to predict coronary compression. Perhaps before that, the development of virtual reality platforms may allow us to improve our understanding of the dynamic relationship between the coronary arteries and the outflow tract. Until then, we are left with semiquantitative analysis from CT and MRI and very qualitative assessment of the likelihood of coronary compression based on balloon testing. Intuition, clinical experience, and our study tell us that this test is likely to create significantly more false positives than false negatives. We have no way of quantifying the error in prediction but know that for every balloon test which deems an outflow tract unsuitable based on likely compression of the coronary artery, a patient and family along with their clinical team have to submit to open-heart surgery for replacement of their pulmonary valve, partly on the basis of a suboptimal arbitrary test.
Conclusion
Based on our findings, balloon coronary testing is not an accurate method of predicting the right ventricular outflow tract position after valve implantation. This may translate to a high rate of false positives for the likelihood of coronary compression in the wider pulmonary valve implantation population.
Supplementary material
To view supplementary material for this article, please visit https://doi.org/10.1017/S1047951121000366
Financial support
This research received no specific grant from any funding agency, commercial or not-for-profit sectors
Conflicts of interest
None.
Ethical standards
Data collection and analysis were conducted under the permission of the Children’s Hospital of Colorado Institutional Review Board (Record IRB number 18-2138).


