Long-term survival has increased markedly in infants born with congenital heart disease (CHD) and has led to increased interest in the longer term morbidities among survivors.
Early growth is known to be abnormal in patients with CHD. The incidence of small-for-gestational age status at birth is significantly increased in many forms of CHD,Reference Levy, Rosenthal, Fyler and Nadas 1 and subsequent failure to thrive is common.Reference Medoff-Cooper and Ravishankar 2 , Reference Cameron, Rosenthal and Olson 3 For example, in staged surgical repair of hypoplastic left heart syndrome, weight Z-score falls between birth and Stage I repair, falls further between Stage I and Stage II repairs, and then variable amounts of catch-up growth occurs after Stage II.Reference Medoff-Cooper and Ravishankar 2 - Reference Hehir, Cooper, Walters and Ghanayem 4 Poor growth is known to be a risk factor for poor surgical outcomes.Reference Hehir, Cooper, Walters and Ghanayem 4 The longer term growth of patients with complex CHD is poorly described, although there are limited data that they remain lighter and shorter than their peers.Reference Ohuchi, Miyamoto and Yamamoto 5
In other populations, a rapid gain in weight or body mass index during childhood is a risk factor for cardiovascular mortality, type 2 diabetes, and hypertension, especially in those who were smallest at birth.Reference Barker, Eriksson, Forsen and Osmond 6 , Reference Forsen, Osmond, Eriksson and Barker 7 For example, body mass index at 11 years is a risk factor for CHD, particularly in those whose body mass index is low at 2 years.Reference Barker, Osmond, Forsen, Kajantie and Eriksson 8 A 1 SD increase in weight Z-score or height Z-score between 7 and 15 years of age has been associated with increased odds of developing type 2 diabetes.Reference Forsen, Osmond, Eriksson and Barker 7 Despite this, patterns of weight and body mass index gain during childhood have not been well described in CHD.
In this study, we examined the weight, height, and body mass index growth in a large retrospective cohort of children born with six common CHD diagnoses: coarctation of the aorta, hypoplastic left heart syndrome, single ventricle physiology, tetralogy of Fallot, transposition of the great arteries, and ventricular septal defects. We hypothesised that both gender and cardiac diagnosis would affect measures of body size – weight, length, or head circumference – at 2 years of age, and growth in body size – weight, length, or head circumference – in early childhood (2–7 years), mid/late childhood (8–15 years), and for the entire childhood/ adolescent period (2–20 years), and that the measures would differ from the healthy reference population.
Materials and methods
Data collection
This was a retrospective mixed cross-sectional and longitudinal chart review. Institutional Review Board approval was obtained, including a waiver of the need for written consent.
Patients were identified by a search of the University of California-Davis electronic medical record using the proprietary Cohort Discovery tool (based on i2b2, National Center for Biomedical Computing). Data were extracted from the electronic medical record for all patients with an International Statistical Classification of Diseases and Related Health Problems version 9 (ICD9) code for a congenital heart diagnosis who were aged <25 years of age during the period July, 1987–July, 2012.
Each individual patient chart was then reviewed to confirm the diagnosis, gender, and other relevant data. We collected weight and height measurements from electronic medical records, in-patient records, out-patient records, subspecialty clinical records, scanned notes from outside medical record systems, and from dictated notes uploaded to the electronic medical record. Additional data including genetic diagnoses or chromosomal abnormalities were determined by review of laboratory and cytogenetic data, notation within a physician’s dictated note of a confirmed diagnosis, or a presumptive diagnosis documented by a paediatric geneticist. The same sources were used to determine whether patients had been preterm (gestational age <36 weeks at birth). All information was entered into a database with patient identifiers removed.
For this analysis, patients were included if they had one of the following six diagnosis:
-
∙ coarctation of the aorta;
-
∙ hypoplastic left heart syndrome;
-
∙ single ventricle physiology;
-
∙ tetralogy of Fallot;
-
∙ transposition of the great arteries;
-
∙ ventricular septal defects.
Patients were excluded if they were preterm (gestational age <36 weeks) or had any genetic, chromosomal, or syndromal diagnoses. Data from eligible patients were included if they were aged between 2.0 and 19.99 years of age at the time the measurement was made.
To prevent over-sampling of data from periods when patients presented to the medical system more frequently, for example, perioperatively, we imposed an a priori limit of the frequency of data sampling. If >1 data point was available for a given subject within a 1-month period, only the first measurement was included in the analysis.
Quality control
Anthropometric data were plotted and potential outliers identified using a scattergram. Questionable data, including all data that were >3 SDs from the mean, were reviewed in the patients’ chart to confirm accuracy. Any weight or height that was >5 SDs from the age- and gender-specific mean were omitted.
The cardiac diagnosis was reviewed, and a final determination of diagnosis made by one of the authors (G.W.R.).
Calculations
Body mass index was calculated from the equation,
 $${\rm Body \,mass \,index}=\left( {{\rm Weight \,in \,kg}} \right)/\left( {{\rm Height \,in \,m}} \right)^{{\rm 2}} $$
Weight, height, and body mass index were converted to age- and gender-specific Z-scores using the published age-specific lambda, mu, and sigma data from the Center for Disease Control and Prevention growth chart data set.Reference Kuczmarski, Ogden and Guo 9
Statistical analysis
The effect of cardiac diagnosis on weight, height, body mass index, weight Z-score, and body mass index z-score was assessed using a series of mixed-effects linear models.
In the initial model, the anthropometric outcome of interest (e.g. weight Z-score) was the dependent variable; age, gender, and cardiac diagnosis were entered as fixed independents, and “subject” was entered as a random-effect independent. To assess whether cardiac diagnosis affected the relationship between age and the anthropometric variable, the interaction between age and diagnosis was included in the model. If there was an interaction between age and diagnosis, this was taken to mean that the relationship between anthropometry and age varied according to the cardiac diagnosis, and analysis was repeated for each diagnosis separately.
In the second set of analysis, models were constructed for each of the six cardiac diagnoses separately. Age, gender, and the interaction between age and gender were the fixed-effect independents, “subject” was a random-effect independent, and the anthropometric outcome of interest (e.g. weight Z-score) was the dependent. If there was no interaction between age and gender, the main effect p-values for the intercept at 2 years, for age, and for gender were calculated. If there was an age by gender interaction, each gender was analysed separately, and the main effect p-values for age and the 2-year intercept were calculated.
The effect of age on weight, length, and body mass index Z-score was assessed for the entire age ranging from 2 to 20 years, as well as for periods 2–7 years and 8–15 years separately. Comparisons of body size – weight, height, and body mass index – at 2 years between cardiac patients and the normal patients were made from the model covering the entire age range. If the 2-year intercept was significantly different from zero, the patients were significantly different from the normal dataset at the age of 2 years. Similarly, if the coefficient for the effect of age was significantly different from zero, the rate of growth (of weight, height, or body mass index) was significantly different from the age- and gender-specific normal data.
A p-value of <0.1 was taken as a suggestion of an interaction between independent variables, otherwise a p-value of <0.05 was taken to be significant. Data are given as mean±SD for Normally distributed data, and as mean (interquartile range) for skewed data, unless otherwise noted. All analyses were carried out using JMP-Pro 11.0 (SAS Institute, Cary, North Carolina, United States of America).
Results
Patient demographics
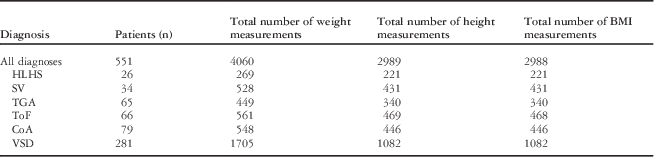
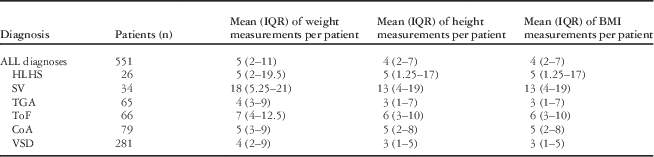
Data were available on 551 patients. There were more male (n=300) than female (n=251, p=0.0368) patients. The number of patients with each of the individual cardiac diagnoses, the total number of weight, height, and body mass index measurements, as well as the mean (interquartile range) of measurements per patients are summarised in Table 1 and Table 2. The largest number of data points was available for ventricular septal defects (Table 1), but the largest number of measurements per patient was for single ventricle physiology (Table 2). The median age of data collected was 7.5 years – interquartile range from 4.1 to 12.7 years – with more data collected at earlier ages (Figure 1).

Figure 1 The number of data points collected at different ages for the entire cohort.
Table 1 Total number of patients, weight measurements, height measurement, BMI measurements in the entire cohort, and for patients with CoA, HLHS, SV, TGA, ToF, and VSD.

BMI=body mass index; CoA=coarctation of the aorta; HLHS=hypoplastic left heart syndrome; SV=single ventricle physiology; TGA=transposition of the great arteries; ToF=tetralogy of Fallot; VSD=ventricular septal defects
Table 2 Median (interquartile range) of number weight, height, and BMI measurements for patients with CoA, HLHS, SV, TGA, ToF, and VSD.

BMI=body mass index; CoA=coarctation of the aorta; HLHS=hypoplastic left heart syndrome; SV=single ventricle physiology; TGA=transposition of the great arteries; ToF=tetralogy of Fallot; VSD=ventricular septal defects
Growth age 2–20 years
Weight Z-score
In the mixed-effect linear model, weight Z-score was significantly affected by cardiac diagnosis (p<0.0001), age (p<0.0001), and gender (p=0.0064). There was also significant interaction between cardiac diagnosis and age (p<0.0001), and therefore the effect of age on weight Z-score was assessed for each diagnosis individually.
There was a significant interaction between the effects of age and gender on weight Z-score for patients with hypoplastic left heart syndrome, single ventricle physiology, or ventricular septal defects. Therefore, the effect of age on weight Z-score in these specific diagnoses was assessed for each gender separately (Table 3). There was no significant age–gender interaction for patients with coarctation of the aorta, transposition of the great arteries, or tetralogy of Fallot. For these diagnoses, the effect of age on weight Z-score was assessed for both genders combined (Table 3).
Table 3 Results of mixed linear model examining the effects of age and gender on weight Z-score for patients with CoA, HLHS, SV, TGA, ToF, and VSD.

CoA=coarctation of the aorta; HLHS=hypoplastic left heart syndrome; SV=single ventricle physiology; TGA=transposition of the great arteries; ToF=tetralogy of Fallot; VSD=ventricular septal defects
If there was a significant interaction between age and gender, the analysis was carried out separately for male (M) and female (F) patients. If there was no significant age–gender interaction, the interaction term was removed, and the main effect coefficients and p-values given for the two genders were combined (F and M). Data are given as mean±SE (p-value). Statistically significant values are emboldened. Main effect p-values are given in parentheses
Weight Z-score at the age of 2 years was significantly reduced in female patients with hypoplastic left heart syndrome, but significantly increased in male patients with ventricular septal defects or single ventricle physiology, and in male and female patients with tetralogy of Fallot (Table 3). Gain in weight Z-score between ages 2 and 20 years was increased in patients with coarctation of the aorta, hypoplastic left heart syndrome, tetralogy of Fallot, and in male patients with single ventricle physiology or ventricular septal defects (Table 3).
Height Z-score
Height Z-score was significantly affected by age (p<0.0001), diagnosis (p=0.0003), and gender (p=0.0017), and there was a significant age–gender interaction for coarctation of the aorta, hypoplastic left heart syndrome, transposition of the great arteries, and ventricular septal defects but not for single ventricle physiology or tetralogy of Fallot.
Height Z-score at 2 years of age was significantly reduced in hypoplastic left heart syndrome, single ventricle physiology, and tetralogy of Fallot, and significantly increased in ventricular septal defects (Table 4). Change in height Z-score between 2 and 20 years was abnormal in all groups except female patients with transposition of the great arteries (Table 4). Gain in height Z-score was increased in hypoplastic left heart syndrome, single ventricle physiology, tetralogy of Fallot, and in male patients with transposition of the great arteries. Height Z-score fell significantly in female patients with coarctation and male patients with ventricular septal defects, but increased in male patients with coarctation and female patients with ventricular septal defects (Table 4).
Table 4 Results of mixed linear model examining the effects of age and gender on height Z-score for patients with CoA, HLHS, SV, TGA, ToF, and VSD.

CoA=coarctation of the aorta; HLHS=hypoplastic left heart syndrome; SV=single ventricle physiology; TGA=transposition of the great arteries; ToF=tetralogy of Fallot; VSD=ventricular septal defects
If there was a significant interaction between age and gender, the analysis was carried out separately for male (M) and female (F) patients. If there was no significant age–gender interaction, the interaction term was removed, and the main effect coefficients and p-values given for the two genders were combined (F and M). Data are given as mean±SE (p-value). Statistically significant values are emboldened. Main effect p-values are given in parentheses
Body mass index Z-score
Body mass index Z-score at 2 years of age was significantly increased in transposition of the great arteries, and in coarctation of the aorta (male only) and decreased in hypoplastic left heart syndrome (female only). Body mass index Z-score gain between 2 and 20 years was increased in coarctation of the aorta (female only), hypoplastic left heart syndrome (female only), and ventricular septal defects, and decreased in single ventricle physiology (female only) and in transposition of the great arteries (both genders) (Table 5).
Table 5 Results of mixed linear model examining the effects of age and gender on BMI Z-score for patients with CoA, HLHS, SV, TGA, ToF, and VSD.

BMI=body mass index; CoA=coarctation of the aorta; HLHS=hypoplastic left heart syndrome; SV=single ventricle physiology; TGA=transposition of the great arteries; ToF=tetralogy of Fallot; VSD=ventricular septal defects
If there was a significant interaction between age and gender, the analysis was carried out separately for male (M) and female (F) patients. If there was no significant age–gender interaction, the interaction term was removed, and the main effects coefficients and p-values given for the two genders were combined (F and M). Data are given as mean±SE (p-value). Statistically significant values are emboldened. Main effect p-values are given in parentheses
Body size at 2 years
This was determined from the final models developed for the assessment of growth over the entire range of 2–20 years. The intercept (at 2 years) was used to evaluated the body size at 2 years and is reported in Tables 3, 4, and 5.
Growth 2–7 years
Weight Z-score
Weight Z-score was significantly affected by diagnosis (p=0.0014) and age (p<0.0001).
Weight gain between 2 and 7 years was greater than normal for male patients with hypoplastic left heart syndrome or transposition of the great arteries, female patients with coarctation of the aorta and for male, and female patients with ventricular septal defects or tetralogy of Fallot. Gain in weight Z-score was lower than expected in female patients with single ventricle physiology or hypoplastic left heart syndrome, and in male patients with coarctation of the aorta. The only groups with normal weight Z-score gains were the male patients with coarctation of the aorta and female patients with single ventricles or hypoplastic left heart syndrome (Table 6).
Table 6 Rate of change in weight, height, and BMI Z-score between 2 and 7 years of age. Data are given as mean±SE (p-value).

BMI=body mass index; n=number of observations
Significant values are shown emboldened. Main effect p-values are given in parentheses
Height Z-score
Height Z-score between 2 and 7 years differed significantly between cardiac diagnoses (p=0.0105).
Height Z-score fell with increasing age in all groups except single ventricle physiology, where it was unchanged, and female patients with tetralogy of Fallot, where it increased.
Body mass index Z-score
Body mass index Z-score increased significantly in 3 groups during early childhood (2–7 years): ventricular septal defects, and female patients with coarctation of the aorta or hypoplastic left heart syndrome (Table 7). The magnitude of increase was large. Average body mass index Z-score increased by >1 unit over the 5-year period in female patients with coarctation of the aorta or hypoplastic left heart syndrome, and increased by 2/3 of a unit in patients with ventricular septal defects (Table 6).
Table 7 Rate of change in weight, height, and BMI Z-score between 7 and 15 years of age.

BMI=body mass index; n=number of observations
Data are given as mean±SE (p-value). Significant effects are shown emboldened. Significant values are shown emboldened. Main effect p-values are given in parentheses
Growth 8–15 years
Weight Z-score
Changes in weight Z-score between 8 and 15 years were in opposite direction to the changes seen in weight Z-score between 2 and 7 years for several of the groups, for example, hypoplastic left heart syndrome. However, increases in weight Z-score were seen in patients with tetralogy of Fallot and in male patients with ventricular septal defects during both time periods (Table 7).
Height Z-score
Once again, the changes in height Z-score during this period (8–15 years) were often in the reverse direction to the prior period (2–7 years), for example, in coarctation of the aorta, and in female patients with hypoplastic left heart syndrome (Table 7). However, height Z-score declined in female patients with ventricular septal defects during both periods.
Body mass index Z-score
Body mass index Z-score fell in patients with hypoplastic left heart syndrome, single ventricle physiology, and transposition of the great arteries during this time period. However, it increased in those with coarctation of the aorta and tetralogy of Fallot, and was unchanged in those with ventricular septal defects (Table 7).
Discussion
We have examined the growth of a large retrospective cohort of patients with six common CHD diagnoses, and compared them with age- and gender-specific norms. Growth in weight, height, and body mass index was often abnormal in this population, and varied based on the specific cardiac lesion, the patient’s gender, and whether early or mid-childhood growth was considered (Figure 2).

Figure 2 Summary of growth rates – change in weight, height, and body mass index Z-score – between 2–7 years and 8–15 years in patients with coarctation of the aorta, hypoplastic left heart syndrome (HLHS), single ventricle physiology, transposition of the great arteries, tetralogy of Fallot, or ventricular septal defects (VSD).
The most sticking abnormalities at the age of 2 years were seen in hypoplastic left heart syndrome, single ventricle physiology, and tetralogy of Fallot. Patients with hypoplastic left heart syndrome had significantly reduced weight and height at 2 years of age, although the difference in weight in male patients just failed to reach statistical significance. Patients with single ventricle physiology were short at 2 years of age, but had relatively normal body weights, and those with tetralogy of Fallot were short at 2 years of age, but relatively overweight. Patients with these three diagnoses also had abnormal growth after 2 years of age. Female patients with hypoplastic left heart syndrome and single ventricle physiology had catch-down weight gain during early childhood (2–7 years), and male patients with the same conditions had catch-down weight gain during later childhood (8–15 years), and a fall in body mass index Z-score during childhood. In contrast, patients with tetralogy of Fallot had excessive weight gain during childhood, and this was true for the entire period of childhood (2–20 years) and for the periods 2–7 years and 8–15 years individually. This resulted in a significant increase in body mass index Z-score during childhood, which was more apparent in mid/late childhood rather than in early childhood.
Childhood growth was also abnormal in a more common form of CHD: ventricular septal defects. Female but not male patients with ventricular septal defects were heavier and taller than the reference population at 2 years. Both genders showed excessive gains in weight and body mass index Z-score in early childhood but slower than expected gains in height.
The consequences of these abnormal growth patterns in children with a history of CHD are unknown. However, in healthy term infants, similar childhood growth patterns are known to be associated with increased metabolic risk. For example, in the retrospective Helsinski birth cohort studies, small body size at 2 years of age and rapid growth after 2–3 years of age are known to be risk factors for CHD, hypertension, and diabetes.Reference Barker, Eriksson, Forsen and Osmond 6 - Reference Griffin 10 Larger body size at any time in childhood was a risk factor for adult obesity.Reference Griffin 10 The data from prospective observational cohorts of term infants are similar. In the population-based Avon Longitudinal Study of Pregnancy and Childhood, greater childhood weight gain between 2 and 10 years of age was associated with higher blood pressure in later life.Reference Jones, Charakida and Falaschetti 11 In the Stockholm Weight Development Study, the rate of weight gain between 3 and 6 years of age was a risk factor for increased adiposity at 17 years.Reference Ekelund, Ong and Linne 12 “Rapid growth” between 3 and 6 years of age, defined as an increase in weight Z-score of >0.67, was associated with a significant increase in body fat at the age of 17 years.Reference Ekelund, Ong and Linne 12 This definition of rapid growth is used in many studies as a marker for increased metabolic risk,Reference Griffin 10 and in our study several of the groups had mean rates of weight gain that would qualify as rapid between 2 and 7 years – for example, female patients with coarctation of the aorta, single ventricle physiology, or hypoplastic left heart syndrome – or 8–15 years – for example, female patients with single ventricle physiology, or tetralogy of Fallot. Therefore, the growth abnormalities we have described are relatively large and could have significant effects on subsequent health and well-being, and later on the quality of life.
There is some evidence that obesity is common in children with a history of CHD, although it may be poorly recognised by caregivers.Reference Pinto, Marino and Wernovsky 13 Systolic blood pressure is higher in obese children than in overweight children, and higher in overweight children than in normal weight children, and this effect is more pronounced for children with a history of CHD than for their peers.Reference Pinto, Marino and Wernovsky 13
We are aware of only one study that has carried out glucose tolerance tests in adults with a history of childhood CHD.Reference Ohuchi, Miyamoto and Yamamoto 5 Ohuchi et al studied 205 adults (between 16 and 60 years) with a history of unrepaired or repaired childhood CHD and 27 healthy controls.Reference Ohuchi, Miyamoto and Yamamoto 5 After a 75 g oral glucose load, the glucose area under the curve was significantly higher in the CHD groups than in the controls, indicating poorer glucose tolerance.Reference Ohuchi, Miyamoto and Yamamoto 5 Among the CHD group, 37% had impaired glucose tolerance compared with 4% of the controls. An additional 9% of the patients in the CHD group met the diagnostic criteria for diabetes mellitus, whereas none of the controls did.Reference Ohuchi, Miyamoto and Yamamoto 5
Although our study raises important questions about growth in children with CHD, it has a number of limitations. The data were collected for clinical care rather than research reasons and the quality control of data collection, and entry, reflects clinical standards not research standards. However, we went to considerable lengths to exclude spurious data points, and the additional variability caused by transcription or measurement errors would be more likely to cause a Type II error, not a Type I error. Data were collected from patients when they presented to the health system, irrespective of the reason. The data set may therefore over-represent sicker or more complex patients who may present for medical care more often. Alternatively, children with more challenging social or family circumstances may be unrepresented if they presented less often to the health-care system. Finally, it is possible that times of acute illness, when patients are in-patients in hospital and weighed frequently, may be over-represented. However, to limit over-sampling of data points during times of hospital admissions and acute illnesses, we limited growth measurements used in the analysis to no more frequently than once every month.
In this retrospective study, it is not possible to assess the causes of growth abnormalities. The in utero or ex utero hemodynamic effects of the specific lesions might alter growth and development of the organs during critical periods, leading either to long-term effects on organ size, or to epigenetic modifications; the abnormal growth in the first few years of life owing to critical illness and surgeries may play a part either directly or indirectly. Medications such as diuretics and corticosteroids commonly used in these patients may also have a role. Alternatively, behavioural factors may be in play. Growth, and weight gain, is a major focus of the care provided to patients with critical heart lesions, and in staged repairs adequate weight may be a requirement for surgery. It is possible that this focus is carried on by parents through the rest of childhood, and weight gain and larger body size may be seen as the visible manifestations of “good health”. Alternatively, nutritional modifications utilised to improve infantile growth may lead to behavioural effects or taste preferences that may lead to excessive weight gain later in life. Finally, parental anxiety may be reflected by limiting or discouraging vigorous physical activity such as playing sports in patients with CHD.
Irrespective of the reasons for the abnormal childhood growth observed in this population, the magnitude of the effect in some sub-groups is large and could be associated with clinically significant increases of metabolic diseases. These risks should be further evaluated in prospective studies.
Financial Support
This research received no specific grant from any funding agency, commercial, or not-for-profit sectors.
Conflicts of Interest
None.
Ethical Standards
Approval was obtained from the University of California-Davis Institutional Review Board, including a waiver of the need for written consent.