


Introduction
Forest composition and structure can influence susceptibility of plant communities to invasion by non-native herbivores (Mack et al. Reference Mack, Simberloff, Lonsdale, Evans, Clout and Bazzazz2000; Von Holle et al. Reference Von Holle, Delcourt and Simberloff2003; Yates et al. Reference Yates, Levia and Williams2004; Jactel et al. Reference Jactel, Brockerhoff and Duelli2005). For example, the presence of high density and diversity of host plant species can result in higher populations of insect herbivores if host quality is maintained. Niemelä and Mattson (Reference Niemelä and Mattson1996) suggested that diverse North American forest communities facilitate the establishment of European phytophagous insects by providing more potential hosts for invaders. Jactel et al. (Reference Jactel, Goulard, Menassieu and Goujon2002) indicated that higher plant diversity may also impede invasion by non-native insects if it enhances mortality from natural enemies, observing that the percentage maritime pine (Pinus pinaster Aiton (Pinaceae)) colonised by pine stem borer (Dioryctria sylvestrella (Ratzeburg)) (Lepidoptera: Pyralidae) decreased as plant diversity increased because of higher parasitism rates. Also, high diversity of non-host plants may interfere with host location by insects, for example by masking host volatiles, and reducing host quality through interspecific resource competition (Zhang and Schlyter Reference Zhang and Schlyter2004; Jactel et al. Reference Jactel, Biefweaaon, Andersson and Schlyter2011). Conversely, impact of herbivory may be higher on low-density species, if the specialised herbivores are able to locate and concentrate on rare, isolated hosts.
North American forests have a long history of disturbance by non-native, invasive insects, and pathogens such as gypsy moth (Lymantria dispar (Linnaeus)) (Lepidoptera: Lymantridae), hemlock woolly adelgid (Adelges tsugae (Annand)) (Hemiptera: Adelgidae), and the causal pathogens of Dutch elm disease (Ophiostoma ulmi (Buisman) Melin and Nannfeldt; Fungi: Ophiostomataceae) and chestnut blight (Cryphonectria parasitica (Murrill) Barr; Fungi: Cryphonectriaceae) (Lovett et al. Reference Lovett, Canham, Arthur, Weathers and Fitzhugh2006; Gandhi and Herms Reference Gandhi and Herms2010a). These non-native organisms have caused widespread mortality of dominant canopy trees resulting in significant ecological and economic consequences in their introduced range (Liebhold et al. Reference Liebhold, MacDonald, Bergdahl and Mastro1995). More recently, the non-native wood-boring insect emerald ash borer (EAB), Agrilus planipennis Fairmaire (Coleoptera: Buprestidae), has caused widespread mortality of ash (Fraxinus Linnaeus (Oleaceae)) where it has established in North America (Cappaert et al. Reference Cappaert, McCullough, Poland and Siegert2005; Herms and McCullough Reference Herms and McCullough2014; Klooster et al. Reference Klooster, Herms, Knight, Herms, McCullough and Smith2014). Emerald ash borer larvae feed on the phloem and outer sapwood creating serpentine galleries that girdle and kill trees generally within two to four years of appearance of symptoms (Herms and McCullough Reference Herms and McCullough2014). Unlike native wood-boring buprestid beetles such as bronze birch borer (A. anxius Gory) (Coleoptera: Buprestidae) and two-lined chestnut borer (A. bilineatus (Weber)) (Coleoptera: Buprestidae), which preferentially colonise stressed trees (Dunn et al. Reference Dunn, Potter and Kimmerer1990; Muilenburg and Herms Reference Muilenburg and Herms2012), EAB also colonises and ultimately kills healthy North American ash trees (Cappeart et al. Reference Cappaert, McCullough, Poland and Siegert2005; Knight et al. Reference Knight, Brown and Long2013). These dynamics are due to weakly defended ash trees presumably because of their lack of coevolutionary history with EAB (Liu et al. Reference Liu, Bauer, Gao, Zhao, Petrice and Haack2003; Rebek et al. Reference Rebek, Herms and Smitley2008). Emerald ash borer threatens the existence of North American ash trees as it continues to spread across the continent.
While substantial work has been conducted on the natural history, ecology, and management of EAB (Herms and McCullough Reference Herms and McCullough2014), little work has been conducted on the effects of forest structure and composition on the invasion dynamics of EAB. We therefore, investigated the susceptibility of forests to invasion by EAB in relation to forest community structure, including species diversity, total stand density and basal area, as well as density, basal area, and relative importance of ash in southeastern Michigan, United States of America.
Materials and methods
Study area
The study was conducted in the Huron River Watershed in southeastern Michigan. All stands were within Michigan State Recreation Areas or Huron-Clinton Metroparks (see Smith Reference Smith2006 for stand descriptions), and located 24–48 km from the epicentre of EAB infestation in Canton Township, Michigan (42°19'N, 83°29'W) (Siegert et al. Reference Siegert, McCullough, Liebhold and Telewski2014). The Huron River Watershed extends across western Oakland County, southeastern Livingston County, and north central Washtenaw County. The study sites are dominated by extensive areas of clay lake plains, ground moraine, end moraine, and outwash plains (Albert et al. Reference Albert, Denton and Barnes1986). There is little variation in elevation with most ridges 15–30 m in height and the tallest reaching a maximum of 60 m. Soil texture is mainly loam to clay, with sand found on outwash plains and channels.
Thirty-one stands were sampled across a range of forest habitats that varied in soil moisture, dominant overstorey species, topography, ash density, ash frequency, community composition, total basal area, and tree density (Table 1). Stands were further selected to generate a gradient ranging from hydric (intermittent standing water or submerged flood plain with mostly black ash (Fraxinus nigra Marshall) and some green ash (F. pennsylvanica Marshall) to mesic (moist generally riparian sites with mostly green ash), and xeric (drier upland sites with mostly white ash (F. americana Linnaeus). Three replicate radial plots (18 m radius), each 0.1 ha in area, were located within each stand. Upon entering a stand, a transect was established along a randomly selected compass heading between 0° and 90°. The centre of the first plot was chosen as a point 18 m from the first ash tree encountered along the transect. Each plot contained at least two mature ash trees.
Table 1 Minimum, maximum, and mean values of stand (n=31) structural variables in 2004–2005 in the Huron River Watershed of southeast Michigan.

Notes: Overall means were calculated from the individual stand means, which were the mean of three replicated 0.1 ha plots within each stand.
BA, basal area.
Within each 18 m radius main plot, all overstorey trees (diameter at breast (DBH)>12.5 cm) were identified to species and their DBH recorded. Centred within each main plot was a subplot with a radius of 8 m (0.02 ha) where all understorey tree species (DBH 2.5–12.5 cm) were identified and their DBH recorded. Eleven stands (33 plots) were surveyed in the summer of 2004 and 20 additional stands (60 plots) were established and surveyed in the summer of 2005. These stands were resurveyed for specific forest attributes including ash tree (DBH⩾2.5 cm) decline, density, and basal area in 2006–2007.
Emerald ash borer colonisation and ash canopy ratings
To quantify the impact of EAB at the individual tree and stand level, ash canopy decline of each tree was rated on scale from 1 to 5, with 1 indicating a healthy tree with no symptoms of decline; 2, 3, and 4 indicating successive degrees of canopy thinning; and 5 indicating a dead tree (Fig. 1) (Smith Reference Smith2006; Flower et al. Reference Flower, Knight, Rebbeck and Gonzalez-Meler2013; Klooster et al. Reference Klooster, Herms, Knight, Herms, McCullough and Smith2014). This rating protocol has been shown to correlate well with EAB larval density (Flower et al. Reference Flower, Knight, Rebbeck and Gonzalez-Meler2013). A plot-level canopy rating was obtained by averaging the value for each tree within a plot, and a stand-level canopy rating was obtained by averaging the means of the three replicate plots. Percentage ash mortality was determined based on the number of trees with canopy rating 5. To confirm the role of EAB as the causal agent for observed patterns of canopy decline, EAB colonisation density (combined number of emergence holes and woodpecker predation attacks/m2 of bark surface area) was recorded on the main trunk between 1.25 and 1.75 m from the base of the tree. This attribute is hereafter referred to as density of EAB signs.

Fig. 1 Rating scale used to quantify degree of ash (Fraxinus species) canopy decline, with 1 indicating a healthy ash tree, 2, 3, and 4 successive degrees of decline, and 5 a dead tree (from Smith Reference Smith2006; Flower et al. Reference Flower, Knight, Rebbeck and Gonzalez-Meler2013; Klooster et al. Reference Klooster, Herms, Knight, Herms, McCullough and Smith2014).
Community composition and structure
Mean basal area (m2/ha) and density (stems/ha) for all overstorey and understorey tree species were calculated for each stand by averaging those values for the three replicate plots within each stand. Relative dominance of ash (% ash basal area) was calculated for each replicate plot as ash basal area divided by total basal area. Relative density of ash (% ash stems) was calculated for each plot by dividing the number of ash stems by total number of stems of all species. Relative dominance and density of ash for each stand were calculated as the average of each of the three replicated plots within each stand. Shannon-Wiener Diversity Index (H') was calculated for each plot (Stiling Reference Stiling1999). The three values of H' (one for each replicate plot) were averaged to calculate mean diversity for each stand.
Ash importance values were also calculated for each stand by summing the relative dominance, relative density, and relative frequency (McCormick and Platt Reference McCormick and Platt1980). Relative frequency of the three ash species combined was determined first by calculating their absolute frequency and that of all other overstorey genera in each stand. Absolute frequency is defined as the percentage of plots within each stand where a given genus can be found. Relative frequency of ash is the absolute frequency of Fraxinus species divided by the sum of absolute frequencies for all overstorey genera found on the stand.
Statistical analyses
Pearson correlation analysis was used to quantify relationships between density of EAB signs, percentage ash mortality, and ash canopy rating and community composition variables including total and ash basal area, total and ash density, diversity, and stand distance from the epicentre (Minitab Inc. 2005). The relationship between density of EAB signs and ash canopy rating was also examined using correlation analysis. The curvilinear relationship between these variables was transformed to linear by log-transformation of density of EAB signs. Data were back-transformed for presentation. Correlation analyses were used to quantify the relationships between ash tree density (stems/ha) and percentage ash mortality in 2004–2005 and 2007 (SAS Institute 2013). Since these data were non-normal and could not be rectified by transformations, Spearman’s Rank Correlations were used for these analyses.
Analysis of variance (ANOVA) and Tukey’s pairwise comparisons were used to test for differences in density of EAB signs among white, green, and black ash species, EAB-infested stems, percentage ash mortality, and ash canopy rating (Minitab Inc. 2005). Data were first assessed for normality and homogeneity of variance. Data for percentage ash mortality and infested stems met both assumptions, while density of EAB signs were square-root transformed to meet these assumptions. The ordinal-scaled ash canopy decline ratings did not conform to these assumptions and transformation did not improve the distribution or homogeneity of variance. Hence, for ash canopy ratings, we used the non-parametric analysis of ordinal data in a two-way factorial design with three ash species and sampling year (2004–2005, 2006, and 2007) as main factors (Shah and Madden Reference Shah and Madden2004; SAS Institute 2013). The relationship between ash tree mortality and mean distance from the presumed centre of infestation in Canton Township was characterised by regression analysis for each sampling year (2004–2005, 2006, and 2007) and for each species (black, green, and white ash for 2004–2005).
Black, white, and green ash were sorted into the following six diameter classes to determine if the pattern of EAB-induced canopy decline was consistent across stem diameter size classes: 2.5–6.49, 6.5–10.49, 10.5–14.49, 14.5–18.49, 18.5–22.49, and ⩾22.5 cm DBH. Data were not normally distributed and variances were not homogeneous. Transformation of canopy ratings did not improve the distributions to meet the assumptions of ANOVA. Hence, we used the non-parametric analysis of ordinal data in a two-way factorial design with three ash species and six diameter classes as main factors (Shah and Madden Reference Shah and Madden2004; SAS Institute 2013).
Results
Overall stand attributes
Stand structure and composition were variable among stands when first measured in 2004–2005, as indicated by the minimum and maximum stand basal area, stand density, ash density, ash basal area, relative density of ash, relative dominance of ash, ash importance value, and the Shannon Diversity Index (Table 1). A total of 1611 ash trees were present in the 31 stands. The composition of ash species varied among sampled stands. White ash trees were present in all 31 stands, with four containing only white ash. Eleven stands contained a mixture of white and green ash. The remaining 16 stands contained a mixture of all three species. Green ash outnumbered the other two species with a total 697 stems in sampled plots. White and black ash numbered 478 and 436 stems, respectively. Mean (±SD) stand and ash basal areas were 26±6 and 6±3 m2, respectively. Mean tree density was 735±193 per ha, and ash density averaged 171±112 per ha. Percentage ash density and dominance of ash were 22±12 and 25±12, respectively with mean ash importance value being 62±23 (Table 1).
Forest understorey was primarily dominated by the genera Acer Linnaeus (Aceraceae), Fraxinus, Tilia Linneaus (Tiliaceae), and Ulmus Linnaeus (Ulmaeae), while Quercus Linnaeus (Fagaceae), Fraxinus, and Acer were most common in the overstorey (Fig. 2). The basal area of these species varied depending on whether they were present in hydric, mesic, and xeric stand-types (Fig. 2).
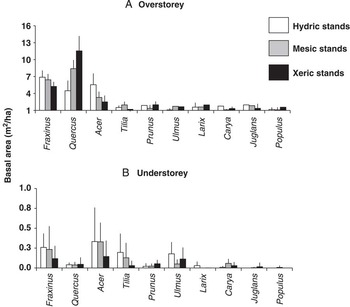
Fig. 2 Basal area of 10 most common overstorey (A) and understorey (B) tree genera in 2004–2005 in hydric (n=9), mesic (n=11), and xeric (n=11) stands in which the most common ash species were Fraxinus nigra (black), F. pennsylvanica (green), and F. americana (white) ash, respectively.
Emerald ash borer colonisation and impact
Mean density of EAB signs on bark surface at breast height ranged from 0.3 to 70.3 per m2 across all stands in 2004–2005. The overall mean (±SE) was 16.6 (±3) attacks per m2 of ash bark surface. When averaged at the stand level, mean ash canopy decline rating increased non-linearly as a function of density of EAB signs at breast height (r=0.72, P<0.001). EAB sign density did not reach high levels at breast height until canopy decline was well advanced (Fig. 3). EAB sign density was highest on black ash followed by green and white ash, although these differences were not statistically significant (P=0.25) (Table 2). Mean percentage EAB-infestation (percentage infested stems) was highest for black ash, intermediate for green ash, and lowest for white ash (F=4.58, df=2, 73, P=0.014) (Table 2).

Fig. 3 Relationship between ash canopy decline rating [stand specific means of Fraxinus nigra (black), F. pennsylvanica (green), and F. americana (white) ash], and density of EAB signs (sum of adult emergence holes and woodpecker predation attacks) in 2004–2005 on a 1 m trunk section centred at breast height.
Table 2 Impact of emerald ash borer (EAB) on black, green, and white ash, and all three species averaged across all stands and in 2004–2005 in forests of the Huron River Watershed of southeast Michigan.

Values within a column followed by the same letter are not significantly different.
In 2004–2005, the percentage of ash trees infested with EAB ranged from 9% to 86%, with the mean (±SE) of 51% (±4%) across all stands (Table 2). The average ash canopy decline rating ranged from 2.2–4.6 across all 31 stands, with a mean of 3.5 (±0.10). Percentage ash mortality ranged from 5% to 78% in sampled stands, with a mean of 42% (±4%) across all stands (Table 2). Percentage ash mortality was highest for black ash, followed by green and white ash, which did not differ (F=9.66, df=2, 73, P<0.001). Canopy decline rating of black ash was significantly greater than those of white and green ash, these latter two species did not differ (F=4.39, df=2, 73, P=0.003) (Table 2, Fig. 4). There were significant differences in canopy decline rating among ash diameter classes, with decline generally more advanced in larger size classes (F=6.03, df=3.81, 163, P<0.001), and with black ash showing more advanced decline in most diameter classes than green or white ash (F=9.91, df=1.93, 163, P<0.001), but the interaction between these variables was not significant (P=0.219) (Fig. 5). Canopy decline rating of black ash was highest in all but the two smallest diameter classes (2.5–6.49 and 6.5–10.5 cm), which did not differ among the three species. Canopy decline rating did not differ between white and green ash for any size class (Fig. 5).

Fig. 4 Mean canopy decline rating from 2004–2007 for Fraxinus nigra (black), F. pennsylvanica (green), and F. americana (white) ash across all stands (1=healthy, 2, 3, 4=successive degrees of decline, 5=dead). Comparisons are across years for each ash species.

Fig. 5 Mean canopy decline rating in 2004–2005 by diameter class at breast height for Fraxinus nigra (black), F. pennsylvanica (green), and F. americana (white) ash across all stands (1=healthy, 2, 3, 4=successive degrees of decline, 5=dead).
The non-parametric factorial test for ordinal data indicated that sampling year (F=77.95, df=1.66, 116, P<0.001), ash species (F=8.47, df=1.97, 116, P=0.004), and their interaction (F=4.18, df=3.2, 116, P=0.005) had significant effects on canopy decline. Mean ash canopy rating had increased to 4.8 in 2007 from 3.5 in 2004–2005 (Fig. 4). Black ash trees expressed about 20% greater decline than the other two ash species in 2004–2005, but differences between the three ash species were absent by 2006–2007 as mortality of all three species reached high levels (P>0.05) (Fig. 4). Percentage ash mortality ranged from 36% to 100% and the mean had increased to 84% (±7%) across all stands by 2006–2007 (Fig. 4).
Stand structure, diversity, and the impact of emerald ash borer
None of the measures of EAB impact, including stand mortality, were correlated with stand diversity (Shannon Diversity Index) or stand density, whether early in the infestation when mortality was<50% (2004–2005) or later when mortality was approaching 90% (2006–2007). In 2004–2005, there were also no relationships between stand basal area and percentage infested ash (P=0.72), ash canopy rating (P=0.25), percentage ash mortality (P=0.11) or density of EAB signs (P=0.86), nor was ash basal area correlated with canopy decline rating (P=0.35), percentage infested ash (P=0.29), percentage ash mortality (P=0.13), or EAB sign density (P=0.92). Ash density, relative density of ash, relative dominance of ash and ash importance value were also not correlated with any measure of EAB impact (percentage infested stems, percentage ash mortality, canopy rating, and EAB signs) (Fig. 6).

Fig. 6 Relationship between percentage ash (Fraxinus species) mortality and ash density (stand specific means) for all ash species combined in 2004–2005 and 2007.
Impact of emerald ash borer in relation to distance from the epicentre of invasion
Distance of the sampled stands from the presumed epicentre of the EAB infestation in Canton Township, Michigan (Siegert et al. Reference Siegert, McCullough, Liebhold and Telewski2014) ranged from 25 to 50 km, and was negatively correlated with all four measures of EAB impact (percentage ash mortality, canopy decline rating, percentage infested stems, and density of EAB signs) when averaged across all ash species. Regression analyses of percentage ash mortality and distance from Canton Township indicated a significant negative relationship in 2004–2005 (percentage ash mortality=115.79−2.11 *Distance, F= 15.2, df=1, 30, P<0.001, R 2=0.34), 2006 (percentage ash mortality=144.73−1.92 *Distance, F=14.81, df=1, 30, P<0.001, R 2=0.32), and 2007 (percentage ash mortality=113.39−0.65 *Distance, F=5.43, df=1, 30, P=0.03, R 2=0.16) (Fig. 7). The negative slope of the line remained largely unchanged between 2004–2005 and 2006 (a decrease in percentage ash tree mortality of 2% per km from the epicentre), but declined and levelled out by 2007 as percentage mortality increased in all stands. The y-intercept of the lines increased dramatically over time as percentage mortality increased (Fig. 7).

Fig. 7 Relationship between percentage ash tree mortality (stand specific means) for all ash (Fraxinus) species and distance from the epicentre of the invasion in Canton Township, Michigan from 2004 to 2007.
When percentage ash mortality versus distance to the epicentre was analysed individually for each ash species in 2004–2005, the pattern was strongest for black ash (percentage ash mortality=137.41−2.11 *Distance, F=7.64, df=1, 15, P=0.02, R 2=0.35). White ash displayed a similar pattern, but the relationship was marginally significant (P=0.08). The slope of the regression line was not as steep (−1.4), with a lower y-intercept (81.1). The same trend was evident for green ash but the regression was not significant (P=0.21). The slope was shallower (−1.1), and the y-intercept was lower still (71.9). A similar pattern was evident for the correlations between canopy rating of white, green, and black ash and distance from the epicentre, with the pattern strongest for black ash (r=−0.76, P=0.004), while correlations for white ash (P=0.45) and green ash (P=0.21) were not significant.
When averaged across all ash species in 2004–2005, the percentage of ash trees infested by EAB also decreased with increasing distance from Canton (r=−0.53, P=0.002), as did ash canopy decline rating (r=−0.40, P=0.03), indicating that crown vigour improved with distance from Canton. Density of EAB signs on all ash species also decreased with increasing distance from the epicentre but the relationship was only marginally significant (r=−0.36, P=0.07). There were no significant correlations between distance from epicentre and density of EAB signs or percentage infested trees when examined separately for each ash species.
Discussion
This four-year study (2004–2007) revealed the following major patterns as the EAB invasion of the Huron Watershed region in southeast Michigan progressed: (1) density of EAB signs was associated with increasing decline and mortality of ash trees; (2) ash canopy decline rating and mortality increased rapidly over time with little effect of tree size (although decline of the smaller size classes appeared to lag slightly behind other size classes); (3) black ash initially declined faster than white and green ash, which lagged by one to two years; (4) there was no relationship between density of EAB signs, ash canopy decline rating, or percentage ash mortality and attributes of forest structure and composition including ash density, basal area, and importance; and (5) percentage ash mortality initially declined with distance from the epicentre of the invasion, although this trend leveled off by 2007 as ash mortality increased rapidly in all stands.
Emerald ash borer caused significant decline and mortality of ash in the study area, having visibly infested 51% and killed 42% of all ash trees, respectively, in 2004–2005. The mean canopy rating across all species was 3.6 (on a scale from 1 to 5, where 1 is healthy and 5 is a dead tree) in 2004–2005 and 4.8 in 2007, indicating that the ash decline progressed rapidly to severe levels during the study. By 2010, ash mortality exceeded 99% in these stands (Klooster et al. Reference Klooster, Herms, Knight, Herms, McCullough and Smith2014). The strong correlation between density of EAB signs and ash canopy rating (Fig. 3) provides evidence that EAB was indeed the causal agent of decline and mortality. This relationship was non-linear with a sharp increase in canopy decline at low attack density that plateaued as density of attacks increased suggesting that by the time EAB attacks are apparent at breast height, colonisation and decline of the tree is in an advanced stage. This pattern is consistent with previous observations that initial attacks of EAB occur high in the canopy, with later colonisation occurring progressively lower on the stem (Cappeart et al. Reference Cappaert, McCullough, Poland and Siegert2005; Tluczek et al. Reference Tluczek, McCullough and Poland2011).
EAB sign density, canopy decline rating, percentage infested stems, and percentage mortality were all higher for black ash in 2004–2005 than for green and white ash. By 2006, there were no differences between the species in canopy decline rating and percentage mortality, which had increased to high levels for all three species. Black ash may have initially declined more rapidly because it is preferred as an oviposition host over green and white ash (Rigsby et al. Reference Rigsby, Muilenburg, Tarpey, Herms and Cipollini2014), perhaps because taxonomically it is much more closely related to Manchurian ash (F. mandshurica Ruprecht) (Jeandroz et al. Reference Jeandroz, Roy and Bousquet1997; Wallander Reference Wallander2001), which shares a coevolutionary relationship with EAB in Asia (Liu et al. Reference Liu, Bauer, Gao, Zhao, Petrice and Haack2003; Rebek et al. Reference Rebek, Herms and Smitley2008). Jeandroz et al. (Reference Jeandroz, Roy and Bousquet1997) suggested that Manchurian ash diverged from black ash evolutionarily after black ash dispersed to Asia during a period of connection between these continents in the Middle and Late Tertiary periods and then was subsequently isolated by rise in sea level as glaciers retreated. Black ash obviously possesses cues that allows it to be recognised as a preferred host by ovipositing females, but lacks defences of Manchurian ash that have been selected for by EAB (Whitehill et al. Reference Whitehill, Opiyo, Koch, Herms, Cipollini and Bonello2012).
Green and white ash decline and mortality increased to the high levels of black ash following a one to two-year time lag, suggesting that variation in susceptibility of the three species to EAB may ultimately have minimal ecological relevance for the structure and function of these forests. In 2004–2005, there were also no differences in canopy decline rating among tree diameter classes, except possibly for the smallest categories. This indicates that once mortality was moderately high (42%), trunk diameter had little effect on probability of being colonised and killed; a similar pattern has been observed by Marshall et al. (Reference Marshall, Smith and Mech2013) and Jennings et al. (Reference Jennings, Taylor and Duan2014).
Although the community structure and ash density of sampled stands were quite variable, there was no relationship between any measure of stand structure, composition, or species diversity and EAB colonisation or impact, as indicated by degree of ash canopy decline, percentage ash mortality, and percentage of infested stems. Low-density ash stands were just as susceptible to EAB colonisation and ash mortality as high-density ash stands, as also observed by Knight et al. (Reference Knight, Brown and Long2013). This suggests that non-host trees do not hinder host location efforts by EAB, as observed for some other forest insects (Jactel et al. Reference Jactel, Goulard, Menassieu and Goujon2002), possibly because EAB is highly specialised on ash with well-developed chemosensory cues for locating hosts (Crook and Mastro Reference Crook and Mastro2010), even at low densities.
The only variable that was related with any measure of EAB impact was distance from the epicentre of the invasion in Canton Township, even though all stands were located within a narrow range of 24 and 48 km from the epicentre. All measures of EAB impact (canopy rating and mortality, percentage infested ash, and density of EAB signs) were significantly and negatively correlated with distance from epicentre, with the relationship strongest for percentage ash mortality, which was significantly negatively correlated when measured in 2004–2005, 2006, and 2007. The slope of the line describing the decrease in ash mortality with distance from the epicentre remained unchanged from 2004–2006 at 2%, indicating that ash mortality continued to increase at a rate of 2%/km as overall percentage ash morality increased by 30% during that time period. By 2007, the slope flattened considerably as ash mortality climbed to high levels in all stands. All three species of ash demonstrated a similar pattern of decreasing decline and mortality with increasing distance from the epicentre with the pattern being strongest for black ash. Decreasing ash decline and mortality as distance from the epicentre increased has also been reported in southeastern Michigan studies conducted at different spatial scales than examined in this study (Smitley et al. Reference Smitley, Davis and Rebek2008; Kashian and Witter Reference Kashian and Witter2011).
The almost total extirpation of ash in these forests (Klooster et al. Reference Klooster, Herms, Knight, Herms, McCullough and Smith2014) will have a substantial impact on the future structure and function of these forests (Gandhi and Herms Reference Gandhi and Herms2010b; Gandhi et al. Reference Gandhi, Smith, Hartzler and Herms2014). Aside from ash, the most common genera in the overstorey were (Quercus) and maple (Acer), which seem poised, at least in the short-term, to increase their dominance in these stands. Relative to their abundance in the overstorey, oaks were under-represented in the understorey, perhaps due to limited recruitment and/or deer browsing (e.g., Rooney and Waller Reference Rooney and Waller2003). Thus, in the longer-term, maple and basswood (Tilia) species, which were the most common taxa in the understorey (other than ash), could become the most dominant overstorey species. Elm (Ulmus) species were also common in the understorey, but virtually lacking in the overstorey, presumably due to mortality from Dutch elm disease (Barnes Reference Barnes1976).
Barnes (Reference Barnes1976) documented the impact of the Dutch elm disease invasion on the community structure of these same forests and predicted presciently that green ash would replace American elm (Ulmus americana Linnaeus, Ulmaceae) as dominant species, unless and until a major disturbance impacts ash. Our results clearly show that all stands in our study area were highly vulnerable to invasion by EAB regardless of their structure, species composition, and ash density and importance (which ranged from low to very high). This suggests that silvicultural practices such as thinning have little potential to prevent invasion of forest stands by EAB and subsequent ash mortality. The decimation of ash is once again altering the structure and function of the forests of the Huron River Watershed of southeast Michigan, as predicted by Barnes (Reference Barnes1976), and potentially marks the beginning of the functional end of these ash species throughout North America.
Acknowledgements
This research was funded by the United States Department of Agriculture Forest Service Northeastern Research Station’s programme “Research on Biological Invasions of Northeastern Forests”, United States Department of Agriculture Forest Service Northern Research Station, the D.B. Warnell School of Forestry and Natural Resources, University of Georgia, and by state and federal funds appropriated to the Ohio Agricultural Research and Development Center and The Ohio State University. We appreciate the hard work of Diane Hartzler, Bryant Chambers, Dan Rice, Rodrigo Chorbadjian, and Alejandro Chiriboga (The Ohio State University), all of whom assisted with fieldwork. Brittany Barnes (University of Georgia) formatted the paper.


