


Introduction
Cattle dung provides habitat for a diverse community of arthropods that are represented by at least 270 species in Canada (Floate Reference Floate2011). The tunnelling, reproductive, and feeding behaviours of these species accelerate degradation of the dung, which restores nitrogen to the soil and reduces the suitability of pats as breeding sites for pest flies and parasites that affect cattle. Fragmentation also reduces the pat as a barrier to the growth of new forage from beneath the site of deposition. The economic value of these activities in North America may exceed several hundred million dollars (US$) per year (Fincher Reference Fincher1981; Anderson et al. Reference Anderson, Merritt and Loomis1984; Nichols et al. Reference Nichols, Spector, Louzada, Larsen, Amequita and Favila2008), such that changes in the geographic distributions of species that provide these ecological services are of general interest.
Dung beetles (Coleoptera: Scarabaeidae: Scarabaeinae and Aphodiinae) dominate this coprophilous community in terms of their abundance, biomass, and contribution to bioturbation (Kadiri et al. Reference Kadiri, Lumaret and Floate2014). Different species can be classified by functional group as “dwellers”, “rollers”, or “tunnellers”. Dwellers (mainly Aphodiinae) develop from egg-to-adult within the pat. Fragmentation of the pat occurs over a period of weeks via the feeding activity of the larvae. In contrast, rollers and tunnellers can bury or disperse fresh dung pats in hours or days. Adults arrive at fresh pats and remove portions of dung that they bury at some distance from (rollers) or below (tunnellers) the pat. The buried dung provides food for larvae that hatch from eggs laid in the dung at the time of burial. In addition to more rapidly removing the pat from the soil surface, rollers and tunnellers relocate nitrogen (in the form of dung) directly into the root zone of growing plants and, through their tunnelling activities, improve the permeability of the soil to water and air. Because of their greater contributions as ecosystem engineers, studies on dung beetles that are tunnellers or rollers are of particular interest.
Onthophagus nuchicornis (Linnaeus), Onthophagus taurus (Schreber), and Digitonthophagus gazella (Fabricius) are exotic species of tunnellers whose distributions continue to expand in North America (Fig. 1) (Hoebeke and Beucke Reference Hoebeke and Beucke1997; MacRae and Penn Reference MacRae and Penn2001). Onthophagus nuchicornis is a Eurasian species that became established in northeastern North America before the 1840s. First reported in western North America in British Columbia, Canada in 1945, it is now common across southern Canada and adjacent states (Floate and Gill Reference Floate and Gill1998; Tinerella and Fauske Reference Tinerella and Fauske1999; Rounds and Floate Reference Rounds and Floate2012; Floate and Kadiri Reference Floate and Kadiri2013). Onthophagus taurus is native to southern Europe, northern Africa, Turkey, and the Middle East. First recovered in North America in 1971 in Florida (Fincher and Woodruff Reference Fincher and Woodruff1975), it has rapidly expanded its distribution northward and recently was recovered near Lake City, Michigan, United States of America (Rounds and Floate Reference Rounds and Floate2012). Digitonthophagus gazella (formerly Onthophagus gazella) is a sub-Saharan species that was deliberately introduced into the United States of America in the early 1970s (Blume and Aga Reference Blume and Aga1975). It now occurs in the southern states from Florida to Arizona as far north as northwestern Mississippi (Hoebeke and Beucke Reference Hoebeke and Beucke1997) and further south into Mexico (Montes de Oca and Halffter Reference Montes de Oca and Halffter1998). Given their roles in ecosystem function, there is interest in determining the potential future North American distributions of these species.
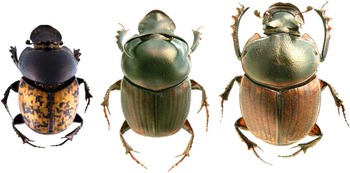
Fig. 1 Male specimens of (left to right): Onthophagus nuchicornis (6.3–8.1 mm in length), Onthophagus taurus (6.0–11.5 mm) and Digitonthophagus gazella (8.0–13 mm). Photograph credit: H. Goulet (retired, Agriculture and Agri-Food Canada, Ottawa, Ontario, Canada).
Species distribution models are commonly used to predict the future establishment of invasive species and are necessarily based on environmental factors; i.e., climate is the dominant factor that governs the distribution and population abundance of most insect species (Andrewartha and Birch Reference Andrewartha and Birch1954). These species distribution models are correlative in that they link climate data for regions where a species currently occurs to climatically similar regions where the species does not yet occur. Correlative species distribution models can be augmented with mechanistic species distribution models to improve the robustness of predictions by incorporating information on the natural history and physiological requirements of the species (Kearney and Porter Reference Kearney and Porter2009). CLIMEX® (Hearne Scientific Software, South Yarra, Australia) is a software package with aspects of both correlative and mechanistic models. Using a series of annual indices to integrate the weekly responses of a population of a species to climate, CLIMEX® models predict not only the likelihood of the establishment of a species, but also how well the species is likely to thrive at a given geographic location (Sutherst et al. Reference Sutherst, Maywald and Kriticos2007; Kriticos et al. Reference Kriticos, Maywald, Yonow, Zurcher, Herrmann and Sutherst2015).
Here we present bioclimatic models developed using CLIMEX® 3.0 (Sutherst et al. Reference Sutherst, Maywald and Kriticos2007) to predict the current and future distributions of O. nuchicornis, O. taurus, and D. gazella in North America. Results for D. gazella indicate that this species has largely reached the extent of its potential distribution in North America. Results for O. nuchicornis and O. taurus identify regions of the continent from which these species have not been reported, but with conditions predicted to be favourable for their establishment. These results indicate that the latter two species may already be present in these regions and undetected, that they have yet to expand into these regions, and (or) that factors restricting migration or dispersal prevent these species from occupying these areas. Digitonthophagus gazella and (or) O. taurus have been deliberately introduced into Australia (Edwards Reference Edwards2007), New Zealand (Environmental Protection Authority 2011), the United States of America (Lancaster and Hunter Reference Lancaster and Hunter1978; Fincher et al. Reference Fincher, Stewart and Hunter1983; Markin and Yoshioka Reference Markin and Yoshioka1998), and Brazil (Bianchin et al. Reference Bianchin, Alves and Koller1998) in efforts to establish populations to accelerate the degradation of cattle dung. The models developed in the current study for these latter two species should help facilitate redistribution programmes.
Methods
Model development
The CLIMEX® modelling process has been previously described (Olfert et al. Reference Olfert, Weiss, Woods, Philip and Dosdall2004, Reference Olfert, Weiss, Turkington, Beckie and Kriticos2012b, Reference Olfert, Weiss and Elliott2016b). In brief, CLIMEX® derives ecoclimatic indices (EIs) that describe the climatic suitability of specific locations for the reproduction and survival of a given species (Kriticos et al. Reference Kriticos, Maywald, Yonow, Zurcher, Herrmann and Sutherst2015). Our approach combined both correlative and mechanistic supportive data, using the bioclimatic information related to occurrence sites plus seasonal, demographic, and physiological data. The calculation of ecoclimatic indices integrates the weekly responses of a species to climate using a series of annual and weekly indices. An annual growth index describes the potential for population growth as a function of precipitation, temperature, and photoperiod during the growing season. Up to eight stress indices (cold, wet, hot, dry, cold-wet, cold-dry, hot-wet, hot-dry) are used to simulate population survival during inclement conditions. The weekly growth index is a function of temperature, diapause, and moisture. These indices are comprised of limiting low and high values as well as optimal low and high values. Weekly stress indices include cold stress, heat stress, wet stress, and dry stress. These indices consist of threshold values and stress accumulation values based on linear rates. The growth and stress indices are calculated weekly and then combined into an overall annual index of ecoclimatic suitability (EI), which ranges from EI=0 for locations at which the species is not able to persist to EI=100 for locations that are optimal for species survival (Kriticos et al. Reference Kriticos, Maywald, Yonow, Zurcher, Herrmann and Sutherst2015). Five categories of ecoclimatic index values were used in the current paper. These categories, and the corresponding colours used in maps, were as follows: unfavourable (0–2; white); marginal (2–10; green); suitable (10–20; blue); favourable (20–30; yellow), and very favourable (>30; red).
For model input, climate data were obtained from the CliMond 10 spatial resolution climate data set (Kriticos et al. Reference Kriticos, Webber, Leriche, Ota, Macadam, Bathols and Scott2012). The CliMond data set was developed for species bioclimatic modelling, including both correlative and process-based mechanistic models. The 10′ gridded data set included a hybrid historical data set (based on CRU CL2.0 and WorldClim; centred on 1975). We note that CLIMEX® uses air temperatures for input values, whereas our developmental data for O. nuchicornis, O. taurus, and D. gazella is based on soil temperatures (Floate et al. Reference Floate, Watson, Coghlin and Olfert2015). This discrepancy was unavoidable, given that soil temperatures are generally not available for most locations.
For model parameterisation, information was compiled on the natural history and global distribution O. nuchicornis, O. taurus, and D. gazella. Floate et al. (Reference Floate, Watson, Coghlin and Olfert2015) examined egg-to-adult development of the three species at constant temperatures of 10–32 °C (in increments of 2 °C). Their results provided values for minimum, optimum, and maximum temperature thresholds for development, degree-day requirements for egg-to-adult development, and diapause requirements. Locality information was obtained from the published literature, records deposited in the Global Biodiversity Information Facility (2016), the Iberian Scarabaeidae database (Lobo and Martín-Piera Reference Lobo and Martín-Piera1991; Base de datos sobre Scarabaeidae – www.biogeografia.org), records available online for Morocco (Lobo et al. Reference Lobo, Cabrero-Sañudo, Samper, Ruiz, Muñoz, Dellacasa and Dellacasa2016), and personal communication with scarab researchers (Supplementary Table S1).
Information obtained for North America by 31 December 2010 was then used to independently refine model parameters in a series of iterative steps to obtain models whose predictions most closely matched North American distributions and reported levels of abundance. For example, models assigned high ecoclimatic index values to regions where the species are known to be abundant.
Model validation
CLIMEX® models were validated with a threefold approach. First, they were tested for their ability to predict the known global distributions of O. nuchicornis, O. taurus, and D. gazella. Because information on localities from outside of North America was not used in model development, Europe and Australia/New Zealand (varying with species) were used as independent regions for this validation step, serving as an independent occurrence subset. Locality information available for Asia was considered insufficient for this purpose. Second, model outputs that predict patterns of seasonal phenology and the number of generations at different geographic locations were assessed against the published literature. At northern latitudes, surveys from spring (April/May) through autumn (September/October) using dung-baited pitfall traps are best suited for this purpose. At more southern latitudes, year-round operation of dung-baited traps may be most useful. Third, model predictions post-development were assessed against new collection locality information obtained after 31 December 2010. New locality information was obtained from recent publications, additional field surveys, e-mail requests to researchers and curators of insect collections, and from image searches online. Because of their distinctive morphologies, these three species are often photographed and can be reliably identified from other species of scarabs in North America (Fig. 1). The BugGuide website (http://bugguide.net) proved to be most useful in this regard.
Species co-occurrence
The output of CLIMEX® models for O. nuchicornis, O. taurus, and D. gazella was combined to compare regions of current and potential future overlap. For each species, grid cells with ecoclimatic index values ⩾10 were plotted on the same map of North America. A belt transect was then drawn through this map, extending from southern Texas (26°N) to northern Canada (60°N), and between 96°W and 98°W. The location of this transect was selected to span the distributions of the three species where they did and did not co-occur in North America north of Mexico. The ecoclimatic index values in this transect were subsequently plotted to spatially assess species overlap.
Results and discussion
Parameters used in CLIMEX® models for O. nuchicornis, O. taurus, and D. gazella are reported in Table 1. Details on model parameterisation and results of validation steps are discussed separately for each species in the following sections.
Table 1 Values for parameter settings for the CLIMEX® model projecting Digitonthophagus gazelle (Dg), Onthophagus nuchicornis (On), and Onthophagus taurus (Ot) distribution and abundance in North America.
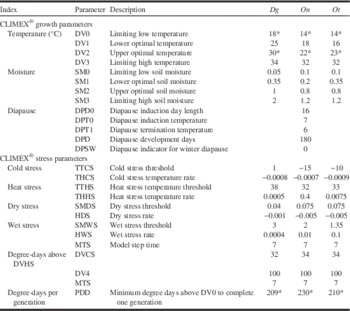
* Based on requirements reported in Floate et al. (Reference Floate, Watson, Coghlin and Olfert2015).
We note that our interpretation of these models is necessarily affected by several factors. Two of these are sampling effort and access to the data arising from this effort. To illustrate, we note the lack of collection records for O. nuchicornis from Nebraska (“suitable” for establishment) and Iowa (“favourable” for establishment) (Fig. 2). The scarab fauna of Nebraska has been extensively surveyed over many years and the results are readily available (Ratcliffe and Paulsen Reference Ratcliffe and Paulsen2008). Hence, it seems likely that the species is indeed absent in the state; at least for now (see next section). In contrast, the dung beetle fauna of Iowa has been much less extensively sampled. The main insect collection of Iowa State University has roughly 100 specimens of Onthophagus, none of which are identified to species (G. Courtney, Curator of the Iowa State Insect Collection, personal communication). In a survey limited to two counties in the northeast corner of the state, Worthington and Larsen (Reference Worthington and Larsen2010) recovered 109 scarab beetles (12 species) from dung-baited pitfall traps; none of these were O. nuchicornis. However, O. nuchicornis does occur in an adjacent county in Wisconsin (Kriska and Young Reference Kriska and Young2002) and also to the south in Missouri (MacRae and Penn Reference MacRae and Penn2001). This gives reason to suspect that O. nuchicornis is present, but undetected, in Iowa.
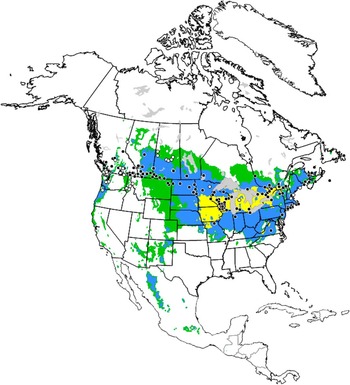
Fig. 2 Ecoclimatic index values predicting conditions for establishment of Onthophagus nuchicornis in North America; white (unfavourable, 0–2); green (marginal, 2–10); blue (suitable, 10–20); yellow (favourable, 20–30). Black circles identify localities of species occurrence used to calculate ecoclimatic index values for North America and elsewhere in the world; white circles are localities identified after model development and assess model rigour.
A third factor is the accuracy of species determination. In North America, there are no species that might be mistaken for O. nuchicornis, O. taurus, or D. gazella. In Europe, however, O. taurus frequently has been mistaken for Onthophagus illyricus (Scopoli); O. nuchicornis co-occurs and is morphologically similar to Onthophagus fracticornis (Preyssler) and Onthophagus similis (Scriba). Thus, species misidentifications have the potential to confound model validation (Ljungberg Reference Ljungberg2002).
Another factor is our use of air temperatures for model development, rather than soil temperatures (discussed in Floate et al. Reference Floate, Watson, Coghlin and Olfert2015). Immature development and overwintering of the three species typically occurs at soil depths of 10–15 cm or more, varying with soil type and soil moisture (Fincher and Hunter Reference Fincher and Hunter1989; Tyndale-Biscoe Reference Tyndale-Biscoe1990; Macagno et al. Reference Macagno, Moczek and Pizzo2016). In winter, soil temperatures are warmer than air temperatures, increasingly so with depth and snow cover. Thus, CLIMEX® models using air temperatures may underestimate the likelihood of overwintering survival, particularly at the northernmost extent of the distribution of a species. In summer, soil temperatures are cooler than air temperatures. Thus, insects developing underground accumulate fewer degree-days than might be expected based on air temperatures. Hence, use of air temperatures for CLIMEX® models may overestimate the predicted number of generations per year (Floate et al. Reference Floate, Watson, Coghlin and Olfert2015).
A further factor is the false assumption that all populations of a given species are physiologically the same. For example, Floate et al. (Reference Floate, Watson, Coghlin and Olfert2015) obtained developmental data for O. taurus from a single source population. However, results based on other populations might differ. Consider the results reported by Macagno et al. (Reference Macagno, Moczek and Pizzo2016) for populations of O. taurus from Australia, Italy, and the United States of America. When reared under identical conditions at the same time, each population displayed significant differences in the soil depth to which they buried brood balls. Similarly, Silva et al. (Reference Silva, Vilela, Buzatto, Moczek and Hortal2016) provide evidence that populations of O. taurus in eastern North America have expanded into colder and more humid regions beyond what would be expected based on observations for populations of O. taurus in western North America. Hence, for a given species, a biotype may establish in a region predicted to be unsuitable for establishment, based on model parameters obtained for a different biotype.
Onthophagus nuchicornis
Model parameterisation
Model parameters (Table 1) were selected based on developmental requirements and to match reported localities of the species in North America. Temperature parameter DV0 and degree-day requirements per generation (PDD) were set at 14 °C and 230, respectively, based on data in Floate et al. (Reference Floate, Watson, Coghlin and Olfert2015). Because their study indicated an upper optimal threshold temperature (DV2) for successful egg-to-adult development of between 22 and 24 °C, the model parameter was set at 22 °C. Because they reported that O. nuchicornis was unable to complete development at 32 °C, the limiting high temperature (DV3) was set at 32 °C. Cold stress limited distribution to the north. Floate et al. (Reference Floate, Watson, Coghlin and Olfert2015) reported O. nuchicornis to have an obligate diapause. Hence, diapause was parameterised to limit southern distributions. Soil moisture parameters were set to permit distribution over a wide range of soil moistures; e.g., the Canadian Maritime and Prairie Provinces, and the Pacific Northwest region of the United States of America.
Model output corresponds with the reported transcontinental distribution of O. nuchicornis in North America with two apparent discrepancies (Fig. 2). First, the species is common in southern British Columbia where ecoclimatic index values predict conditions to be generally “unfavourable” (EI=0–2) for establishment. However, these values correspond to high elevation sites in the Rocky Mountains. Collection localities for O. nuchicornis correspond to valleys, for which conditions are predicted to be “marginal” (EI=2–10) or “suitable” (EI=10–20; e.g., Okanagan Valley). This is not readily apparent from the map. Second, there are essentially no reports of O. nuchicornis across broad regions of the central United States of America identified by EI values as “suitable” or “favourable” (EI=20–30). This discrepancy may indicate that the model over-extrapolates the southernmost extent of the distribution of this species. Potentially, however, it may be that O. nuchicornis has yet to establish in these regions. The species has only colonised the northern Great Plains in the past 60 years and may still be expanding its distribution southward. The earliest reports for the species from Alberta, Saskatchewan, North Dakota, and South Dakota are 1961, 1977, 1981, and the 1990s, respectively (Floate and Gill Reference Floate and Gill1998; Tinerella and Fauske Reference Tinerella and Fauske1999). Thus, the distribution of the species may not have yet reached its maximum southern limits. We also cannot exclude the possibility that O. nuchicornis is present in parts of the region, but not yet detected (see previous section). We note that the report for South Dakota (Tinerella and Fauske Reference Tinerella and Fauske1999) is identified as a personal communication with no collection localities provided. For this reason, localities for O. nuchicornis in South Dakota are not indicated in Figure 2.
Model validation
The model generally is supported with: (i) reported distributions of O. nuchicornis outside of North America, (ii) published information on relative abundance and seasonality and number of generations, and (iii) new data obtained since models were completed in December 2010.
(i) Distributions outside of North America. The model output agrees with reported distributions of O. nuchicornis across continental Europe (Fig. 3), including a recent report of the species from Samsun province on the Black Sea coast in northern Turkey (Sullivan et al. Reference Sullivan, Ozman-Sullivan, Lumaret, Baxter, Zalucki and Zeybekoğlu2016). The model predicts the absence of O. nuchicornis in Portugal and Morocco, and its limited occurrence in Spain, primarily in the northern parts of the country. These predictions generally fit well with reported localities for this species in the region (see Supplementary material for Dortel et al. Reference Dortel, Thuiller, Lobo, Bohbot, Lumaret and Jay-Robert2013). The model does not correspond well with distribution records from more northern and western localities (Norway, Sweden; western United Kingdom) or for coastal regions of France and Spain. Variance with reports from Norway and Sweden reflect low temperature index values, which are based on the parameterised value for DVO (14 °C) (Floate et al. Reference Floate, Watson, Coghlin and Olfert2015). The value used for O. nuchicornis is higher than that used in previous models for species endemic to northern Europe; e.g., Peristenus digoneutis Loan (Hymenoptera: Braconidae)=13 °C (Olfert et al. Reference Olfert, Haye, Weiss, Kriticos and Kuhlmann2016a); Contarinia nasturtii (Kieffer) (Diptera: Cecidomyiidae)=10 °C (Olfert et al. Reference Olfert, Hallett, Weiss, Soroka and Goodfellow2006); Meligethes viridescens (Fabricius) (Coleoptera: Nitidulidae)=7 °C (Mason et al. Reference Mason, Olfert, Sluchinski, Weiss, Boudreault, Grossrieder and Kuhlmann2003); Sitona lineatus Linnaeus (Coleoptera: Curculionidae)=7 °C (Olfert et al. Reference Olfert, Weiss, Cárcamo and Meers2012a). Variance with predicted distributions in the United Kingdom, France, and Spain reflects a diapause index=0 for these regions, due to insufficient day lengths or cool temperatures (required to initiate and terminate diapause induction). The discrepancy of the model based on North American distributions, with reported distributions in Europe potentially may reflect differences in conditions for diapause induction and termination between populations on the two continents.
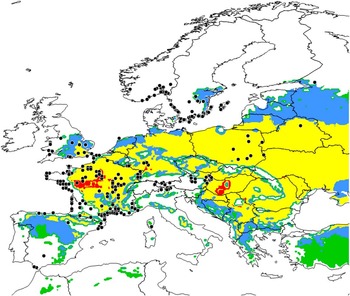
Fig. 3 Ecoclimatic index values predicting conditions for establishment of Onthophagus nuchicornis in Europe; white (unfavourable, 0–2); green (marginal, 2–10); blue (suitable, 10–20); yellow (favourable, 20–30); red (very favourable, >30). Black circles identify reported localities of occurrence and assess the rigour of ecoclimatic index predictions developed using North American localities.
We caution that historical collection localities may not reflect the current distribution of a species. For example, the northern distribution of O. nuchicornis appears to contracting in Europe. Coope (Reference Coope2000) provides evidence that the species was once common in parts of the British Isles about 120 000 years ago and concludes that the species is now likely extirpated. Records in the Global Biodiversity Information Facility (2016) identify recovery of specimens in southern United Kingdom within the past 10 years, but nothing to indicate that the species is abundant. Skidmore (Reference Skidmore1991) reports the species to have a “very local” distribution in southern United Kingdom. Information in Bistrom et al. (Reference Bistrom, Silfverberg and Rutanen1991), confirmed by T. Roslin (University of Helsinki, Finland, personal communication) indicates that O. nuchicornis was once widely scattered in southern regions of Finland, but has not been collected in the country since the 1950s and is likely extirpated. The two records of O. nuchicornis on the southern coast of Spain derive from specimens collected in 1895 (Lobo and Martín-Piera Reference Lobo and Martín-Piera1991). These distributional changes have been attributed to loss of habitat (Bistrom et al. Reference Bistrom, Silfverberg and Rutanen1991) and climate change. For example, mean July temperatures in southern United Kingdom are estimated to have cooled about 4 °C since the early Eemian interglacial period; ~130 000 to 115 000 years before present (Coope Reference Coope2000). Predicted changes of dung beetle distributions in western Europe associated with climate change are examined in detail in Dortel et al. (Reference Dortel, Thuiller, Lobo, Bohbot, Lumaret and Jay-Robert2013).
(ii) Relative abundance, seasonal activity, and number of generations. The best information on the regional abundance and activity of O. nuchicornis in North America derives from surveys in southern Alberta (Floate and Gill Reference Floate and Gill1998; Floate and Kadiri Reference Floate and Kadiri2013; Kadiri et al. Reference Kadiri, Lumaret and Floate2014) and Michigan (Rounds and Floate Reference Rounds and Floate2012). In both regions, O. nuchicornis is a dominant member of the local dung beetle community and comprises about 40% of the total trap catch. The former and latter regions are predicted to be “suitable” and “favourable” for establishment, respectively (Fig. 2). The growth index calculated for O. nuchicornis in Michigan identifies temperature and moisture conditions favourable for population growth from mid-May until mid-September (Fig. 4A), which corresponds to observed patterns of seasonal activity in both regions. Overwintered adults emerge in May to feed and lay eggs, which develop into adults that emerge in autumn. The autumn peak of adult activity occurs in August in Michigan (Rounds and Floate Reference Rounds and Floate2012), and a few weeks later (mid-August through mid-September) in Alberta (Floate and Gill Reference Floate and Gill1998; Floate and Kadiri Reference Floate and Kadiri2013). The presence of one generation per year is consistent with an obligate diapause requirement for this species.
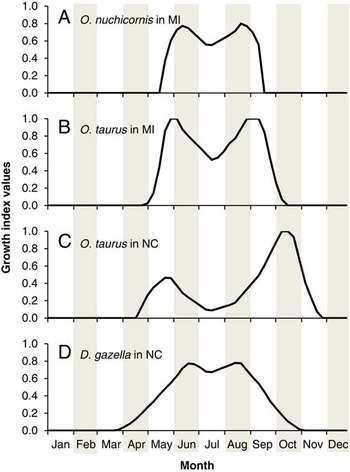
Fig. 4 Growth index models: A, Onthophagus nuchicornis (Michigan); B, Onthophagus taurus (Michigan); C, Onthophagus taurus (North Carolina); D, Digitonthophagus gazella (North Carolina). Growth index values range from 0.0 (not suited for population growth) to 1.0 (optimal for population growth). Michigan, MI; North Carolina, NC.
(iii) New data. New data confirms the presence of O. nuchicornis in predicted regions of occurrence (Fig. 2) from whence it was not previously reported. The model identifies a region along the coast extending from southern British Columbia to southern Oregon as being “suitable” for establishment. In 2013, we received a specimen collected in late March from Carlton County, Oregon. To our knowledge, this is the first report of O. nuchicornis in Oregon and extends its reported southern coastal distribution by about 180 km. The model also identifies the aspen parkland region of central Canada as “suitable” or “marginal” for establishment. We tested this prediction by operating dung-baited pitfall traps in the summers of 2012 through 2015. These traps recovered small numbers of O. nuchicornis in British Columbia near the community of Tomslake, and in Saskatchewan, near the communities of Duck Lake, Melfort, Nipawin, Peerless, St. Walburg, and Tway (Supplementary Table S1). The collection at Tomslake extends the northernmost reported distribution in North America by about 230 km. We recently became aware of a report of O. nuchicornis being released on Hawaii, United States of America where it failed to establish (Anonymous 1910). This finding is consistent with the model’s parameters of this species requiring a cold period for an obligate diapause.
Onthophagus taurus
Model parameterisation
Model parameters (Table 1) were selected based on developmental requirements reported in Floate et al. (Reference Floate, Watson, Coghlin and Olfert2015) and to match the North American distribution of the species. Temperature parameter DV0 and degree-day requirements per generation (PDD) were set at 14 °C and 210, respectively. Because an upper optimal threshold temperature of about 24 °C was indicated, DV2 was set at 23 °C. Because adult emergence declined at the highest temperature tested (32 °C), DV3 was set at 32 °C. Because this species does not have an obligate diapause, parameters to compute a diapause index were not used.
The model output corresponds with reported localities for O. taurus across North America; i.e., states in the eastern and southeastern United States of America, and in California (Hoebeke and Beucke, Reference Hoebeke and Beucke1997) (Fig. 5). Because of cold stress, the species is predicted not to establish in most of Canada with the exception of southern Ontario and Québec. These regions are identified as “suitable” (EI=10–20) or “favourable” (EI=20–30) for establishment. EI values identify southern Alberta as “marginal” or “suitable”, which reflect results reported in Floate et al. (Reference Floate, Watson, Coghlin and Olfert2015). They showed that although O. taurus could complete development and overwinter in southern Alberta, high overwintering mortality was expected to prevent population establishment. The model predicts that heat stress is likely to prevent population establishment in parts of Texas. During the growing season, low precipitation (i.e., a low moisture index) is expected to prevent populations from establishing in parts of Texas, New Mexico, Colorado, Wyoming, and Montana.
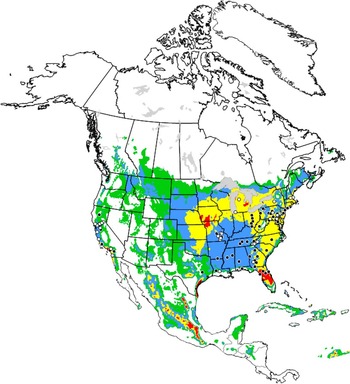
Fig. 5 Ecoclimatic index values predicting conditions for establishment of Onthophagus taurus in North America; white (unfavourable, 0–2); green (marginal, 2–10); blue (suitable, 10–20); yellow (favourable, 20–30); red (very favourable, >30). Black circles identify localities of species occurrence used to calculate ecoclimatic index values for North America and elsewhere in the world; white circles are localities identified after model development and assess model rigour.
Model validation
The model generally is supported with: (i) reported distributions of O. taurus outside of North America, (ii) published information on relative abundance and seasonality and number of generations, and (iii) new data obtained since models were completed in December 2010.
(i) Distributions outside of North America. The model output agrees with reported localities for O. taurus across western, central, and northern Europe with some exceptions (Fig. 6). One discrepancy is for southern United Kingdom, where conditions are predicted to be very favourable (EI>30) for establishment. The species has been reported in the United Kingdom, but not for more than 140 years (Skidmore Reference Skidmore1991). It seems unlikely that this distinctive species would go unnoticed for such a long period of time. We speculate that it has been locally extirpated, perhaps as a result of urbanisation and the loss of pastoral habitats. The model does not agree with reports of O. taurus from eastern Switzerland and northern Austria, where the species is not expected to establish due to excessive soil moisture (i.e., MI=0). Conditions on the east coast of Sweden are predicted to be “favourable” for establishment, but the only report of O. taurus from that country is from the Island of Gotland (Supplementary Table S1). Cold stress does not limit distribution in Europe.
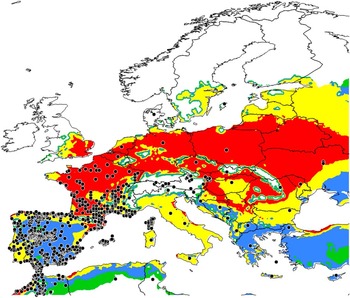
Fig. 6 Ecoclimatic index values predicting conditions for establishment of Onthophagus taurus in Europe; white (unfavourable, 0–2); green (marginal, 2–10); blue (suitable, 10–20); yellow (favourable, 20–30); red (very favourable, >30). Black circles identify reported localities of occurrence and assess the rigour of ecoclimatic index predictions developed using North American localities.
Releases of O. taurus were made in different states of Australia between 1975 and 1984 as part of a national programme to accelerate the degradation of cattle dung. The species is now established in New South Wales, South Australia, Tasmania, Western Australia, and Victoria (Tyndale-Biscoe Reference Tyndale-Biscoe1990). The model predicts favourable conditions for establishment in each of these regions (Fig. 7).
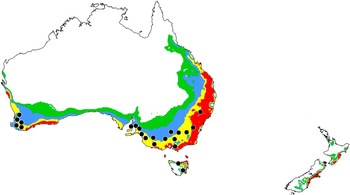
Fig. 7 Ecoclimatic index values predicting conditions for establishment of Onthophagus taurus in Australia and New Zealand; white (unfavourable, 0–2); green (marginal, 2–10); blue (suitable, 10–20); yellow (favourable, 20–30); red (very favourable, >30). Black circles identify reported localities of occurrence and assess the rigour of ecoclimatic index predictions developed using North American localities.
(ii) Relative abundance, seasonal activity, and number of generations. Surveys that provide insight into the relative abundance and seasonal activity of O. taurus in North America have been performed in Florida (Kaufman and Wood Reference Kaufman and Wood2012) and North Carolina (Bertone et al. Reference Bertone, Green, Washburn, Poore, Sorenson and Watson2005; Lastro Reference Lastro2006). In north-central Florida, conditions are predicted to be favourable or very favourable for establishment. This prediction accords well with a survey in the region that identified O. taurus to be the fifth most common of 39 species recovered (Kaufman and Wood Reference Kaufman and Wood2012). The model identifies conditions to be favourable for establishment in North Carolina, where O. taurus is common and adults are active from March until November; potentially allowing for four to five generations per year (Bertone et al. Reference Bertone, Green, Washburn, Poore, Sorenson and Watson2005). This observed period of activity corresponds with that predicted using growth index calculations, which show conditions to be favourable for population growth from April through November (Fig. 4C). Using degree-day requirements reported for O. taurus (Floate et al. Reference Floate, Watson, Coghlin and Olfert2015), model output predicts three to seven generations per year in North Carolina. However, two to three generations seems more likely. The model output reflects use of air temperatures rather than soil temperatures, which are cooler during summer months. The model also does not incorporate a period of pre-ovipositional development between generations. In southern Australia, O. taurus has a generation time of six to eight weeks during summer months and overwinters as larvae (Tyndale-Biscoe Reference Tyndale-Biscoe1990).
(iii) New data. The model predicts conditions to be favourable or very favourable for establishment of O. taurus in the United States of America for states bordering the Great Lakes (Fig. 5). Before 2011, the species was not known to the authors to occur in Michigan. A survey in 2011 detected a resident population of O. taurus in the northern lower peninsula of Michigan (Rounds and Floate Reference Rounds and Floate2012). This represents the furthest northwestern occurrence of the species in North America to date. Subsequent examination of photographs on bugguide.net identifies additional localities for O. taurus in the Great Lakes region (Supplementary Table S1). The model predicts favourable conditions for establishment in southern Ontario. We are unaware of any Canadian records for this species, but expect reports for southern Ontario to be forthcoming.
The growth index calculated for O. taurus in Michigan identifies conditions favourable for population growth from May through September (Fig. 4B). This prediction corresponds to the observed pattern of seasonal activity reported for the state by Rounds and Floate (Reference Rounds and Floate2012). Based on degree-day requirements for O. taurus (Floate et al. Reference Floate, Watson, Coghlin and Olfert2015), model output predicts two to three generations. As mentioned previously, model output is based on air temperature and does not incorporate a period for pre-ovipositional development. Hence, one generation per year seems more likely. The peak recovery of adults in August reported by Rounds and Floate (Reference Rounds and Floate2012) is therefore attributed to the emergence of the F1 generation developing from eggs laid in spring.
As part of a national programme, releases of O. taurus began in 2013 at selected sites on the North Island of New Zealand. Small numbers have since been recovered at these sites (S. Forgie, Dung Beetle Innovations, Auckland, New Zealand, personal communication), coinciding with predictions for model establishment (Fig. 7).
Digitonthophagus gazella
Model parameterisation
Model parameters (Table 1) were selected based on developmental requirements reported in Floate et al. (Reference Floate, Watson, Coghlin and Olfert2015) and to match reported localities of the species in North America. Temperature parameter DV0 and degree-day requirements per generation (PDD) were set at 18 °C and 209, respectively. Results in Floate et al. (Reference Floate, Watson, Coghlin and Olfert2015) indicated a lower optimal temperature (DV1) of between 24 °C and 26 °C; hence, DV1 was set at 25 °C. Also based on results in Floate et al. (Reference Floate, Watson, Coghlin and Olfert2015), the upper optimal threshold temperature (DV2) was set at 30 °C. The limiting high temperature (DV3) was set at 34 °C, given that adult emergence appeared to decline between 30 °C and 32 °C, and no data were available for 34 °C (Floate et al. Reference Floate, Watson, Coghlin and Olfert2015). The lower soil moisture threshold (SM0) was set very low in order to permit the species to occur in central Australia. Cold stress was used to limit distribution of the species across the northern United States of America.
Model predictions match the reported localities for D. gazella across North America, which are mainly in southeastern North America, including the Gulf Coast and Mexico (Hoebeke and Beucke Reference Hoebeke and Beucke1997) (Fig. 8). There are fewer reports for southern regions of California, Arizona, and New Mexico. In parts of Texas, heat stress is predicted to limit species distribution. During the growing season, low precipitation (low MI) is predicted to limit potential growth in Texas, New Mexico, Colorado, Wyoming, and Montana.
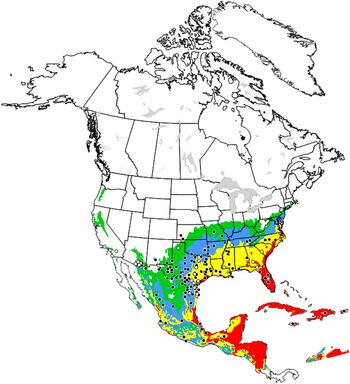
Fig. 8 Ecoclimatic index values predicting conditions for establishment of Digitonthophagus gazella in North America; white (unfavourable, 0–2); green (marginal, 2–10); blue (suitable, 10–20); yellow (favourable, 20–30); red (very favourable, >30). Black circles identify localities of species occurrence used to calculate ecoclimatic index values for North America and elsewhere in the world; white circles are localities identified after model development and assess model rigour.
Model validation
(i) Distributions outside of North America. Génier and Moretto (Reference Génier and Moretto2017) recently identified D. gazella as one of 16 species that form a species complex. They reported that the distribution of D. gazella in Africa extends from South Africa northward to Uganda, and includes Madagascar. Model predictions are consistent with this finding. Digitonthophagus gazella also has been reported from Saudi Arabia, Oman, Ethiopia, and Nigeria (Supplementary Table S1), and from localities in Asia Minor, India, and Sri Lanka (Balthasar 1963 – cited in Hoebeke and Beucke Reference Hoebeke and Beucke1997). Results of Génier and Moretto (Reference Génier and Moretto2017), however, indicate that these latter reports are likely not for D. gazella, but for other members of this species complex.
Model predictions generally coincide with reported localities for D. gazella in Australia and Hawaii. In Australia, D. gazella is well documented from coastal regions, particularly along the east coast where conditions are predicted to range from marginal to very favourable for establishment (Fig. 9). However, there are collection localities further inland in regions where D. gazella is predicted not to establish. This anomaly merits further investigation. These populations may be genetically distinct from populations elsewhere, or local conditions may permit their persistence in regions otherwise identified as unfavourable. The model also predicts conditions for establishment of D. gazella on the Hawaiian Islands as being generally favourable or very favourable (data not shown). Releases of the species were made in Hawaii in 1957 and again in 1973 (Markin and Yoshioka Reference Markin and Yoshioka1998). It is now among the most common dung beetles species on Oahu (Harris et al. Reference Harris, Onaga, Blume, Roth and Summerlin1982) and also on Maui (K.D.F., personal observation).
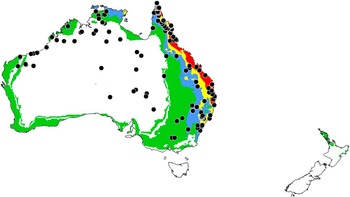
Fig. 9 Ecoclimatic index values predicting conditions for establishment of Digitonthophagus gazella in Australia and New Zealand; white (unfavourable, 0–2); green (marginal, 2–10); blue (suitable, 10–20); yellow (favourable, 20–30); red (very favourable, >30). Black circles identify reported localities of occurrence and assess the rigour of ecoclimatic index predictions developed using North American localities.
Model predictions also reflect the establishment of D. gazella in Mexico (Rivera-Cervantes and Garcia-Real Reference Rivera-Cervantes and Garcia-Real1991; Montes de Oca and Halffter Reference Montes de Oca and Halffter1998), the West Indies (Ivie and Philips Reference Ivie and Philips2008) (Fig. 8), and in numerous localities in Central and South America (Fig. 8, see summary in (Noriega et al. Reference Noriega, Horgan, Larsen and Valencia2010).
(ii) Relative abundance, seasonal activity, and number of generations. Model predictions generally coincide with the abundance of this species where such data are available (Fig. 8). Digitonthophagus gazella is a common member of the dung beetle community in the West Indies (Ivie and Philips Reference Ivie and Philips2008), southern Texas (Howden and Scholtz Reference Howden and Scholtz1986), north-central Florida (Kaufman and Wood Reference Kaufman and Wood2012), and parts of North Carolina (Bertone et al. Reference Bertone, Green, Washburn, Poore, Sorenson and Watson2005). In each of these regions, the model predicts conditions for establishment to be favourable or very favourable. Based on its short period of seasonal activity in North Carolina, Bertone et al. (Reference Bertone, Green, Washburn, Poore, Sorenson and Watson2005) concluded that establishment of D. gazella in more northerly regions along the Atlantic coast was unlikely. The model is in accordance with this expectation (Fig. 8).
An apparent exception emphasises the reliance of the model on climatic parameters that may not reflect local conditions altered by human activity. Conditions in the largely rainfall-free Coachella Valley of southeastern California region are predicted to be marginal for establishment of D. gazella (Fig. 8), but high populations have established from releases made in 1975 (Legner Reference Legner1986; Legner and Warkentin Reference Legner and Warkentin1991). This discrepancy is explained by the reliance of the region on irrigation to maintain cattle pastures. During regular 21-day cycles of irrigation, adults usually colonise dung pats within an hour of deposition. During periods outside of this irrigation regime, adults may remain dormant in the soil for up to six months until the irrigation schedule begins anew (Legner and Warkentin Reference Legner and Warkentin1991). Digitonthophagus gazella also has been reported to colonise dog faeces in urban areas (Cave Reference Cave2005). Thus, cattle need not to be present for D. gazella to establish in localised pockets where irrigation in urban or agricultural settings provides sufficient soil moisture. Irrigation also may explain the aforementioned occurrence of D. gazella at sites in the interior of Australia, where conditions are predicted to be unfavourable for establishment (Fig. 9).
Model output corresponds with periods of seasonal activity reported in field surveys. Adults are active in North Carolina from early June through late October, which potentially allows time for three to four generations per year (Bertone et al. Reference Bertone, Green, Washburn, Poore, Sorenson and Watson2005). Growth index calculations predict conditions to be favourable for population growth from April to early November (Fig. 4D). Based on degree-day requirements for D. gazella (Floate et al. Reference Floate, Watson, Coghlin and Olfert2015), model output predicts two to three generations per year.
(iii) New data. Information for North America obtained since model development reflects previous reports of D. gazella from southern regions of California, Arizona, and Texas (Fig. 8). A report from northern Texas is consistent with previous recoveries of the species from southern Kansas on the boundary of a region predicted to be marginal for species establishment. In the absence of further information, D. gazella appears to have largely reached the extent of its potential distribution in North America.
As part of a national programme, releases of D. gazella began in 2013 at selected sites in New Zealand. Small numbers have since been recovered at these sites (S. Forgie, Dung Beetle Innovations, Auckland, New Zealand, personal communication), coinciding with predictions for model establishment (Fig. 9).
In their recent paper, Génier and Davis (Reference Génier and Davis2017) questioned the taxonomy of D. gazella (and see Génier and Moretto Reference Génier and Moretto2017). They conclude that the correct name of the species that has been widely distributed should be D. dorcas (Olivier). However, to conserve the name in prevailing usage, they have asked the International Commission on Zoological Nomenclature for a ruling on the name D. gazella (Fabricius). When a case is submitted to the International Commission on Zoological Nomenclature, the name in prevailing usage is protected until a final decision is reached. Hence, we continue to refer to the species as D. gazella.
Excluding D. gazella, other members of its species complex are reported to be restricted to the Afrotropical region, the Arabian Peninsula, the eastern portion of the Saharo-Arabian region, and the continental Indomalayan region (Génier and Moretto Reference Génier and Moretto2017). However, if other species of this complex do occur beyond these limits, it may help explain discrepancies between observed distributions and our CLIMEX® model predictions. For example, the populations in the interior of Australia (Fig. 9), predicted to be unfavourable for establishment of D. gazella, may be of a different member of this complex. We note that Duncan et al. (Reference Duncan, Cassey and Blackburn2009) used localities reported for D. gazella in South Africa to model predicted distributions in Australia. If the South African localities represent a mixture of cryptic species, their findings may need to be reassessed. Studies on the morphology and molecular profiles of D. gazella in different regions will help reconcile these matters.
Species co-occurrence
Predicted regions of species co-occurrence in North America are shown in Figure 10. Results indicate that 19.1% of the continent north of Mexico has a climate rated as “suitable” or better for D. gazella. This compares with 21.3 and 27.9% for O. nuchicornis and O. taurus, respectively.
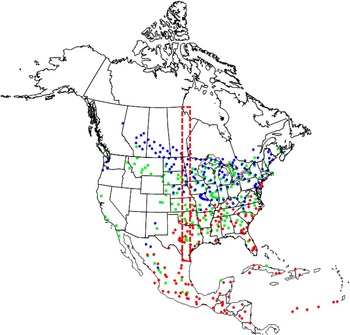
Fig. 10 Ecoclimatic index values predicting conditions for establishment for Digitonthophagus gazella (red), Onthophagus nuchicornis (blue), and Onthophagus taurus (green) (EI>9.9). The rectangle (red dashed line) delineates the area that was used for Fig. 11.
Comparisons of ecoclimatic index values for the three species within the “belt” transect are shown in Figure 11. Southern Texas is identified as the most favourable region for D. gazella, with a steady decline in ecoclimatic index values until reaching 0 at 39.9°N. Thus, the northernmost limit for D. gazella is predicted to be the Kansas/Nebraska border. Within this same transect, ecoclimatic index values identify the predicted distribution for O. nuchicornis to extend from central Kansas (38.5°N) to central Manitoba (55°N). The region of peak suitability (ecoclimatic index values of 15–20) is predicted to extend from the Kansas/Nebraska border northward to the North Dakota/Manitoba border. Ecoclimatic index values for O. taurus exhibit a bimodal peak. The first peak identifies ecoclimatic index values that exceed 25 in southern Texas (26°N) and declining close to 0 in central Texas near Dallas. The decline in ecoclimatic index values reflects a combination of suboptimal moisture and temperature values during July and August. The second peak (ecoclimatic index values >20) corresponds to the region extending from central Oklahoma northward to northern Nebraska; i.e., between 37°N and 42°N. The northernmost occurrence of O. taurus is predicted to be the southernmost extent of Manitoba; i.e., 49.1°N. These predicted regions of co-occurrence do not reflect the distribution of these species in western North America where, for example, no overlap is predicted between O. nuchicornis and D. gazella.
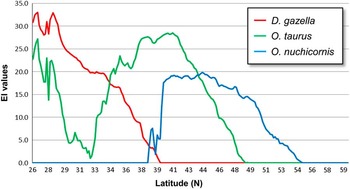
Fig. 11 Average ecoclimatic index (EI) values for Digitonthophagus gazella, Onthophagus nuchicornis, and Onthophagus taurus between 26°N and 60°N (averaged between 96°W and 98°W; see Fig. 10). Ecoclimatic index values of 10–20, 20–30, and >30, respectively, are considered to be suitable, favourable, and very favourable for establishment.
Conclusions
The CLIMEX® models presented here are consistent with the best available information for the distributions of O. nuchicornis, O. taurus, and D. gazella in North America. Results for the first two species indicate that they are likely to establish, or already have established, in regions where they are not yet reported. For O. nuchicornis, this includes the central plains of the United States of America south from North Dakota to Nebraska, and east from Nebraska to the Atlantic Coast (Fig. 2). For O. taurus, this includes the region north from Oklahoma into South Dakota, and west from Missouri into Colorado (Fig. 5). If not already present in these regions, results of the CLIMEX® models can be used to optimise the success of redistribution programmes for these species to accelerate dung degradation. Any such programmes, however, will need to assess the risk to native species of dung beetles before initiation. Digitonthophagus gazella appears to have largely reached its predicted North American distribution.
Acknowledgements
For information on collection localities in Oregon, California, and Iowa, the authors thank Anton Clifford (Bailey Nurseries, Carleton, Oregon), Larry Bezark, and Gregory Courtney. For information on collection localities outside of North America, the authors thank Giuseppe Carpaneto, Shaun Forgie, Andrey Frolov, Dennis Keith, Jason Mate, Hong Thai Pham, Thomas Roslin, and Stefano Ziani for their personal communications. Debbie Nordstrom provided assistance with generation of CLIMEX® models. The authors particularly thank Arlen Benn, Shelby Dufton, Nancy Melnychuk, and Jennifer Otani for operating dung-baited pitfall traps in British Columbia, Alberta, and Saskatchewan. They also thank the many individuals who indirectly provided collection localities either by posting photographs online (e.g., BugGuide) or by entering this information into freely accessible online databases (e.g., Global Biodiversity Information Facility, Jorge Lobo – www.biogeografia.org/biogeografia/index.php/dung-beetles). The authors thank two anonymous reviewers for their insightful comments on an earlier draft of this manuscript. This is Lethbridge Research and Development Centre publication number 38717002.
Supplementary Material
To view supplementary material for this article, please visit http://dx.doi.org/10.4039/tce.2017.20


