


Introduction
Intensive agricultural practice and heavy pesticide application in pest control programme can give rise to profound effects on genetic structure of pest populations (Thaler et al. Reference Thaler, Brandstatter, Meraner, Chabicovsky, Parson and Zelger2008). Pest control methods may accelerate emergence of biotypes due to intraspecific variation and selection pressure (Takahiro Reference Takahiro2012). Therefore, inability to distinguish different populations of insect pests would have serious consequences and may impose high cost to pest management programmes (Cifuentes et al. Reference Cifuentes, Chynoweth and Bielza2011; Mezghani et al. Reference Mezghani, Bouktila, Kharrat, Makni and Makni2012; Takahiro Reference Takahiro2012). Selection pressure may also lead to divergence in morphological, physiological, and ethological characters in any isolated population and may facilitate local adaptation (Ellers and Boggs Reference Ellers and Boggs2004; Thaler et al. Reference Thaler, Brandstatter, Meraner, Chabicovsky, Parson and Zelger2008; Fayet et al. Reference Fayet, Tobia, Hintzen and Seddon2014).
Ommatissus lybicus de Bergevin, (Hemiptera: Tropiduchidae) (commonly known as the dubas bug or date palm hopper) is a key pest on date palm (Phoenix dactylifera Linnaeus; Arecaceae) worldwide (Shah et al. Reference Shah, Mohsin, Bodlah and Hafez2012). Ommatissus lybicus is characterised by its many allopatric populations with differences in damaging behaviour, body size, and colour patterns. Furthermore, in a recent study, reproductive isolation among O. lybicus populations have also been established (Bagheri et al. Reference Bagheri, Fathipour, Askari-Seyahooei and Zeinolabedini2017). It is widely distributed in many date palm growing countries from Asia to Africa (Wilson Reference Wilson1986, Reference Wilson1988; Howard et al. Reference Howard, Giblin-Davis, Moore and Abad2001; Bagheri et al. Reference Bagheri, Fathipour, Askari-Seyahooei and Zeinolabedini2016). In addition, severe damage of O. lybicus through sucking the phloem sap and producing large quantities of honeydew have led to the extensive application of chemical insecticides throughout the date palm growing countries. However, application of different pesticides has recently proven ineffective in controlling this pest (Wilson Reference Wilson1986, Reference Wilson1988).
Management of pest resistance in agricultural ecosystem can be enhanced through understanding the genetic basis of pest adaptation and an insight in evolution, which would result in the better management of changing environments (Hawthorne Reference Hawthorne2001). Molecular markers are widely used to study the intraspecific genetic diversity. The mitochondrial DNA (mtDNA) and amplified fragment length polymorphism, have been widely used for studying genetic diversity in insects (Galtier et al. Reference Galtier, Nabholz, Glemin and Hurst2009; Wang et al. Reference Wang, Barkley and Jenkin2009).
To study genetic structure of O. lybicus populations distributed in different geographic pattern and exposed to diverse management strategies, we set a series of studies on genetic structure of O. lybicus as a unique pest with low dispersal ability and worldwide distribution. In the current study, DNA markers were used to estimate population variations. Then, the main objectives of the present study were: (i) to estimate genetic structure and genetic diversity of the O. lybicus populations by analysis of amplified fragment length polymorphism data and the COI sequences; (ii) to test the possible speciation under selection pressure by amplifying, sequencing and analysing a highly conserved gene, 28S rDNA; (iii) to provide fundamental information about population genetic structure and palm agricultural management as a new base for ecofriendly management of the insect pests.
Materials and methods
Field sampling
Samples of O. lybicus from Iran were collected from 11 zones in almost isolated locations in six different date palm growing provinces of Iran (Kerman, Hormozgan, Fars, Bushehr, Khuzestan, and Kermanshah) in two consecutive years (2012 and 2013). Four specimens from other important date-growing countries, Egypt (Cairo), Oman (Muscat), Pakistan (Panjgur), and Tunisia (Oasis de Shabikah) (see Table 1 for precise localities), were also collected in a scientific collaboration with local researchers (Table 1; Fig. 1). Some of populations (Tunisia and Fin and Ghire Karzin, Iran) were not included in amplified fragment length polymorphism assay due to unavailability of the samples at the moment of running this experiment. After collecting the insects, samples were kept in an ultra-low freezer at −80 °C to avoid DNA degradation up to the moment of running the experiments. A single insect was randomly taken for DNA extraction. DNA from the same individual was used for all experiments: amplified fragment length polymorphism, 28S rDNA, and COI studies. Voucher specimens are deposited in our laboratory at the Department of Entomology, Faculty of Agriculture, Tarbiat Modares University, Tehran, Iran.
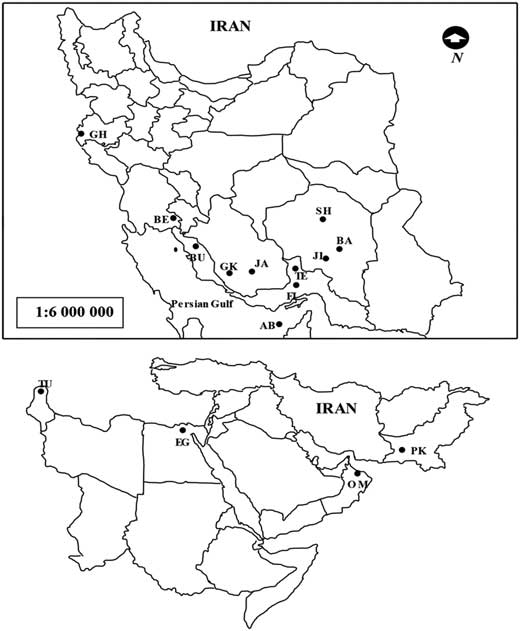
Fig. 1 Maps of Iran and the Middle East. Identification codes on the map refer to the sampling points of the Ommatissus lybicus. AB, Abu Musa (Iran); BA, Bam (Iran); BE, Behbahan (Iran); BU, Bushehr (Iran); FI, Fin (Iran); GH, Ghasre Shirin (Iran); GK, Ghire Karzin (Iran); JA, Jahrom (Iran); JI, Jiroft (Iran); SH, Shahdad (Iran); TE, Tezerj (Iran); EG, Egypt (Cairo); OM, Oman (Muscat); PK, Pakistan (Panjgur); TU, Tunisia (Oasis de Shabikah).
Table 1 Population identification code, country of origin, collection site, number of tested individuals, and global positioning system information of the Ommatissus lybicus populations involving in amplified fragment length polymorphism (AFLP) and COI assays.
DNA extraction
By using a Cetyl trimethylammonium bromide protocol for insects (Reinecke et al. Reference Reinecke, Karlovsky and Zebit1998), total genomic DNA were isolated from the samples. Quality and quantity of the DNA were estimated by NanoDrop (Nano-200; Hangzhou Allsheng Instruments, Hangzhou City, China) and confirmed by visualisation on an agarose gel (1%). The extracted DNA was stored at −20 °C until use.
Amplified fragment length polymorphism assay
Five primer combinations (Table 2) were used for selective polymerase chain reaction amplification using an ABI thermocycler (Applied Biosystems, Foster City, California, United States of America). Amplification reaction products were separated on a 6% denaturing polyacrylamide gel using a Sequi-Gen GT sequencing Cell 50 cm gel (BioRad Laboratories, Berkeley, California, United States of America). The amplified fragments were detected using silver staining method and to enhance data accuracy and minimise individual errors; the bands were scored visually by two persons resulting in the same binary patterns.
Table 2 Oligonucleotide adapters and employed primers for amplified fragment length polymorphism analysis in Ommatissus lybicus populations.
Notes: Five primer combinations generated 104 scorable bands in which almost 50% were polymorphic.
* Nucleotides in bold are the fixed extended base in the 3' end of the primers and N are the variable extension to provide different primer combination.
Amplified fragment length polymorphism products were translated to numerical data as either 1 (present) or 0 (absent) of band in a spreadsheet. Combined binary data exported from the scored bands were then used for statistical analyses. Analysis of molecular variance and estimation of F st were performed using Arlequin software version 3.5.1.2 (Excoffier and Lischer Reference Excoffier and Lischer2010).
The phylogenetic network was inferred from amplified fragment length polymorphism data using the neighbour-net method computed in Splitstree (Version 4.14.4; Huson and Bryant Reference Huson and Bryant2006) based on pairwise distances. Boostrap analysis was done using the same programme with 1000 replicates. The output file of the phylogenetic programme was visualised in Dendroscope and re-drawn using CorelDRAW version X7 (Corel, Ottawa, Ontario, Canada).
By using a web-based programme, isolation by distance web service (IBDWS) version 3.23 (Jensen et al. Reference Jensen, Bohonak and Kelley2005), the partial Mantel test was run to investigate the correlation between geographic and genetic distances. It was done only once for Iranian and all O. lybicus populations. Genetic differences of populations extracted based on Nei and Li’s index were used for principal coordinate analysis using ape package (Paradis et al. Reference Paradis, Claude and Strimmer2004) in R software. To visualise the similarities of populations, the three first coordinates were used to plot in three possible options of biplot.
Amplification and sequencing of COI
A 685 base pair fragment of cytochrome c oxidase subunit I (COI) was amplified in all populations by polymerase chain reaction assay using the primer pair LCO 1490 (5'-GGTCAACAAATCATAAAGATATTGG-3')/HCO 2198 (5'-TAAACTTCAGGGTGACCAAAAAATCA-3') (Folmer et al. Reference Folmer, Hoeh, Black and Vrijenhoek1994). Each polymerase chain reaction reaction mixture contained 12 μL of polymerase chain reaction master mix (Amplicon), 10 μL of sterile distilled water, 1 μL of each oligonucleotide primer (100 μM), and ~100 ng genomic DNA template. The polymerase chain reaction was performed in a Mastercycler Pro thermocycler (Eppendorf, Hamburg, Germany) programmed at 94 °C for two minutes, five cycles of 94 °C for 30 seconds, 45 °C for 50 seconds, 72 °C for 40 seconds followed by 35 cycles of 94 °C for 30 seconds, 51 °C for 30 seconds, 72 °C for 40 seconds, and a final extension at 72 °C for two minutes (Penton et al. Reference Penton, Hebert and Crease2004). Polymerase chain reaction products were subjected to electrophoresis on 1% agarose gel, stained with SYBR Green (SYBR safe CinnaGen, Tehran, Iran). All polymerase chain reaction products were directly sequenced by Macrogen Sequencing Service (Seoul, South Korea). The sequences were deposited in the GenBank database under accession numbers KJ796685–KJ796697 and KP861761–KP861800.
The number of individuals (n), haplotype (h), haplotype diversity (Hd, mean±standard deviation), nucleotide diversity (π, mean±standard deviation), and the number of pairwise differences (MNPD, mean±standard deviation) were computed using Arlequin version 3.5 (Excoffier and Lischer Reference Excoffier and Lischer2010). Evolutionary relationships among haplotypes were represented by constructing a haplotype network of the COI sequences based on the statistical parsimony method (Templeton et al. Reference Templeton, Crandall and Sing1992) using TCS version 1.21 (Clement et al. Reference Clement, Posada and Crandall2000).
Analysis of molecular variance was carried out using Arlequin version 3.5 (Excoffier and Lischer Reference Excoffier and Lischer2010). The significance level of F st statistics was also performed using Arlequin software by a non-parametric permutation procedure with 1023 randomisation. Nei’s standard genetic distance was computed using the same programme. Tajima’s D and Fu and Li’s D statistics were assessed for deviation from neutrality within populations using the programme DnaSP (Librado and Rozas Reference Librado and Rozas2009). Statistical calculations and graphics for F st (Weir and Cockerham Reference Weir and Cockerham1984) were conducted using R version 3.1.0 (cran.r-project.org).
The base substitution model was implemented using MrModeltest2 (Nylander Reference Nylander2004). To estimate invariant sites a general time reversible model, based on Akaike criterion was included among-site rate heterogeneity (GTR+G+I), in phylogenetic analyses. Phylogenetic relationships and the related tree were constructed using MrBayes v3.1.2 (Ronquist and Huelsenbeck Reference Ronquist and Huelsenbeck2003). After discarding burn-in (25% of the samples) samples and evaluating convergence, the remaining samples, were kept for further analysis. To determine the equilibrium distribution and estimation of the Bayesian posterior probabilities of clades the Markov chain Monte Carlo method within a Bayesian framework was run for 10 million generations (Larget and Simon Reference Larget and Simon1999) using the 50% majority rule. The Bayesian posterior probability values higher than 0.50 are presented on appropriate clades. The phylogeny was inferred and re-drawn using Dendroscope V.3.2.8 (www-ab.informatik.uni-tuebingen.de/software/dendroscope) and CorelDRAW version X7, respectively.
Amplification and sequencing of 28S rDNA
The D2 region (532 base pairs) of 28S rDNA was amplified in all populations by polymerase chain reaction using primer pair 28sF3633 (5'-TACCGTGAGGGAAAGTTGAAA-3')/28sR4076 (5'-AGACTCCTTGGTCCGTGTTT-3') (Ballman et al. Reference Ballman, Rugman-Jones, Stouthamer and Hoddle2011). Each polymerase chain reaction reaction mixture contained 12 μL of PCR master mix (Amplicon), 10 μL of sterile distilled water, 1 μL of each oligonucleotide primer (100 μM), and ~100 ng genomic DNA template. The polymerase chain reaction was performed in an Eppendorf Mastercycler Pro thermocycler programmed at 94 °C for two minutes, followed by 38 cycles of 94 °C for 30 seconds, 58 °C for 50 seconds, 72 °C for 90 seconds, and a final extension for 10 minutes at 72 °C. Cleaning and sequencing of amplified 28S rDNA fragments was accomplished using the same procedure as discussed above for COI. The sequences were deposited in the GenBank database under accession numbers KP822931–KP822941 and KJ796683–KJ796684. All sequences of COI and 28S rDNA were edited using SeqMan software (DNAStar, Madison, Wisconsin, United States of America) and aligned with Clustal X version 2.1 (Larkin et al. Reference Larkin, Blackshields, Brown, Chenna, McGettigan and McWilliam2007). The sequence data were deposited in GenBank (www.ncbi.nlm.nih.gov/genbank).
Results
Amplified fragment length polymorphism analysis
Five primer combinations generated 104 scorable bands of which nearly 50% were polymorphic among or within the populations. Most of the observed variation resided among (94.12%, P<0.001) and some within (5.88%, P<0.001) populations (Table 3). The phylogenetic network inferred from amplified fragment length polymorphism data clustered the studied populations into four distinct clades (Fig. 2). In the present network, the Bam, Bushehr, and Abu Musa populations resided in one clade in which Bam and Bushehr had a high genetic distance with Abu Musa. Behbahan and Pakistan populations bunched in one clade. Each of Jiroft and Egypt populations occupied a separate clade. The remaining populations (Tezerj, Jahrom, Oman, Shahdad, and Ghasre Shirin) placed in one group and formed a major clade (Fig. 2).
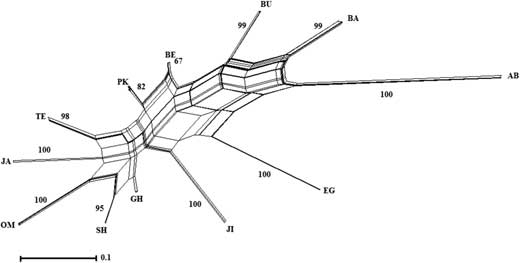
Fig. 2 Phylogenetic network inferred from the amplified fragment length polymorphism data using the neighbour-net algorithm and pairwise distances. The studied populations were grouped into four distinct clades. Bam, Bushehr, and Abu Musa populations resided in one clade. Behbahan and Pakistan populations bunched in another clade. With the exception of Jiroft and Egypt, the remaining populations (Tezerj, Jahrom, Oman, Shahdad, and Ghasre Shirin) resided in one group. Numbers along branches are bootstrap support values based on 1000 replicates. Identification codes on the phylogenetic network refer to the sampling points of the populations (see Fig. 1; Table 1).
Table 3 Analysis of molecular variance for 12 populations of Ommatissus lybicus collected from Egypt, Iran, Oman, Pakistan, and Tunisia.
Notes: The most variation was observed among populations (94.12% and 65.08% for amplified fragment length polymorphism (AFLP) and COI, respectively).
P=0.00±0.00.
First three coordinates of the principal coordinate analysis explained more than 62.86% of the variation among or within populations. In plotting, the first two coordinates explained 48.57% of band variation and the first and third coordinates explained 43.57% of band variation. Abu Musa was found apart from all other populations (Fig. 3A–B). In first and third biplot options of these three coordinates, i.e., 1 versus 2 and 2 versus 3 (Fig. 3A, C), the Egypt and Jiroft populations were found relatively close and apart from the other populations. In all three coordinate biplots, the Pakistan population situated in the middle surrounded by the Iranian populations and apart from the Egypt population. The Oman population always settled very close to populations from southern Iran. A partial Mantel test (Mantel Reference Mantel1967) showed no correlation between genetic and geographic distances neither for the Iranian O. lybicus populations (r=−0.2455, P=0.912) nor for all the O. lybicus populations (r=0.164, P=0.678). The same results were found for correlation between genetic distance and altitude (only Iranian populations: r=0.1615, P=0.811; all the O. lybicus populations: r=0.0784, P=0.672).
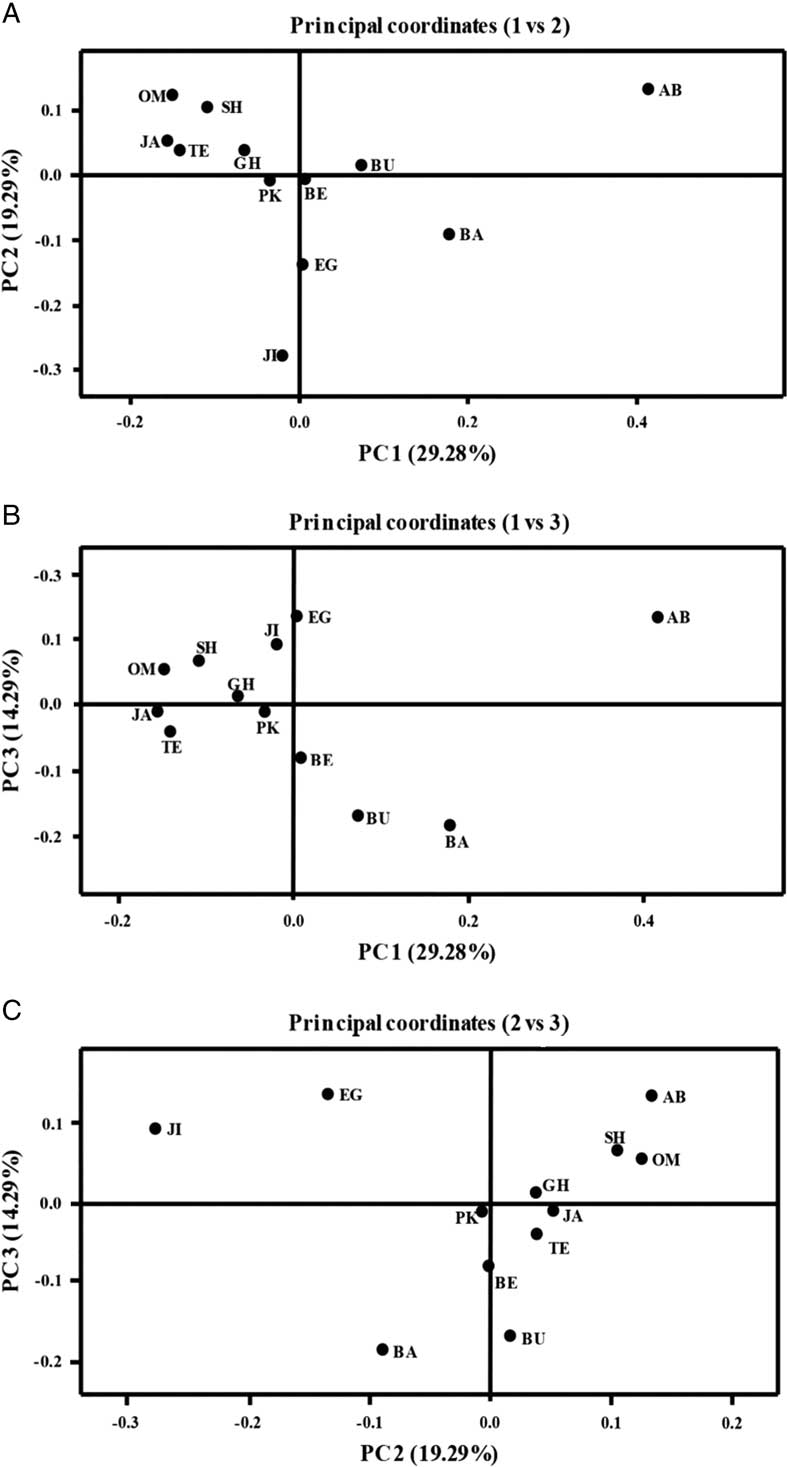
Fig. 3 Separation of populations by the first three coordinates in principal coordinates analysis. The first three coordinates explained 62.86% of amplified fragment length polymorphism variations among 12 populations of Ommatissus lybicus collected from the different provinces of Iran and some other date palm growing countries (see Fig. 1). In 1 versus 2 and 2 versus 3 options (A, C), Egypt and Jiroft populations were found relatively close and separate from the other populations. Abu Musa was found apart from all other populations (A, B). In each biplot, Pakistan population is located near the Iran populations.
COI
An ~660 base pair fragment of the COI gene was amplified by polymerase chain reaction assay using the primer pair, LCO 1490/HCO 2198 in 53 O. lybicus individuals from Iran and the other date palm growing countries. The final alignment of the amplified mtDNA COI gene region, defined a 573 base pair fragment in these O. lybicus individuals. Thirteen different haplotypes were identified for the individuals sequenced by patterns of single nucleotide polymorphism. The haplotypes contained 25 polymorphic nucleotide sites from a total of 573 (4.56 of total sites) (nucleotide diversity 0.0112±0.01). The final alignment of the COI sequences was comprised of 25 polymorphic nucleotides, of which 18 were parsimony informative sites. The proportion of the various haplotypes resulted in a high Hd of 0.702±0.00413 while nucleotide diversity (π) was generally low.
A comparison of the genetic data for the 15 geographic populations showed significant difference among the populations (P<0.01). Analysis of molecular variance was performed to study the variation within and among populations. The analysis of molecular variance of populations showed significant genetic structure. The main genetic variation (65.08, P<0.01) was observed among the populations and the lower genetic variation (34.92, P<0.01) was found within populations (Table 3). F st values calculated on the basis of the COI alignment showed that the Tezerj, Fin, Jahrom, and Egypt populations differed significantly from the other populations (Fig. 4).
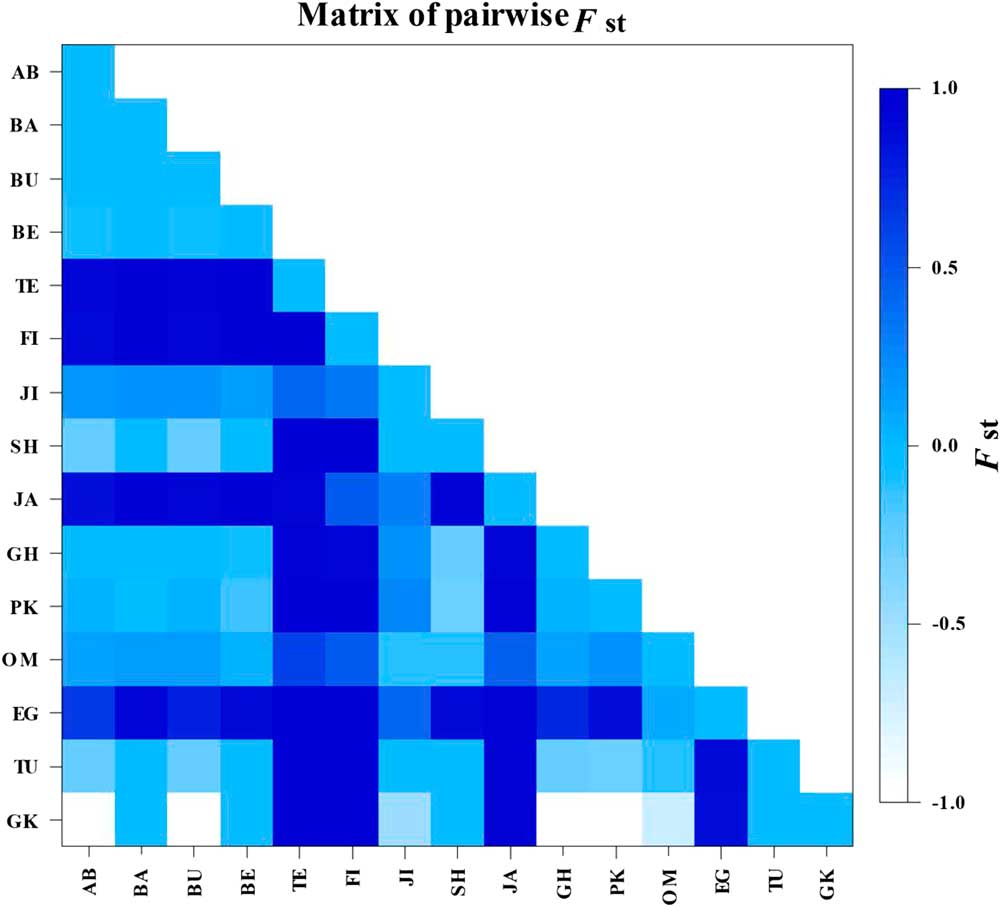
Fig. 4 Population pairwise F st of comparison of the 15 geographical populations based on a COI gene. F st values calculated on the basis of the COI alignment showed that the Tezerj, Fin, Jahrom, and Egypt populations differed significantly from the other populations and showed the most between-population variations. AB, Abu Musa (Iran); BA, Bam (Iran); BU, Bushehr (Iran); BE, Behbahan (Iran); TE, Tezerj (Iran); FI, Fin (Iran); JI, Jiroft (Iran); SH, Shahdad (Iran); JA, Jahrom (Iran); GH, Ghasre Shirin (Iran); PK, Pakistan (Panjgur); OM, Oman (Muscat); EG, Egypt (Cairo); TU, Tunisia (Oasis de Shabikah); GK, Ghire Karzin (Iran).
Based on pairwise genetic differences, the Tezerj, Fin, and Jahrom populations exhibited the most between-population variations in which these populations significantly differed from the other populations (see Figs. 4–5). The Oman and Jiroft populations revealed the most within-population variations (Fig. 5).
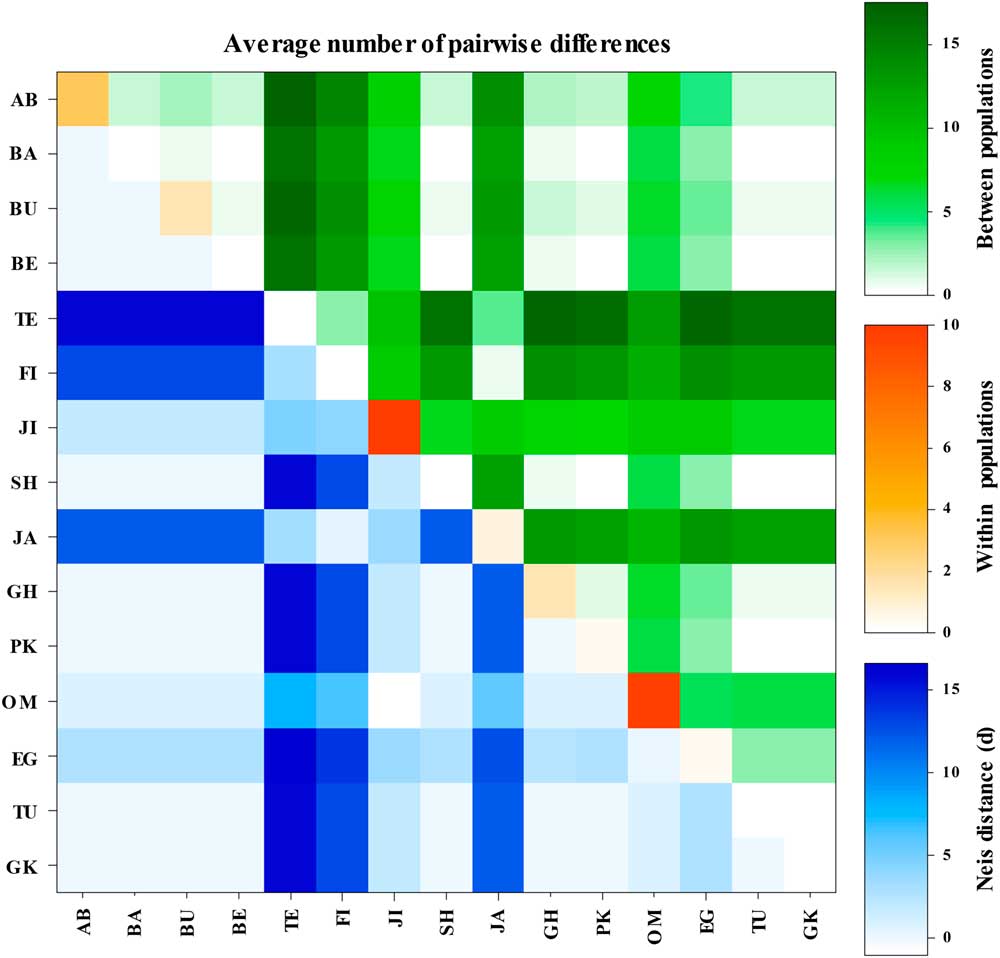
Fig. 5 Average number of pairwise differences and Nei’s distance within and among the 15 Ommatissus lybicus populations obtained from COI gene sequences. As we can see the Oman and Jiroft populations have the most within-population variation while the Tezerj, Fin, and Jahrom populations exhibit the most between-population variations. AB, Abu Musa (Iran); BA, Bam (Iran); BU, Bushehr (Iran); BE, Behbahan (Iran); TE, Tezerj (Iran); FI, Fin (Iran); JI, Jiroft (Iran); SH, Shahdad (Iran); JA, Jahrom (Iran); GH, Ghasre Shirin (Iran); PK, Pakistan (Panjgur); OM, Oman (Muscat); EG, Egypt (Cairo); TU, Tunisia (Oasis de Shabikah); GK, Ghire Karzin (Iran).
The results of Tajima’s D and Fu’s test for the total samples were not statistically significant (Tajima’s D=0.39245, P>0.1; Fu and Li’s D=−0.66287, P>0.1; Fu and Li’s F=−0.34275, P>0.1).
The partial COI sequences of the 15 O. lybicus populations and an outgroup sequence from GenBank (KF298417) were used in the phylogenetic analyses. In addition, 28 sequences from GenBank were included in the phylogenetic analyses. All the sequences from Bam, Abu Musa, Ghasre Shirin, Ghire Karzin, Bushehr, Shahdad, Behbahan, Tunisia, and Pakistan populations are grouped in the clade A. Besides the mentioned populations, three sequences from Jiroft population (KP861786, KP861788, KP861785) and one sequence from Oman population (KP861790) were also grouped in this clade. The genetic relationship of these populations was supported by low Bayesian posterior probabilities (0.59), but the exact relationships are not completely resolved yet, because of a polytomy (Fig. 6).
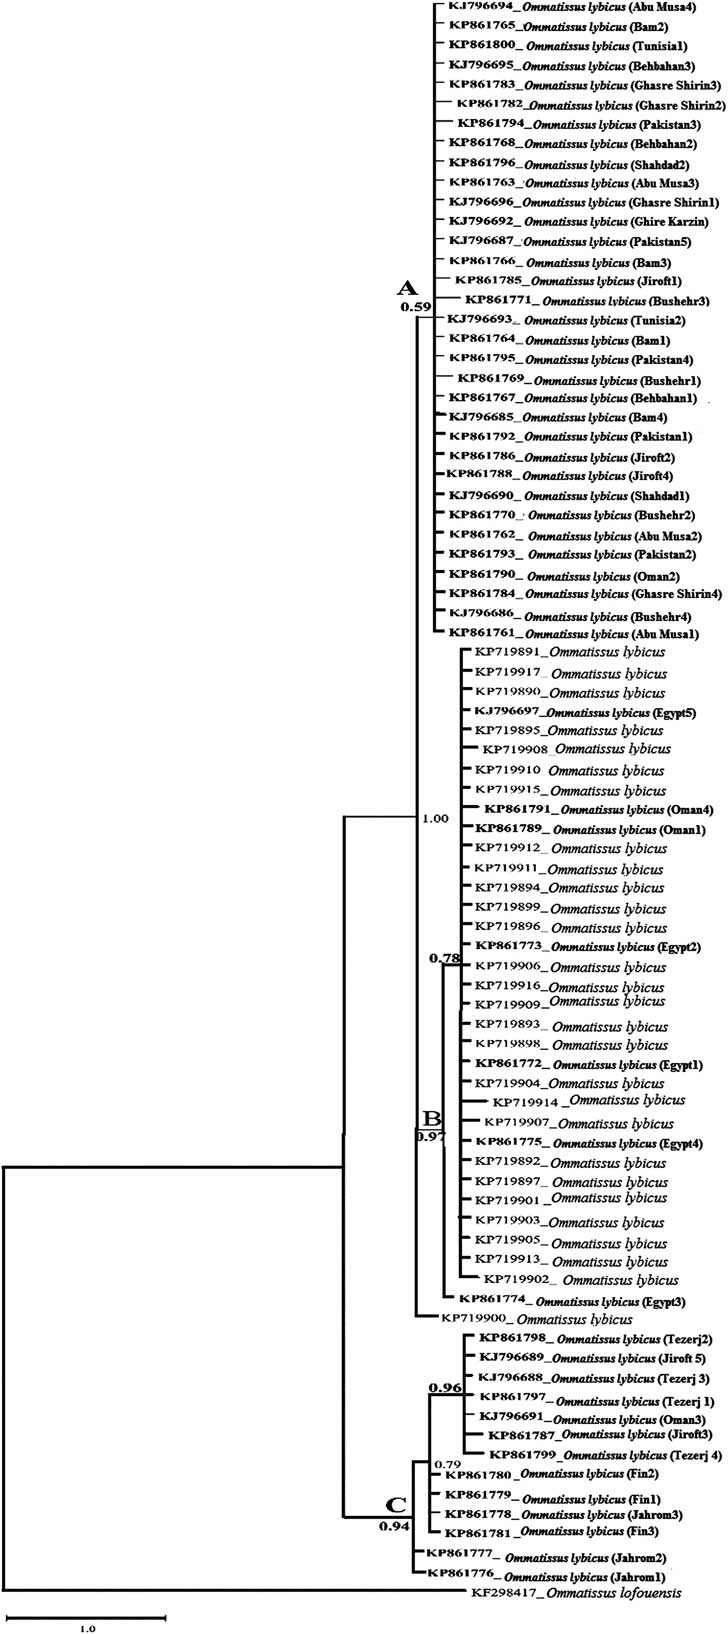
Fig. 6 The 50% majority rule consensus tree inferred from Bayesian analysis of 81 cytochrome oxidase I under the GTR+G+I model. The phylogenetic tree reveals that nine populations clustered in clade A with low Bayesian posterior probabilities (0.59), including Bam, Abu Musa, Ghasre Shirin, Ghire Karzin, Bushehr, Shahdad, Behbahan, Tunisia, and Pakistan, along with three sequences from Jiroft and one sequence from Oman. Clade B includes 27 sequences from GenBank, five sequences from Egypt, and two sequences from Oman with high Bayesian posterior probabilities (0.97). Clade C has 4, 3, 3, 2, and 1 sequences from Tezerj, Fin, Jahrom, Jiroft, and Oman, respectively, and is monophyletic (0.94). Bayesian posterior probabilities values are given for appropriate clade. The newly sequenced individuals are indicated in bold.
Clade B included 27 sequences from GenBank, five sequences from Egypt (KJ796697, KP861774, KP861772, KP861775, KP861775), and two from Oman population (KP861789, KP861791), forming a clade with high Bayesian posterior probabilities (0.97) (Fig. 6). A sequence from GenBank (KP719900) formed a well-supported monophyletic group (1.0) with clade B, showing close relation of this isolate with members of clade B. However, this sequence has not been yet included in the clade B, indicating it can be an independent population with high genetic divergence (Fig. 6).
Monophyly of clade C included 4, 3, 3, 2, and 1 sequences from Tezerj, Fin, Jahrom, Jiroft, and Oman populations, respectively, was fully supported in Bayesian posterior probabilities (0.94) (Fig. 6).
Thirteen haplotypes (including HT1–HT13) with 25 polymorphic sites were observed in the 15 O. lybicus populations. The haplotypes HT1, HT3, HT7, and HT9 were common haplotypes found in more than one population. HT1 was the dominant haplotype comprising 53% of all sequences, and shared by 11 populations. HT7 was shared by the Tezerj, Jiroft, and Oman populations. The HT3 and HT9 haplotypes were each shared by two populations. The samples from Oman and Jiroft showed the most diversity with four haplotypes and the highest nucleotide diversity, while the, Bushehr population exhibited three haplotypes and high nucleotide diversity (Table 4).
Table 4 Distribution and frequency of 13 mitochondrial haplotypes (HT1–HT13) with 25 polymorphic sites in different populations of Ommatissus lybicus.
Note: See Table 1 for the details of the sampled localities.
The relationship among mitochondrial haplotypes was revealed by constructing a haplotype network (Fig. 7). This haplotype network illustrated a main haplotype (HT1) from which all other haplotypes diverged. The dominant haplotype, HT1, occupied a central position in the network, with most of the remaining haplotypes being differentiated by one to five mutations.
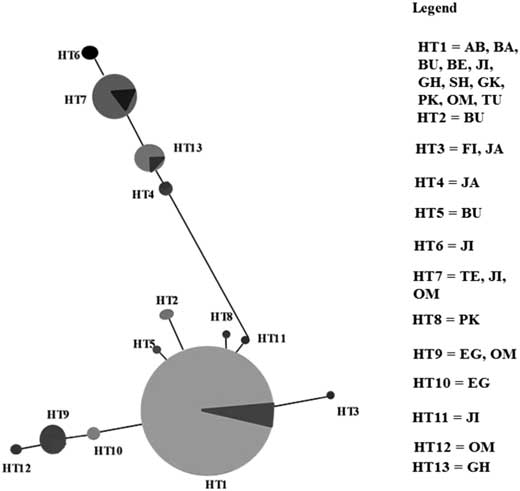
Fig. 7 Haplotype network of the 13 haplotypes in Ommatissus lybicus populations. The haplotype network shows a main haplotype (HT1), occupied a central position in the network in which the remaining haplotypes have differentiated by one to five mutations. AB, Abu Musa (Iran); BA, Bam (Iran); BU, Bushehr (Iran); BE, Behbahan (Iran); JI, Jiroft (Iran); GH, Ghasre Shirin (Iran); SH, Shahdad (Iran); GK, Ghire Karzin (Iran); PK, Pakistan (Panjgur); OM, Oman (Muscat); TU, Tunisia (Oasis de Shabikah); FI, Fin (Iran); JA, Jahrom (Iran); TE, Tezerj (Iran); EG, Egypt (Cairo).
28S rDNA
An approximately 530 base pair fragment of the D2 region of 28S rDNA was successfully amplified, sequenced, and analysed. The partial sequences of 28S rDNA in all O. lybicus populations were identical.
Discussion
Amplified fragment length polymorphism study
Results of amplified fragment length polymorphism data unveiled high genetic diversity among the studied populations of O. lybicus. Phylogenetic network inferred from amplified fragment length polymorphism data grouped the populations in four distinct clades. Interestingly, geographically close populations such as Bam, Bushehr, and Tezerj placed in separate clades. Genetical separation of Bam and Tezerj populations has been corroborated by demographic parameter and reproductive isolation studies in which these two populations were disparate in several key life history traits and number of F1 offspring in crossing experiments (Bagheri et al. Reference Bagheri, Fathipour, Askari-Seyahooei and Zeinolabedini2016, Reference Bagheri, Fathipour, Askari-Seyahooei and Zeinolabedini2017). However, the other geographically distant populations such as Oman, Pakistan, Egypt, and some Iranian populations resided in genetically close clades. These results confirm outcome of Mantel test in which there was no correlation between genetic and the elevation as well as genetic and geographic distances. However, this separation may be related to the other factors like intensive pest management practices, which can create high inter-population variation (Bonin et al. Reference Bonin, Paris, Tetreau, David and Despres2009; Piiroinen et al. Reference Piiroinen, Lindstrom, Lyytinen, Mappes, Chen, Izzo and Grapputo2013). Low intra-population and high inter-population variation is a genetic criterion that can explain diversification and fast evolution of the populations under selection pressure (Berteaux et al. Reference Berteaux, Reale, McAdam and Boutin2004) because a high selection pressure driven by intensive agricultural practices in an agroecosystem, especially frequent application of chemical pesticides, can result in local adaptation and formation of genetically diverged populations with low intra-population and relatively high inter-population variation.
Lack of long distance flight ability of O. lybicus (Shah et al. Reference Shah, Mohsin, Bodlah and Hafez2012) may intensify the fast evolution process and formation of diverged populations undergoing intensive pesticides application. Prior studies have noted the effect of insecticides application and pest migration behaviour on genetic differentiation (Timmermans et al. Reference Timmermans, Ellers, Marien, Verhoef, Ferwerda and Van Straalen2005; Kavar et al. Reference Kavar, Pavlovcic, Susnik, Meglic and Virant-Doberlet2006). Analysis of COI data also supported the amplified fragment length polymorphism pattern by demonstrating lack of genetic relevance among Bam, Tezerj, Jahrom, and Abu Musa, as populations with close geographic distance, in which Bam and Tezerj with completely different haplotypes bunched in two distinct clades.
Both principal coordinate analysis and phylogenetic results inferred from the analysis of amplified fragment length polymorphism data depicted a close relation between Pakistan, Oman, and Egypt with some of Iranian populations (Jahrom, Jiroft, Shahdad, Tezerj, and Ghasre Shirin). This may stem from similarities in management practices and other driving factors. Local adaptation and genetic diversification under selection pressure has been demonstrated for insect populations in a recent study (Hoffmann and Sgro Reference Hoffmann and Sgro2011).
COI and 28S rDNA study
A total of 13 haplotypes were found among the 15 populations with various distribution pattern and frequency occurring in different collection sites. These haplotypes were connected to a single haplotype network indicating a phylogenetic relationship existed among all 13 haplotypes. With the exceptions of the Oman, Jiroft, and Bushehr populations having four, four, and three haplotypes, respectively (Table 4), in all the other populations only one or two haplotypes were found. In addition, the within-population variation was considerably low in these populations (Figs. 4–5). The low number of haplotypes and low within-population variation can imply a high selection pressure under intensive chemical control of the pest, which resulted in elimination of susceptible haplotypes. For example, the Tezerj and Bam districts are the two major date palm cultivation with high economical values, which encourage the farmers to apply an intensive chemical control against O. lybicus. As a consequence, populations from these two areas revealed the lowest number of haplotypes (one haplotype per site) and very low diversity, which may reflect an intensive selection pressure. Similar results were observed for the other populations with low genetic diversity where field data assessment corroborated excessive application of pesticides. Negative effect of selection pressures such as intensive chemical control of a pest on the number of haplotypes has been documented frequently in previous studies (Brown et al. Reference Brown, Hosken, Balloux, Bickley, Le Page and Owen2009; Chang et al. Reference Chang, Zhong, Lo, Fang, Bonizzoni and Wang2016). Furthermore, Tajima and Fu and Li’s test statistics showed there was no neutral model of constant population size, which is in line with the above data. Both Tajima’s and Fu and Li’s values were insignificant, indicating that the populations experience serious bottleneck or may undergoing adaptation.
The phylogenetic tree inferred from COI sequences grouped the populations into three distinct clades, in which the Tezerj, Fin, and Jahrom populations grouped in a divergent clade from the other Iranian populations. None of the individuals from these populations (Tezerj, Fin, Jahrom, and Egypt) had the HT1 haplotype, which may be a sign of rapid evolution resulting from excessive insecticide application. These selection pressures may result in reducing the genetic diversity and exert bottleneck effects on local populations. The other populations, including Abu Musa, Bam, Bushehr, Behbahan, Shahdad, Ghasre Shirin, Pakistan, Tunisia, and Ghire Karzin, were grouped in another clade. All the other remaining populations grouped in the final clade shared the HT1 haplotype. Iranian populations (except Tezerj, Fin, and Jahrom) shared a common haplotype (HT1) with the Pakistan, Oman, and Tunisia populations indicating the occurrence of a common founding ancestor in these countries. Based on historical evidence, date palm cultivation and propagation originated in Mesopotamia (Iraq) (Zaid Reference Zaid2002), and has subsequently spread from there to all other date palm growing countries. It is likely, therefore, that O. lybicus has been introduced to these new areas through relocation of the infested date palms suckers (Howard et al. Reference Howard, Giblin-Davis, Moore and Abad2001). We assume that O. lybicus was initially introduced to Iran and then spread to the Pakistan and Oman by transport of infested plant material. These introductions are also reflected by the shared common haplotype found in most Iranian populations from west to east (except the Tezerj, Fin, and Jahrom populations). In addition, the Pakistan population shares the same haplotype with the Iranian populations, which is an evidence of the direction of O. lybicus introduction through Iraq to Iran and then into Pakistan. Analysis of 28 COI sequences retrieved from GenBank allied these sequences besides our sequences having HT1 haplotype and confirmed that our sampling has been comprehensive enough.
As we expected, the amplified fragment length polymorphism and COI phylogenetic trees did not completely overlap due to the modality of the studied markers. Amplified fragment length polymorphism markers cover genomic DNA (coding and non-coding genomic region) while COI results derived from a single mitochondrial gene sequences. No evidence of a Wolbachia Hertig and Burt (Rickettsiales) infection pattern or sex bias migration were found in populations to explain the difference between amplified fragment length polymorphism and COI.
All of the populations had identical 28S rDNA (D2 region) fragments, which is to be expected for this highly conserved gene region.
Conclusion
In conclusion, the genetic structure studies revealed a considerable variation among the O. lybicus populations, which is a sign of quick divergence of the populations in this pest. In comparing the pattern of molecular studies with the published biological data retrieved from demographic parameters trials, both data supported each other and depicted a similar pattern specially where the differences of the population has been highlighted. From the above findings it is understandable that the O. lybicus has been selected under different pest management strategies and diverged in different traits. As a consequence, divergence of the populations has been reflected in both genetic and natural history studies. We can conclude that pest management strategies may contribute in divergence and probably speciation in close future for pest species under intensive pest management.
Acknowledgements
In collecting O. lybicus specimens from different countries authors have been supported by many researchers; therefore, the authors would like to express their sincere gratitude to Mamoon Al-Alawi from Oman; Arif Shah Kakar from Pakistan; Ahmad El- Heneidy from Egypt; Monia BenHalima from Tunisia; and Parviz Torabi, Somayieh Salehi, Mohammad Taghi Fasihi, Nahid Lashkari, Akram Pezhman, Fariba Kamyab, Valliollah Saed, and Arezoo Payandeh from Iran. They would also like to thank Dr. Ehsan Rakhshani from Zabol University for help communicating with colleagues in other date palm growing countries. The authors would like to thank Dr. Majeed Pedram and Dr. Mohammad Mehdi Faghihi for their technical assistance and Dr. Cecil L. Smith for kindness in helping to edit the manuscript. The financial and technical support of this research by Tarbiat Modares University is greatly appreciated.


