


Introduction
Understanding the role of generalist predators in suppressing pest populations is a complex undertaking. Predators are influenced by the presence of multiple prey items as well as by both intraspecific and interspecific competition. A rapidly expanding research area in food web analysis is the use of molecular methods to detect prey items and the growing availability of primers for the detection of DNA from different prey species (Symondson Reference Symondson2012) enables more complex studies of field predation. These methods have been applied to a variety of crop production systems such as cereals (Symondson Reference Symondson2012), potatoes (Greenstone et al. Reference Greenstone, Szendrei, Payton, Rowley, Coudron and Weber2010), and orchards (Boreau de Roincé et al. Reference Boreau de Roincé, Lavigne, Richard, Franck, Bouvier and Garcin2012). Recently primers to study predation of pest insects in Brassica Linnaeus (Brassicaceae) field crops have also been developed (Ma et al. Reference Ma, Li, Keller, Schmidt and Feng2005; Cassel-Lundhagen et al. Reference Cassel-Lundhagen, Öberg, Högfeldt and Ekbom2009; Hosseini et al. Reference Hosseini, Keller, Schmidt and Dong-Mei2011; Juen et al. Reference Juen, Hogendoorn, Ma, Schmidt and Keller2012).
In an earlier study we screened two spider groups, common in oilseed rape (OSR), for DNA of the major pest in this crop, pollen beetles Meligethes Stephens (Coleoptera: Nitidulidae) species (Öberg et al. Reference Öberg, Cassel-Lundhagen and Ekbom2011). We found that in total 13.8% of the collected Pardosa tested positive for pollen beetle DNA in the polymerase chain reaction (PCR) analyses, whereas 51.7% of the collected Phylloneta impressa Koch (Araneae: Theridiidae) were positive. The likelihood of detecting pollen beetle DNA in the gut contents of both spider groups was positively related to pollen beetle larval density. Flea beetles of the genus Phyllotreta were numerous in our samples of alternative prey. We therefore wished to know if the two spider groups we studied also ate flea beetles and if this was a common occurrence. The Phyllotreta flea beetles are very common pests both in OSR (Dosdall and Mason Reference Dosdall and Mason2010) and in vegetable brassicas (Toshova et al. Reference Toshova, Csonka, Subchev and Tóth2009). They are attacked by parasitoids, but the action of predators against the flea beetles is virtually unknown (Ekbom Reference Ekbom2010). Whereas both pollen beetle larvae and adults are accessible to above ground predators, flea beetle larvae live on the roots of plants and are not available to predators on the ground or in the foliage (Dosdall and Mason Reference Dosdall and Mason2010; Ekbom Reference Ekbom2010). Flea beetle adults, however, are sometime found in high numbers both on the ground and on plants and could be eaten by above-ground predators.
The objectives of this study were:
-
(1) To develop group-specific primers for an important pest of Brassica field crops, flea beetles of the genus Phyllotreta.
-
(2) To gain insight into the predation behaviour of two common spider groups in OSR. We test the interaction between predation of flea beetles and another important pest, pollen beetles. The possible influence of activity density among conspecific predators is also explored.
Materials and methods
Design of group-specific Phyllotreta primers
Five species of Phyllotreta beetles (P. atra (Fabricius), P. undulata (Kutschera), P. striolata (Fabricius), P. tetrastigma (Comolli), and P. vittula (Redtenbacher)) were collected in OSR fields in Uppland, Sweden. To obtain sequences for the primer design, DNA was extracted from whole single specimens using the DNeasy Blood and Tissue Kit (Qiagen Inc., Solna, Sweden) following the manufacturers’ instructions. The final elution step was done with 100 μL elution buffer and the concentration of each extract was checked with a NanoDrop (Thermo Scientific, Stockholm, Sweden). One beetle yielded between 15 and 50 ng/μL. The universal primers LCO-1490 and HCO-2198 (Folmer et al. Reference Folmer, Black, Hoeh, Lutz and Vrijenhoek1994) were used to amplify a part of the mitochondrial cytochrome oxidase subunit I (COI) gene. Each PCR (25 μL) contained 0.2 mM of each dNTP, 1 μM of each primer, 3 mM MgCl2, 0.75 U HotStar Taq DNA Polymerase (Qiagen Inc.), 2.5 μL of the manufacturer’s buffer and 3 μL of DNA. Amplification conditions were: initial denaturation at 95 °C for 15 minutes followed by 35 cycles of 94 °C for 15 seconds, 50 °C for 15 seconds, 72 °C for 45 seconds and a final extension at 72 °C for 5 minutes. In each run, two samples of double distilled water were used as negative controls. All amplifications were performed in a MiniOpticon thermal cycler (Bio-Rad, Sundbyberg, Sweden).
The PCR products were run on a 2% agarose gels stained with GelRedTM Nucleic Acid Gel Stain (Bionuclear, Scandinavia AB, Stockholm, Sweden) and visualised under ultraviolet light. Successful amplifications were purified using QIAquick PCR Purification Kit (Qiagen Inc.) according to the manufacturers’ instructions and sequenced at a core facility at Uppsala Genome Center, Sweden (http://www.igp.uu.se/Serviceverksamhet/Genomcenter/). Obtained sequences were checked and corrected manually using BioEdit Sequence Aligment Editor version 7.0.5.3 (Hall Reference Hall1999).
Along with the Phyllotreta specimens, we amplified and sequenced the COI region from nontarget species commonly found in arable ecosystems. We also screened the public database GenBank for additional COI sequences representing “agricultural” arthropods. GenBank accession numbers for both new and downloaded sequences are provided in Table 1a.
Table 1 Phyllotreta and nontarget species sequences (GenBank number) used to design Phyllotreta group-specific primers. (b) Phyllotreta group-specific primer sequences (5′–3′) designed from the cytochrome oxidase subunit I gene.
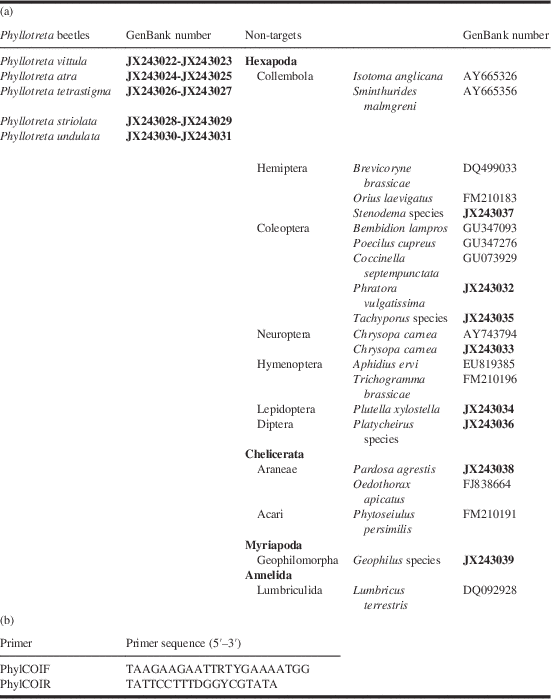
The fragment generated with the designed primers were 188 base pairs long. New sequences submitted to Genbank by the authors are indicated in bold.
Target and non-target sequences were aligned using the software ClustalW (Larkin et al. Reference Larkin, Blackshields, Brown, Chenna, McGettigan and McWilliam2007; Goujon et al. Reference Goujon, McWilliam, Li, Valentin, Squizzato and Paern2010) and the group-specific Phyllotreta primers were designed using the software Amplicon (Jarman Reference Jarman2004). To include all nucleotide variation within the Phyllotreta species group both the forward (PhylCOIF) and the reverse (PhylCOIR) primer were designed as degenerated (Table 1b). The selected primers, which amplified a 188 base pairs fragment, were tested by running gradient PCRs on 10× dilution series of each of the Phyllotreta extracts. The optimised PCR reaction mix (25 μL) contained 0.3 mM of each dNTP, 0.6 μM of each primer, 3 mM MgCl2, 0.75 U HotStar Taq DNA Polymerase (Qiagen Inc.), 2.5 μL of 10× manufacturer’s buffer and 30–100 ng of DNA template. The final cycling conditions were: initial denaturation at 95 °C for 15 minutes followed by 35 cycles of 94 °C for 30 seconds, 56 °C for 30 seconds, 72 °C for 45 seconds and a final extension at 72 °C for 5 minutes.
The specificity of the optimised PCR assay was evaluated by testing the primer pair for cross-amplification against DNA extracted from a panel of nontarget invertebrates commonly found in arable ecosystems (Table 2). All non-target extracts had initially been tested with universal invertebrate primers; either LCO-1490 and HCO-2198 (Folmer et al. Reference Folmer, Black, Hoeh, Lutz and Vrijenhoek1994) or LR-J-12887 and LR-N-13398 (Simon et al. Reference Simon, Frati, Beckenbach, Crespi, Liu and Flook1994) to ascertain that they contained amplifiable DNA. The sensitivity of the PCR assay was also tested on whole body isolates of Phyllotreta DNA that was serially diluted (10−2 and 10−3 dilutions of target DNA were used, hence 0.015–0.5 ng/µL) in isolated DNA of the predator P. impressa. Phylloneta impressa extractions ranged between 35 and 152 ng/µL. These were further diluted 1:4. We tested a series of Phyllotreta-in-Phylloneta dilutions at both 1:1 and 1:4 predator DNA concentrations and the bands were visible in both but the 1:4 dilutions were clearer.
Table 2 Nontarget species included in the specificity/cross-reactivity test of primers PhylCOIF and PhylCOIR.
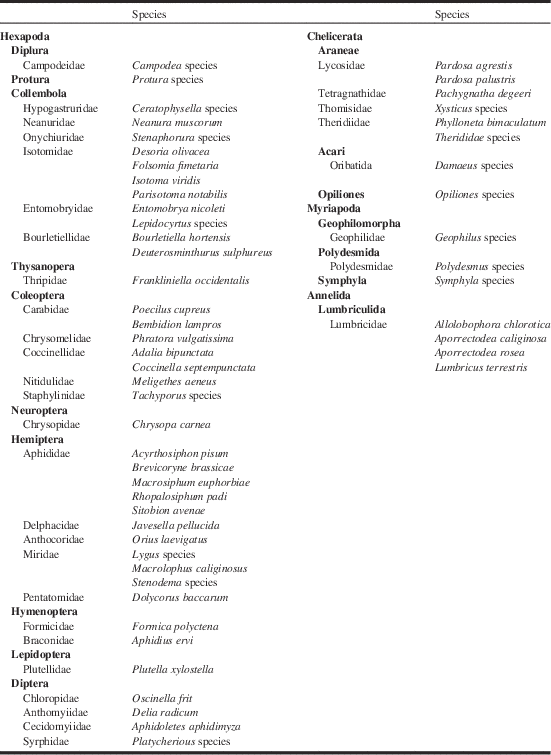
Thripidae, Aphididae, Anthomyiidae, Anthocoridae, and Plutellidae were obtained from laboratory cultures; Aphelinidae, Cecidomyiidae, and Miridae were purchased from Biobasiq Sverige AB whereas species from all other groups were collected in agricultural field and identified following relevant identification keys. Predaceous or large nontargets, were either starved prior to extraction or smaller parts were cut out.
Detection success of Phyllotreta DNA in laboratory-fed Pardosa
A feeding experiment with Pardosa adults of mixed sexes (50% males and 50% females) was conducted. Predators were collected at random by hand from a set-aside field outside Uppsala, Sweden. Immediately upon capture, spiders were individually enclosed in small, aerated plastic vessels filled with moist sand and starved for at least seven days at room temperature. The target prey, Phyllotreta species, were field collected and frozen.
After starvation, 30–40 spiders were transferred individually to clean Petri dishes (47 mm) containing moistened filter paper. Each spider was offered one flea beetle killed by freezing. The predators were observed until feeding started and ceased (typically 15–20 minutes) and individuals that had not begun to eat within 120 minutes were removed from the experiment. Following ingestion, spiders were transferred to clean dishes to avoid external contamination by the remains of flea beetle cuticle that was always left after the meal. The fed predators were then randomly assigned to digest the aphid for 0, 1, 2, 3, 4, 8, 16, 24, or 48 hours in a climate chamber at 14.3±0.02 °C (approximately local average temperature in late May to June). Following the designated digestion period the predators were immediately frozen and stored at −70 °C until DNA extraction. Before the molecular work the spiders were briefly handled to determine species and sex.
To achieve a minimum of 10-fed predators per digestion period, the feeding trial procedure was set up six times with completely new groups of starved predators. All replicates were performed within six days. By always assigning the fed spiders from each group to various digestion periods we compensated for any variation in spider physiological state between replicates. For each replicate, starved unfed specimens were included and later used as negative controls in the PCR analysis. To summarise; for each digestion period, 10–13 spiders that had consumed one flea beetle were analysed by PCR resulting in a total of 92 tested predators (excluding starved, unfed control individuals). The analysed specimens consisted of 75% P. agrestis (Westring), 23% P. palustris (Linnaeus), and 2% other Pardosa species (P. pullata (Clerck), P. fulvipes (Collett)).
Screening of laboratory-fed and field collected predators
DNA was extracted from whole specimens using the DNeasy Blood and Tissue Kit (Qiagen Inc.) as described above. The PCR recipe and cycling conditions described above were used for both Pardosa and Phylloneta extracts with some minor modifications. When screening the Pardosa extracts the extension time was prolonged to 60 seconds and the amount of template DNA was 100–300 ng per reaction, compared with 20–80 ng for Phylloneta. To control for contamination of samples and to assure that the PCR reaction was successful we added at least two positive and two negative controls in each PCR run. In the negative control the DNA template was exchanged to ddH2O and the positive control consisted of purified, diluted target DNA (10−2 and 10−3 dilutions of target DNA were used, hence 0.015–0.5 ng/µL). The PCR product was separated on a 2% agarose gels stained with GelRedTM Nucleic Acid Gel Stain (Biotium, Hayward, California, United States of America) and visualised under ultraviolet light. All samples that turned out negative were rerun a second time to ensure correct classification (positive or negative). Finally, samples that tested negative also after the second run were also tested with general primers to assure that the negative result was not due to inhibitions in the PCR process.
Field collection of Pardosa and Phylloneta spiders for flea beetle DNA screening
The same spiders previously screened for pollen beetle DNA (Öberg et al. Reference Öberg, Cassel-Lundhagen and Ekbom2011) were used. Briefly the collection of these spiders was carried out as follows: Three autumn-sown OSR fields around Uppsala, Sweden (59°51′N, 17°41′E) were chosen in 2008. The fields were all sown in August 2007. On each collection occasion, the growth stage (GS) of the crop was measured according to Lancashire et al. (Reference Lancashire, Bleiholder, van den Boom, Langelüdekke, Stauss and Weber1991). Sampling of Pardosa spiders for gut content analysis was carried out twice a week, beginning on 13 May just before flowering (GS 59) and ending on 9 June (eight sampling occasions). After this date, Pardosa spiders became very rare in the fields and further sampling was not possible.
Sampling of Phylloneta spiders started on 9 June, when Phylloneta spider webs started to be apparent in the vegetation layer in the OSR fields, and ended on 26 June (six sampling occasions), when flowering had finished and seeds were starting to mature (GS 80). All spiders were collected at random by hand within the OSR fields, transferred to individual Eppendorf tubes, and immediately frozen in the field using dry ice. All individuals were stored at –70 °C before further processing.
Predator and prey density measurements
Arthropod density measurements were previously described in Öberg et al. (Reference Öberg, Cassel-Lundhagen and Ekbom2011). The procedures are briefly summarised as follows. Sampling was limited to the time period when Pardosa species was found in the field. Three pairs of pitfall traps were installed in each field on 12 May and were thereafter emptied at collection dates from 15 May to 12 June (twice a week). Pitfall trap pairs were placed in a row in the field 20 m from the edge and 10 m from each other. Two round plastic containers, measuring 12 cm in diameter and 11 cm in height, separated by 50 cm were used. A barrier, made of black plastic and 50 cm in width and 10 cm in height, was placed between the traps. The barriers were anchored using metal skewers stuck into the soil. Traps were filled with water and a small amount of dishwashing detergent. All trapped arthropods from each pair of traps were stored in 70% ethanol. Pitfall trapping was supplemented with sweep netting to catch arthropods in the vegetation on collection dates from 15 May to 12 June (twice a week). The samples from the three pitfall traps collected in each field for each collection date were added together, resulting in one pitfall trap sample for each field (3) and date (9), a total of 27 values. Catches obtained using pitfall traps may not reflect the true abundance of arthropods because they measure activity density. However, for comparison within the same habitat, pitfall traps can be a suitable collection method (Topping and Sunderland Reference Topping and Sunderland1992).
All collected predatory arthropods (spiders included) and potential prey for spiders from pitfall traps were counted (Table 3) and grouped into three categories for each field and collection date to be used in further analyses: Pardosa spiders, predators (excluding Pardosa species), and alternative prey. We have included a category for Pardosa species because wolf spiders can be highly cannibalistic (Wagner and Wise Reference Wagner and Wise1996; Samu et al. Reference Samu, Toft and Kiss1999). Therefore they may be considered both competitors and prey. In pitfall traps, spiders (including Pardosa species) and beetles from the family Carabidae constituted 63% and 22% of all predators caught, respectively. Alternative prey on the ground, as assessed by pitfall trap catches, consisted mainly of pollen beetles, Diptera, and Collembola.
Table 3 Mean number (±SE) and range (in parentheses) of individuals captured per sampling occasion.
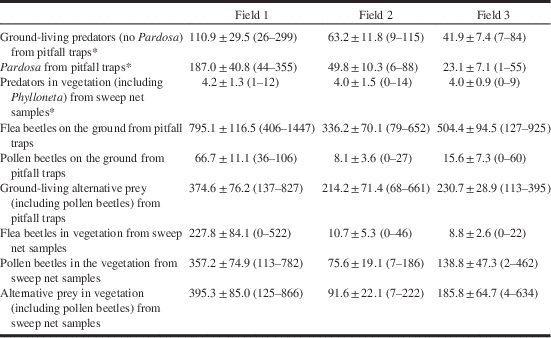
Pitfall trap samples (three pairs of traps per field, estimates for ground-living arthropods and sweep net samples (three times 10 sweeps per field, estimates for arthropods in the vegetation) were taken on nine occasions from 15 May to 12 June 2008 at farms in the vicinity of Uppsala, Sweden. Data marked with an asterisk (*) have been published previously in Öberg et al. Reference Öberg, Cassel-Lundhagen and Ekbom2011.
Sweep net samples were taken ~10 m into the field, 10 sweeps were performed and arthropods were placed in 70% ethanol. The procedure was repeated three times in each field on each collection date. Samples were counted (Table 3), but not used in the statistical analysis. From sweep netting, Phylloneta species constituted 86% of all predators caught, making up the majority of predators living in the vegetation.
Statistical analysis
The relationship between digestion time and the percentage of fed spiders that tested positive for flea beetle DNA was analysed by the SAS Procedure PROBIT. The time point when flea beetle DNA could be detected in 50% of the fed predators was obtained by solving the equation for the digestion time that corresponded to 50% aphid-positive spiders.
The field PCR data were analysed using multiple logistic regression (Hosmer and Lemeshow Reference Hosmer and Lemeshow2000); using the SAS LOGISTIC procedure, with the model binary logit. We used the “scale=deviance” option in SAS to correct for possible overdispersion. The purpose of the analyses was to identify factors associated with flea beetle consumption and analyses were done separately for the two spider groups. For Pardosa species, we used pitfall trap activity densities (availability on the soil surface) of flea beetles, other potential prey, and other predators, as well as the number of Pardosa in the pitfall traps. The presence (1) or absence (0) of flea beetle DNA in individual spiders was the dependent variable, and we tested whether flea beetle consumption was affected by field, Pardosa species, gender/stage (male, female, juvenile), and availability of flea beetles, alternative prey, or the presence of other predators and Pardosa by using data from the same field and date as the tested spiders. We used a less conservative value, P<0.10, when considering parameters likely to influence flea beetle consumption. As all spiders had previously been screened for pollen beetle DNA (Öberg et al. Reference Öberg, Cassel-Lundhagen and Ekbom2011) we also included this as a possible factor in the analysis.
Spiders collected on the plants only consisted of one species, P. impressa, and the logistic regression did not include species; only field, gender/stage (male, female, juvenile) and whether or not the sample had previously tested positive for pollen beetle DNA. The reason for not including other factors in the P. impressa analyses was that we unfortunately did not have data for alternative prey and other predators from the collection time (9–26 June, six sampling occasions).
Results
Assay evaluation
When amplifying the serial dilutions (10−1, 10−2, 10−3, 10−4) of pure whole body isolates it was possible to detect a concentration of 10−4 of P. atra, P. undulata, P. tetrastigma, and P. vittula (0.0015–0.0050 ng/µL) and 10−3 dilutions of P. striolata (0.015–0.050 ng/µL). When the flea beetle template was serially diluted with P. impressa DNA it was possible to detect 10−3 dilutions. None of the nontarget species (Table 2) produced any amplicon of a size similar to the target flea beetle fragment. Individuals testing negative in the feeding experiment and field material did not show signs of inhibitory effects of Pardosa DNA as they produced PCR product when the isolate was run with general primers.
Detection success of flea beetle DNA in laboratory-fed Pardosa
The probit analysis showed that the probability of detecting flea beetle DNA by PCR in laboratory-fed spiders was significantly affected by digestion time (Wald χ2=6.33, P=0.02). Flea beetle DNA was detected in all Pardosa individuals (n=11) that were frozen immediately (t=0) after having ingested the prey item, but thereafter the probability of detecting the target fragment decreased with digestion time. PCR amplification of flea beetle DNA was possible in three of 13 predators 48 hours post feeding, which was the maximum digestion time in the experiment. Results for the rest of the digestion times were (number positive/total number of Pardosa tested) as follows: 5/11 at 1 hour, 9/11 at 2 hours, 2/12 at 4 hours, 6/11 at 8 hours, 2/11 at 16 hours, and 6/12 at 24 hours (Fig. 1). The time point when flea beetle DNA could be detected in 50% fed Pardosa was 10.7 hours. Negative controls, that is, starved predators, yielded no PCR products.
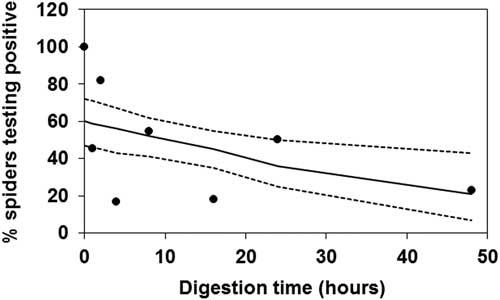
Fig. 1 Percentage laboratory-fed Pardosa spiders that tested positive for flea beetle DNA in relation to digestion time. Following starvation, all predators ingested one flea beetle and were allowed to digest the prey for 0–48 hours. For each observation (dots) 11–13 individual spiders were analysed by polymerase chain reaction. The solid line is the fitted model (probit analysis) and dotted lines are the 95% fiducial limits.
Field samples
In total 19.4% of the 674 hand-collected Pardosa specimens tested positive for flea beetle DNA in the PCR analyses, and 10% of the P. impressa out of 509 tested were positive; which indicates that the two spider genera may differ somewhat in their consumption of flea beetles (Figs 2–3). The presence of adult Pardosa and adult P. impressa spiders in the OSR fields showed little overlap, the first adult P. impressa were found from 9 June and adult Pardosa occurrence dropped considerably in pitfall samples from 12 June. Pardosa consumed flea beetles from just before flowering until the end of flowering and Phylloneta consumed flea beetles from the end of flowering until the beginning of pod ripening (Figs 2–3).
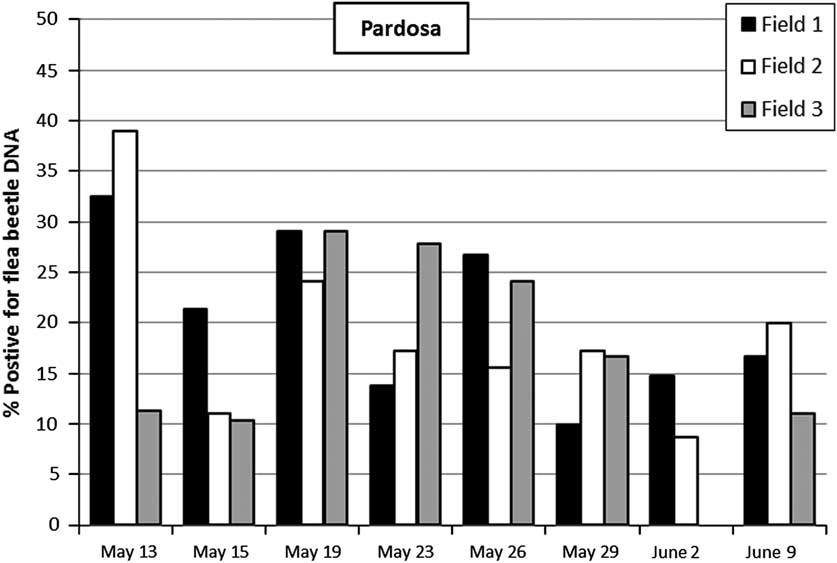
Fig. 2 Results of surveys in three winter oilseed rape fields. Bars represent the proportion of hand-collected wolf spiders of the genus Pardosa that tested positive for flea beetle DNA using polymerase chain reaction-based gut-content analyses. Total percentages for each field were: field 1, 21.4%; field 2, 20.9%; field 3, 15.9%. Total number of Pardosa collected was: field 1=248, field 2=206, and field 3=220.
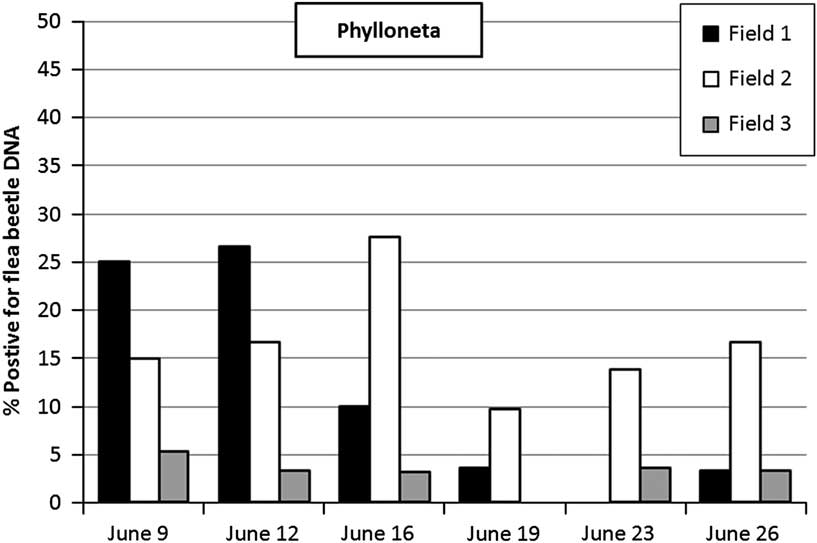
Fig. 3 Results of surveys in three winter oilseed rape fields Bars represent the proportion of hand-collected foliage living spiders, Phylloneta impressa, that tested positive for flea beetle DNA using polymerase chain reaction-based gut-content analyses. Total percentages for each field were: field 1, 9.6%; field 2, 14.2%; field 3, 2.8%. Total number of P. impressa collected was: field 1=169, field 2=169, and field 3=171.
The mean (±SE) number of Pardosa collected for PCR per date and field was 28.0±1.8 (n=24 sampling occasions, three fields by eight samplings per field). Of the Pardosa collected for PCR 41% were juveniles. Among the adults collected, 75% were P. agrestis, 10% P. prativaga (Koch), 6% P. amentata (Clerck), 3% P. pullata, and the remaining five species (P. paludicola (Clerck), P. palustris, P. riparia (Koch), P. lugubris (Walckenaer), and P. fulvipes) constituted 6% of the total adults. In the logistic regression analysis of the Pardosa data there were problems with quasi-complete separation due to some species having small sample sizes, and therefore several species were removed from the analysis. Also pitfall trap data was collected from 15 May, so the first sampling of Pardosa for flea beetle DNA on 13 May was not used in the analysis. This left 78 individuals that contained flea beetle DNA and 433 that did not. There was some overdispersion in the data and the covariance matrix was multiplied by the heterogeneity factor (1.11). The Hosmer and Lemeshow goodness of fit test (χ2=12.67, df=8, P=0.12) supported the model fit. Species, gender, flea beetle density, predator density, alternative prey density and the score for pollen beetle DNA did not significantly affect the probability of detecting flea beetle DNA in Pardosa spiders. The parameters that influenced the probability of a Pardosa spider being positive for flea beetle DNA were field (Wald χ2=5.6, df=2, P=0.06) and densities of conspecific (Pardosa) predators (Wald χ2=3.8, df=1, P=0.05). Increasing Pardosa densities were associated with declining numbers of positives for flea beetle DNA (estimated logistic regression coefficient=−0.007).
The mean (±SE) number of Phylloneta collected for PCR per date and field was 28.3±0.97 (n=18 sampling occasions, three fields by six samplings per field). Of the 509 observations used in the logistic regression analysis 51 were positive for flea beetle DNA and 458 were not. There was some overdispersion in the data and the covariance matrix in the logistic regression was multiplied by the heterogeneity factor (1.26). The Hosmer and Lemeshow goodness of fit test (χ2=7.63, df=7, P=0.37) supported the model fit. Field, gender/stage, and the score for pollen beetle DNA influenced the probability of detecting flea beetle DNA (field: Wald χ2=12.2, df=2, P=0.002; gender/stage; Wald χ2=5.6, df=2, P=0.06; pollen beetle score: Wald χ2=5.7, df=1, P=0.02). Females were more likely to be positive than males (odds ratio estimate=3.6, 95% Wald confidence limits: 1.2–10.6) but males and juveniles did not differ significantly (odds ratio estimate=1.8, 95% Wald confidence limits: 0.14–21.6). Among females 13% were positive for flea beetle DNA; among males and juveniles this was only 4%. If a Phylloneta spider was positive for pollen beetle DNA it was more likely to be positive for flea beetle DNA.
Discussion
Group specific primers for an important pest in Brassica field crops, flea beetles of the genus Phyllotreta, were successfully developed. The 50% prey DNA detection probability for flea beetle DNA in Pardosa spiders was found to be between 10 and 11 hours. We were able to detect flea beetle DNA in field samples of Pardosa and Phylloneta spiders demonstrating that flea beetles are consumed in OSR crop fields by both these predators. This is the first study to demonstrate consumption of flea beetles by spiders in the field. Pardosa appeared to consume flea beetles almost two times more often than P. impressa.
Our results with flea beetle predation by P. impressa are quite different from those (Öberg et al. Reference Öberg, Cassel-Lundhagen and Ekbom2011) with pollen beetles. Over 50% of the collected P. impressa were positive for pollen beetle DNA while only 10% contained flea beetle DNA. Flea beetles appear to be most abundant on the ground (Table 3) and thus would not be as accessible as pollen beetles to the foliage living P. impressa. Another explanation may be that pollen beetle larvae are easier to eat and more likely to be caught in webs than flea beetles. Pollen beetle larvae do not have the hard exoskeleton common in many adult beetles. Detection success of different prey types eaten by the same predator species may also vary (Juen et al. Reference Juen, Hogendoorn, Ma, Schmidt and Keller2012) and this could have influenced our results. Phylloneta impressa was more likely to be positive for flea beetle DNA if P. impressa was also positive for pollen beetle DNA. The proportion of P. impressa with pollen beetle DNA was very high and this may account for our result.
Wolf spiders ate flea beetles readily in detection time tests in the laboratory and this seemed to be the case in the field as well. Although the proportion of Pardosa positive for pollen beetles was lower than for flea beetles we cannot say that Pardosa prefer flea beetles. This may simply be a result of a high number of flea beetles available for predation by Pardosa. But our data analysis did not detect an effect of flea beetle number on the proportion of Pardosa positive for flea beetles. In an earlier study concerning Pardosa predation in cereal fields (Kuusk and Ekbom Reference Kuusk and Ekbom2010, Reference Kuusk and Ekbom2012) wolf spiders readily ate aphids, but this was not influenced by aphid density. It was not uncommon to find that over 50% of the wolf spiders collected in cereals were positive for consumption of aphids at both high and low aphid densities. Predation of the brown planthopper in rice fields has been tested using molecular methods and a mean of about 40% of the collected spiders had consumed the planthopper (Tian et al. Reference Tian, Chen, Li, Li, Chen and Peng2012). Between 5% and 45% of the Pardosa collected in Brassica crops were positive for predation on the diamondback moth (Quan et al. Reference Quan, Wu, Zhou, Yun, Peng and Chen2011). The genus Pardosa is found in many areas of the world and as different agricultural ecosystems are studied using molecular-based prey detection it may be possible to gain a better understanding of the role of Pardosa in food webs.
The two spider genera complement each other in space, Pardosa species predating on the ground and Phylloneta species in the vegetation. Also, the two genera complement each other in time, as adults occur in the field at different crop stages, resulting in Pardosa species consuming flea beetles at the earlier stages of OSR and Phylloneta species at the later stages. This separation of the predators in time is in contrast to studies on prey suppression by foliage-dwelling and ground-dwelling spiders that occur simultaneously (Denno et al. Reference Denno, Mitter, Langellotto, Gratton and Finke2004; Birkhofer et al. Reference Birkhofer, Gavish-Regev, Endlweber, Lubin, von Berg and Wise2008). Adult flea beetles occurred throughout the period of both Pardosa and Phylloneta presence, but were much more numerous on the ground compared with in the foliage (Table 3).
Detectability of pollen beetle DNA at 17 °C in Pardosa was close to 100% up to 24 hours, but fell to 11% at 48 hours (Cassel-Lundhagen et al. Reference Cassel-Lundhagen, Öberg, Högfeldt and Ekbom2009). For flea beetles DNA detectability in Pardosa fell from 100% to about 50% immediately after 1 hour and was very variable among digestion times. This may be due to the difference in prey types. For pollen beetles the prey item was the soft-bodied larva and for flea beetles spiders were fed with hard adult beetles. The spiders had to make a hole in the flea beetle and suck out the contents. Feeding times were generally between 1 and 1.5 hours and it was not possible to judge if each spider consumed the entire contents of the beetle it fed on. Another experimental difference was that the temperature at which spiders were held for digestion was lower for flea beetles than for pollen beetles. The influence of temperature on digestion time has, however, not been studied for Pardosa.
The results indicated an influence of field and activity density of Pardosa on the probability of detecting flea beetle DNA. Pardosa may be showing a numerical response to flea beetle prey numbers, but an increased number of conspecifics may cause interference between individuals and lower consumption rates. In our previous study (Öberg et al. Reference Öberg, Cassel-Lundhagen and Ekbom2011) we found that density of alternative prey had a negative impact on the percentage of Pardosa testing positive for pollen beetle consumption. Adult flea beetles, Phyllotreta species, were very abundant and could have been the alternative prey that drew Pardosa spiders away from pollen beetles as the number of pollen beetles found on the ground was much lower than the number of flea beetles (Table 3). It is impossible to prove cause and effect using field inventory data; only strong trends will be evident in the complex data. Understanding the influence of prey availability and predator numbers on pest consumption by chosen predators will require controlled experiments and much more information about predator and prey identity.
Oilseed rape is a crop that bears a considerable insecticide burden, which probably severely retards the action of natural enemies (Williams Reference Williams2010). There are, however, numerous parasitoids and predators (Warner et al. Reference Warner, Allen-Williams, Warrington, Ferguson and Williams2008) that have been identified as potential biocontrol agents of the pollen beetle. In addition flea beetles are attacked by parasitoids (Ekbom Reference Ekbom2010) and we have now clearly demonstrated that two groups of spiders, complementing in each other in both space and time, consume flea beetles in the field. An important tool for a better understanding of the various contributions of natural enemies within the complex, as demonstrated in our study, is the use of molecular methods for gut content analysis (King et al. Reference King, Read, Traugott and Symondson2008). As new primers for arthropods present in Brassica crops are developed studies of food webs will reveal relationships between natural enemies and prey. This will provide important knowledge for enhancing conservation biological control.
Acknowledgements
The authors would like to thank all the farmers who allowed them to work in their fields. Carol Högfeldt, Karin Hill, Martina Sjöström, and Sophie Högfeldt provided excellent technical assistance. Mikael Andersson Franko is thanked for statistical advice. Adrien Rusch translated the abstract to French. Financial support was provided by the Swedish Research Council for Environment, Agricultural Sciences and Spatial Planning (Formas).


