Introduction
Members of the genus Copitarsia are polyphagous, multivoltine, noctuid moths that are native to Mexico, Central America and South America (Simmons & Pogue, Reference Simmons and Pogue2004). They do not occur in the United States but are routinely intercepted in shipments of ornamental, horticultural and agricultural crops at United States border ports (Hunter & Simmons, Reference Hunter and Simmons1995; Venette & Gould, Reference Venette and Gould2006). Risk of Copitarsia establishment in the United States and subsequent consequences are considered high, although the confidence in this assessment is low to moderate, in part because our understanding of individual species in this taxonomically complex genus is meagre (Simmons & Scheffer, Reference Simmons and Scheffer2004; Venette & Gould, Reference Venette and Gould2006).
One approach to quantify the probability of Copitarsia establishment involves population viability analyses. The objective of these analyses is to predict population growth under specific conditions (McCallum, Reference McCallum2000). Survival curves are an initial stage in determining basic life table statistics with which population viability analyses can be performed. The classic life table describes mortality of individuals in a population based on their chronological age (reviewed in Carey, Reference Carey1993). In poikilothermic organisms, whose development rate and lifespan are highly influenced by temperature, survival curves based on chronological age are likely to differ among temperatures, whereas survival curves based on physiological age (e.g. degree days) will be similar within a range of temperatures (Jones et al., Reference Jones, Tome and Caprio1997).
Although the influence of temperature on insect development is widely accepted (reviewed in Wagner et al., Reference Wagner, Olson and Willers1991; Liu et al., Reference Liu, Zhang and Zhu1995; Mironidis & Savopoulou-Soultani, Reference Mironidis and Savopoulou-Soultani2008), survival curves for insects are often reported in terms of chronological age (Smith, Reference Smith1986; Mbapila & Overholt, Reference Mbapila and Overholt2001; Morgan et al., Reference Morgan, Walters and Aegerter2001; Tsai & Wang, Reference Tsai and Wang2001; Wang & Tsai, Reference Wang and Tsai2001; Medeiros et al., Reference Medeiros, Ramalho, Zanuncio and Serrão2003; Matadha et al., Reference Matadha, Hamilton and Lashomb2004; Legaspi & Legaspi, Reference Legaspi and Legaspi2005; Kivan & Kilic, Reference Kivan and Kilic2006; Russo et al., Reference Russo, Cocuzza, Vasta, Simola and Virone2006; Mironidis & Savopoulou-Soultani, Reference Mironidis and Savopoulou-Soultani2008). Physiological age-based survival curves are not common (except Jones et al., Reference Jones, Tome and Caprio1997; Choi & Ryoo, Reference Choi and Ryoo2003; McCornack et al., Reference McCornack, Ragsdale and Venette2004). Physiological age, typically measured in degree days, is based on the common, empirical observation that developmental rate (time to complete development)−1, increases linearly over a range of temperatures. The base temperature (or threshold) describes the minimum temperature at which development occurs and is often estimated from linear regression rather than being observed empirically (reviewed in Wagner et al., Reference Wagner, Olson and Willers1991). At high or low temperatures, the linear relationship does not hold and the utility of degree days is compromised; but, within an appropriate range of temperatures, degree-days are appropriately descriptive and useful for predicting the state of a population. Developmental rates and base temperatures vary depending on life-history events, for example development through a single stage (larva, pupa, etc.) or through multiple stages (from egg to egg), because each life-history event is uniquely affected by temperature (Milonas & Savopoulou-Soultani, Reference Milonas and Savopoulou-Soultani2000; Matadha et al., Reference Matadha, Hamilton and Lashomb2004; Oliveira et al., Reference Oliveira, Vieira and Garcia2004). In addition, no correlation among base temperatures for different stages has been identified (Hogg & Calderon C, Reference Hogg and Calderon C.1981). The relationship of mortality and temperature may also be unique. Thus, expressing survivorship in terms of physiological age may require a distinct base temperature in which the event of interest is death instead of the completion of a particular developmental stage.
The first objective of this paper is to further expand our understanding of Copitarsia biology by reporting chronological and physiological age-based survival curves for Copitarsia corruda Pogue & Simmons collected from Peru and reared in quarantine laboratory conditions on asparagus at six different constant temperatures. The second objective is to demonstrate the use of senescence rate as an alternative to developmental rate in developing a unified physiological age-based survival curve to describe survival under non-stress temperature conditions.
Methods and materials
Eggs and larvae of Copitarsia corruda collected in Peru in 2001 and 2003 were used to establish a colony in a quarantine laboratory (Gould et al., Reference Gould, Venette and Winograd2005). The species differs genetically and morphologically from known species of Copitarsia (Pogue & Simmons, Reference Pogue and Simmons2008). Gould et al. (Reference Gould, Venette and Winograd2005) reported the colony as C. decolora, but this identification has subsequently proven to be incorrect. Specimens are deposited at the Smithsonian Institution National Museum of Natural History, Washington D.C. (Accession Nos USNM ENT 0014762 and USNM ENT 00147963) and the University of Minnesota insect collection (UMSP 000124106–UMSP 000124120). Individual neonate larvae from this colony were placed in 60-ml plastic cups containing 4 cm of asparagus stems. The cups were covered with paper lids and placed in growth chambers at 9.7, 14.6, 20.1, 24.9, 29.5 and 34.5°C. Forty larvae were studied at each temperature, except at 29.5 and at 34.5°C where 70 and 50 individuals were observed, respectively. Adult moths were sexed after pupal eclosion. Male-female pairs were placed in 8.5-cm tall by 8.5-cm diameter paper canisters. Once oviposition was observed, the male and female were placed in separate cages. Mortality was recorded daily. Additional details regarding the experimental design and results other than survivorship are available in Gould et al. (Reference Gould, Venette and Winograd2005).
Chronological and physiological age-based survival curves were constructed using the Kaplan-Meier method (PROC LIFETEST: SAS Institute, 1990; Allison, Reference Allison1995). The Kaplan-Meier method, also known as the product-limit estimator, is the nonparametric maximum likelihood estimator of survivorship over time (Allison, Reference Allison1995). Nonparametric statistics are preferred when dealing with small sample sizes of non-normal distribution (Kvanli, Reference Kvanli1988). Another advantage of PROC LIFETEST over the parametric (LIFEREG) and semi-parametric (PHREG) survival analyses counterparts is that it allows for direct comparison of survival curves across treatment groups (Allison, Reference Allison1995).
The Kaplan-Meier method assumes that each individual alive at the beginning of an age interval represents an independent binomial trial, and the survival function is calculated by the following equation:
and the associated standard error is:
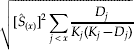
where Ŝ (x) is the estimated proportionate survival at age x, D j is the number of individuals dying in age class j, and K j is the number of individuals living at the beginning of age class j (reviewed in McCallum, Reference McCallum2000). The date of natural death could not be determined for every individual in the experiment (table 1). Non-informative random censoring (Allison, Reference Allison1995) occurred in our experiment when individuals escaped their enclosure before the end of the experiment (5%) or died prematurely by failing to uncouple after mating or being manually extricated from their mate (2%) (table 1) (Gould et al., Reference Gould, Venette and Winograd2005). A few neonate larvae (8%) were fatally injured during the setup of the experiment. These individuals were entirely excluded from the analysis and were not considered censored. When dealing with uncensored data, the Kaplan-Meier estimates of survival are the same as the fraction of initial cohort alive at the beginning of the interval (l x) traditionally defined as
where K x and K 0 are the numbers of individuals at the beginning of age class x and 0, respectively (Carey, Reference Carey1993). However, when some data are censored, estimates from the Kaplan-Meier survival function are preferred over the traditional definition of l x (McCallum, Reference McCallum2000).
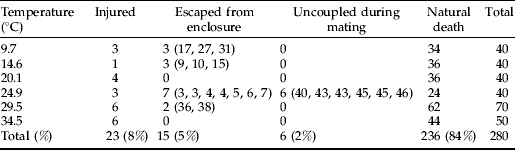
Table 1. Fate of Copitarsia corruda individuals during the experiment. Forty to 70 neonate larvae were placed in 60-ml plastic cups covered with a lid at each of six constant temperatures. Larvae fatally injured during experimental setup were dropped from the analysis. Individuals that escaped the cups or remained attached during mating were considered censored data. Days in which censored individuals were last observed are in parenthesis next to the number of individuals.
The Logrank test and the Tarone and Ware test for equality of survival distributions were used to determine differences among chronological age-based and physiological age-based survivorship functions at different temperatures (PROC LIFETEST; SAS Institute 1990). Both are non-parametric tests chosen because at least 20% for one of the curves were censored, and the data did not follow a common family of distributions (e.g. normal, lognormal) (reviewed in Pyke & Thompson, Reference Pyke and Thompson1986). The Logrank test was used for chronological age-based survival curves, and the Tarone and Ware test was used for the physiological age-based survival curves which crossed with each other (Tarone & Ware, Reference Tarone and Ware1977; Allison, Reference Allison1995; Lee & Wang, Reference Lee and Wang2003). To maintain an overall α=0.05, Bonferroni correction method was used for pairwise comparison of survivorship functions (k=15) to give a modified α of 0.0038 (Sokal & Rohlf, Reference Sokal and Rohlf1995).
Physiological age-based survival curves were initially constructed based on the relationship between temperature and development. Gould et al. (Reference Gould, Venette and Winograd2005) observed that developmental rate (egg to egg) increased linearly with increased temperature from ≈9 to 25°C; development was predicted to begin at 7.2°C. Based on these results, we calculated the number of degree days accumulated above 7.2°C for each temperature studied. Degree days were calculated by subtracting the base temperature from the treatment temperature and then multiplying by age as per Jones et al. (Reference Jones, Tome and Caprio1997) and McCornack et al. (Reference McCornack, Ragsdale and Venette2004). Degree days replaced chronological age (x) in the Kaplan-Meier estimates of survivorship.
We also calculated physiological age survival curves based on the relationship between temperature and senescence rate, defined as the reciprocal of the median of ‘days to death’. First, we regressed senescence rate versus temperature to identify the range of temperatures for which this relationship was linear (PROC REG; SAS Institute 1990). Because the data were not normally distributed, we did not calculate a base temperature from this regression. Instead, we used the entire survival curve to obtain a senescence base temperature. To do so, we initially set the base temperature to 0°C and calculated degree days. Kaplan-Meier survival estimates were obtained for each experimental temperature from 9.7 to 24.9°C, the linear range of temperatures. We calculated the sum of squared deviations of the Kaplan-Meier estimates as a measure of dispersion among curves of different temperatures given a particular base temperature. We also calculated the range and the mean absolute deviation as measures of dispersion (Kvanli, Reference Kvanli1988). We repeated the process with base temperature increments of 0.5°C to 4.5°C, 0.1°C increments from 4.5° to 7.0°C, and 0.5°C from 7.0° to 9.5°C. We selected the temperature at which the dispersion among the survivorship curves was minimized as the base temperature for the unified survivorship curve. Then, we pooled data from 9.7 to 24.9°C. We transformed ‘days to death’ to ‘degree days to death’ using the selected base temperature and obtained Kaplan-Meier survivorship estimates to construct a unified curve.
Results and discussion
We observed significant differences among all chronological age-based survival curves of C. corruda reared at 9.7, 14.6, 20.1, 24.9, 29.5 and 34.5°C (Logrank χ2=402.14, df=5, P<0.0001; fig. 1). Longevity declined with increasing temperatures, from 254 days at 9.7°C to 3.5 days at 34.5°C. Similar effects of temperature on longevity have been reported for a wide variety of insects (Fischer & Fiedler, Reference Fischer and Fiedler2001; Wang & Tsai, Reference Wang and Tsai2001; Matadha et al., Reference Matadha, Hamilton and Lashomb2004; Gould et al., Reference Gould, Venette and Winograd2005; Legaspi & Legaspi, Reference Legaspi and Legaspi2005), including C. decolora grown on Alstroemeria spp. (Moreno Fajardo & Serna Cardona, Reference Moreno Fajardo and Serna Cardona2006). In our study, survival at 24.9°C on asparagus drops substantially after 50 days, whereas Flores Pérez et al. (Reference Flores Pérez, Bautista Martínez, Vera Graziano, Valdéz Carrasco and Angulo2004) noted more uniform mortality over time at the same temperature for C. incommoda grown on a cauliflower or broccoli diet. Without explicit consideration of temperature, chronological age-based survival curves for insects have limited utility.

Fig. 1. Kaplan-Meier chronological age-based survival probability estimates (±SEM) of Copitarsia corruda reared on asparagus at six constant temperatures. Data points and standard errors are only shown at the beginning and at the end of time intervals with constant survival estimates. All treatments start with survival probability of 1.0 on day 0 (–•–, 9.7°C; –○–, 14.6°C; –▾–, 20.1°C; –▿–, 24.9°C; –■–, 29.5°C; –□–, 34.5°C).
Physiological age-based survival curves constructed with the base temperature of 7.2°C for Copitarsia corruda reared at 14.6, 20.1 and 24.9°C were not significantly different from each other (Tarone and Ware, P≥0.1152), but were different from the curve at 9.7°C (Tarone and Ware, P<0.0001; fig. 2). Jones et al. (Reference Jones, Tome and Caprio1997) also noted less variation among survival curves from different temperatures when physiological age-based survival curves were compared with chronological age-based survival curves, but they still described considerable variation among physiological age-based curves when a developmental base temperature was used. The developmental base temperature failed to unite the survivorship curves.

Fig. 2. Kaplan-Meier physiological age-based survival probability estimates (±SEM) of Copitarsia corruda reared on asparagus at six constant temperatures. Base temperature obtained from regression of developmental days from egg to egg. Data points and standard errors are only shown at the beginning and at the end of time intervals with constant survival estimates. All treatments start with survival probability of 1.0 on day 0 (–•–, 9.7°C; –○–, 14.6°C; –▾–, 20.1°C; –▿–, 24.9°C; –■–, 29.5°C; –□–, 34.5°C).
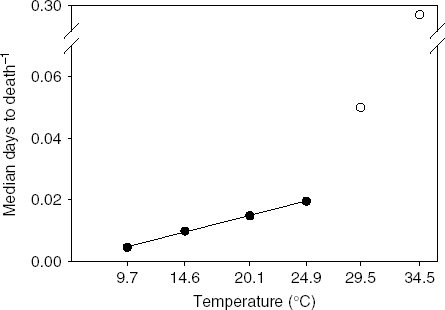
The relationship between senescence rate and temperature was linear at temperatures 9.7 through 24.9°C (R 2=0.998, P<0.001; fig. 3). Outside this range, senescence rapidly accelerated, which we interpret as a stress response. Therefore, the linear range of temperatures can be considered non-stress temperatures where increased senescence is simply the result of accelerated, normal physiological processes. Temperatures where the relationship departs from linearity can be considered stress temperatures where increases in temperature accelerate physiological processes to the extent of causing lethal damage to the insect. Like the relationship between days to development and temperature, the relationship between longevity and temperatures is linear within a mid-range of temperatures (Graham et al., Reference Graham, Glick and Ouye1967; Smith, Reference Smith1986; Wang & Tsai, Reference Wang and Tsai2001).

Fig. 3. Relation of senescence rate (inverse of median ‘days to death’) and temperature for Copitarsia corruda individuals reared on asparagus at 9.7, 14.5, 20.1, 24.9, 29.5 and 34.5°C. Observed values for 29.5 and 34.5°C are outside the linear relation of senescence rate and temperature (•, Non-stress temperature; ○, Stress temperatures).
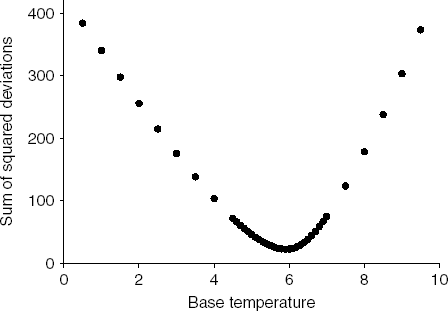
The base temperature that minimized the dispersion among the four survival curves within the non-stress temperature conditions was 5.9°C (fig. 4). For our data set, this base temperature was the same regardless of whether we used the sum of squared deviations, the range or the mean absolute deviation as a measure of dispersion (data not shown). When the senescence base temperature was used to construct physiological age-based survival curves (fig. 5), we found that survival curves of individuals reared at 29.5 and 34.5°C, the stress temperatures, were significantly different from survival curves at non-stress temperatures (Tarone and Ware, P<0.001). As expected, we found no significant difference among survival curves at 9.7, 14.5, 20.1 and 24.9°C (Tarone and Ware, P>0.05). Degree day survival curves with base temperature equal to 5.9°C reflect high survival early in the lifespan under laboratory conditions at 9.7, 14.5, 20.1 and 24.9°C, with survival decreasing more dramatically after approximately 900 degree days.

Fig. 4. Estimation of base temperature by minimizing the sum of squared deviations of the Kaplan-Meier survival curves of Copitarsia corruda reared at 9.7, 14.5, 20.1 and 24.9°C.

Fig. 5. Kaplan-Meier degree day survival probability estimates (±SEM) of Copitarsia corruda reared on asparagus at six constant temperatures with base temperature equal to 5.9°C. Base temperature used minimized the sum of squared deviations of the means of the survival curves at 9.7, 14.5, 20.1 and 24.9°C. Data points and standard errors are only shown at the beginning and at the end of time intervals with constant survival estimates. All treatments start with survival probability of 1.0 on day 0 (–•–, 9.7°C; –○–, 14.6°C; –▾–, 20.1°C; –▿–, 24.9°C; –■–, 29.5°C; –□–, 34.5°C).
Once a base temperature for senescence was identified (5.9°C), it was possible to express survival for non-stress conditions in terms of a single physiological age-based survival curve. This unified physiological age-based survival curve shares characteristics of the physiological age-based survival curves at non-stress temperatures (fig. 6). The median ‘days to death’ was 1009.2 (±0.04 SEM) degree days. Only 25% of the population survived to 851.2 (±0.04 SEM) degree days and maximum lifespan was 1405.8 degree days. The curve shows relatively low mortality at early age and increased mortality at the latter part of the lifespan. This result is similar to survival curves reported for other insects reared in laboratory conditions (Smith, Reference Smith1986; Jones et al., Reference Jones, Tome and Caprio1997; Kairo & Murphy, Reference Kairo and Murphy1999; Wang & Tsai, Reference Wang and Tsai2001). The most common survivorship curve in nature for organisms that produce numerous offspring shows the inverse pattern with low survivorship during the early ages of life and much higher survival for older individuals (Gotelli, Reference Gotelli1995). Survival curves for lepidopteran species studied in field conditions show high variability (Zalucki et al., Reference Zalucki, Clarke and Malcolm2002). In field conditions, departures from the unified curve may be caused by predation, parasitism, cannibalism or limitations while establishing a feeding site (Cortés P. et al., Reference Cortés P., Aguilera P., Vargas C., Hitchins Q., Campos and Pacheco W.1972; Lamborot et al., Reference Lamborot, Arretz, Guerrero and Araya1995; Zalucki et al., Reference Zalucki, Clarke and Malcolm2002; Acatitla Trejo et al., Reference Acatitla Trejo, Bautista Martínez, Carrillo Sánchez, Cibrián Tovar, Del Río Galván, Osorio Córdoba, Sánchez Arroyo, Suárez Vargas and Torres Nohra2006). Another characteristic of the unified survival curve, also noticeable in the survival curves for each temperature, is a relatively long right tail. Only 9.4% of the population remained alive after 1160 degree days, but some individuals lived for an additional 245 degree days after this point. This pattern is biologically relevant, has significant impact on the way we think about mechanisms underlying senescence and has been previously reported for other insects (Carey, Reference Carey1993). It is generally assumed that the expectation of life decreases constantly with age. Instead, we observe an increase in life expectation for a few individuals in the population at the end of their lifespan.

Fig. 6. Kaplan-Meier degree day survival probability estimates (±SEM) of Copitarsia corruda reared on asparagus at four constant temperatures (9.7, 14.5, 20.1 and 24.9°C) with base temperature equal to 5.9°C. Data points and standard errors are only shown at the beginning and at the end of time intervals with constant survival estimates.
The construction of physiological age-based survival curves should be based on thresholds relevant to senescence rate instead of developmental rate because there is no a priori reason to assume that senescence rate will be equal to developmental rate. Furthermore, minimizing dispersion among survival curves to obtain a senescence base temperature offers two main advantages over the use of a base temperature obtained from a regression line. First, it accounts for the entire shape of the response curve instead of a single measurement of central tendency. Consequently, it is not necessary to choose between the mean and the median, avoiding the complications of defining a distribution for death events. Second, it includes information from all individuals. When using a developmental threshold, such as the development time from egg to egg, only those individuals that reproduced contribute to this estimate.
To quantify the probability of population establishment for a pest like C. corruda, information regarding survivorship is necessary. The advantage of a unified physiological age-based survivorship is that mortality is not assumed to be constant throughout the stages of insect development. Instead, the unified physiological age-based survivorship curve provides a common baseline to examine mortality between 5.9 and 24.9°C, regardless of the insect's developmental stage. Combined with fertility measures, this unified physiological age-based curve can help us develop matrix population models to forecast the number and distribution of individuals and determine minimum viable populations. Addition of other mortality factors to the baseline will allow us to better quantify the risk associated with repeated, unintended introductions of C. corruda. Future work will address how this survivorship curve performs under varying temperature conditions.
Acknowledgements
The project was supported by the National Research Initiative of the USDA Cooperative State Research, Education and Extension Service, grant number 2005-35605-15403. We thank James Carey, Vincent Jones and two anonymous reviewers for constructive comments on previous drafts of this paper and John Stanovick for assistance with statistical analyses.