Introduction
The green peach aphid Myzus persicae and the pea aphid Acyrthosiphon pisum are the cosmopolitan agricultural pests and the major component of alarm pheromone released by them is (E)-β-farnesene (EβF) (Griffiths & Pickett, Reference Griffiths and Pickett1980; Francis et al., Reference Francis, Vandermoten, Verheggen, Lognay and Haubruge2005), which plays important roles in mediating interactions among aphids, host plants and aphid natural enemies. EβF widely exists in plants (Kunert et al., Reference Kunert, Otto, Röse, Gershenzon and Weisser2005), and EβF synthase genes have been isolated from different plants and some microorganisms (Picaud et al., Reference Picaud, Brodelius and Brodelius2005; Zhao et al., Reference Zhao, Lei, Vassylyev, Lin, Cane, Kelly, Yuan, Lamb and Waterman2009) and researchers have been working on the use of EβF as an aphid repellent in the push-pull strategy (Cook et al., Reference Cook, Khan and Pickett2007). The EβF synthase has been heterologously expressed in plants by transgenic technology and the EβF released by the transgenic plants repelled aphids and even attracted natural enemies (Beale et al., Reference Beale, Birkett, Bruce, Chamberlain, Field, Huttly, Martin, Parker, Phillips, Pickett, Prosser, Shewry, Smart, Wadhams, Woodcock and Zhang2006; Yu et al., Reference Yu, Jones, Ma, Wang, Xu, Zhang, Zhang, Ren, Pickett and Xia2012; Bruce et al., Reference Bruce, Aradottr, Smart, Martin, Caulfield, Doherty, Sparks, Woodcock, Birkett, Napier, Jones and Pickett2015). Nevertheless, as of now, the site and molecular mechanism of EβF biosynthesis in aphids are still largely unknown.
The aphid alarm pheromone EβF as a sesquiterpene is secreted from the cornicles of aphids, but the source of EβF is still unclear. Theoretically, there are three possible sources for the EβF released by aphids: the host plant, endosymbionts and the aphid itself. Yet, we have recently eliminated the possibility of the host plant and endosymbionts as the sources of EβF in aphids by rearing aphids on non-plant diets and antibiotic-treatment (Sun & Li, Reference Sun and Li2017). It is, therefore, most likely that the aphid itself is responsible for EβF synthesis. However, no sequences homologous to plant sesquiterpene synthase have been identified so far, although the genome sequence of several aphid species have been available, including M. persicae and A. pisum (Legeai et al., Reference Legeai, Shigenobu, Gauthier, Colbourne, Rispe, Collin, Richards, Wilson, Murphy and Tagu2010; The International Aphid Genomics Consortium, 2010).
Farnesyl diphosphate (FPP) is the precursor for biosynthesis of juvenile hormone (JH) in insects, and the site for JH biosynthesis is known to be the corpora allata (CA); FPP was also the precursor for the biosynthesis of EβF in plants (Sallaud et al., Reference Sallaud, Rontein, Onillon, Jabès, Duffé, Giacalone, Thoraval, Escoffier, Herbette, Leonhardt, Causse and Tissier2009). The biosynthesis of FPP is catalyzed by the farnesyl diphosphate synthase (FPPS). The first insect FPPS was reported in the moth Agrotis ipsilon (Castillo-Gracia & Couillaud, Reference Castillo-Gracia and Couillaud1999). Since then, many FPPS genes have been identified in other insects, including aphid species (Cusson et al., Reference Cusson, Béliveau, Sen, Vandermoten, Rutledge, Stewart, Francis, Haubruge, Rehse, Huggins, Dowling and Grant2006; Sen et al., Reference Sen, Trobaugh, Béliveau, Richard and Cusson2007; Lewis et al., Reference Lewis, Prosser, Mohib and Field2008; Taban et al., Reference Taban, Tittiger, Blomquist and Welch2009; Bomtorin et al., Reference Bomtorin, Mackert, Rosa, Moda, Martins, Bitondi, Hartfelder and Simões2014; Huang et al., Reference Huang, Marchal, Hult and Tobe2015). In our laboratory, we have worked on aphid FPPS genes for many years, including MpFPPS1 and MpFPPS2 in M. persicae (Zhang & Li, Reference Zhang and Li2008, Reference Zhang and Li2012), AgFPPS in the cotton aphid Aphis gossypii (Ma et al., Reference Ma, Sun, Zhang, Li and Shen2010; Zhang & Li, Reference Zhang and Li2013, Reference Zhang and Li2014; Sun & Li, Reference Sun and Li2017) and RpFPPS1 and RpFPPS2 in the bird cherry-oat aphid Rhopalosiphum padi (Sun & Li, Reference Sun and Li2012). In vitro analysis of enzymatic activity with recombinant proteins showed that aphid FPPSs displayed dual geranyl/FPPS activity, and a linked enzymatic assay using the aphid FPPS and peppermint sesquiterpene synthase produced EβF (Lewis et al., Reference Lewis, Prosser, Mohib and Field2008), indicating the potential involvement of aphid FPPS in the biosynthesis of alarm pheromone. Therefore, we suppose that FPP should also be the precursor for EβF biosynthesis in aphids if it is originated from the aphid itself. Moreover, the plasticity of FPPS and other isoprenoid synthases also prompted us to speculate that they might have a moonlighting synthase activity responsible for the biosynthesis of EβF in aphids. For instance, the geranyl diphosphate synthase (GPPS) in the bark beetle Ips pini showed both GPPS and monoterpene synthase activity (Gilg et al., Reference Gilg, Tittiger and Blomquist2009); the α-farnesene synthase from apple displayed both sesquiterpene synthase and prenyltransferase activity (Green et al., Reference Green, Friel, Matich, Beuning, Cooney, Rowan and MacRae2007), and the albaflavenone synthase (CYP170A1) in the soil bacterium, Streptomyces coelicolor, also exhibited the activity of a farnesene isomerase (Zhao et al., Reference Zhao, Lei, Vassylyev, Lin, Cane, Kelly, Yuan, Lamb and Waterman2009).
The expression analysis of FPPS genes has mainly been focused on their association with JH biosynthesis. The highest expression of FPPS gene was detected in CA in the insects such as A dhemarius ypsilon (Castillo-Gracia & Couillaud, Reference Castillo-Gracia and Couillaud1999), Diploptera punctata (Huang et al., Reference Huang, Marchal, Hult and Tobe2015) and Leptinotarsa decemineata (Li et al., Reference Li, Meng, Lu, Guo and Li2016). In the silkworm Bombyx mori, the gene BmFPPS2 was highly expressed in CA, while BmFPPS1 expressed in various tissues, suggesting that BmFPPS2 played a key role in the biosynthesis of JH (Cusson et al., Reference Cusson, Béliveau, Sen, Vandermoten, Rutledge, Stewart, Francis, Haubruge, Rehse, Huggins, Dowling and Grant2006; Kinjoh et al., Reference Kinjoh, Kaneko, Itoyama, Mita, Hiruma and Shinoda2007; Cheng et al., Reference Cheng, Meng, Peng, Qian, Kang and Xia2014). Interestingly, four FPPS genes were identified in the cotton bollworm Helicoverpa armigera, and tissue expression showed that HaFPPS1 and HaFPPS2 were mainly expressed in the head, and the expression level of HaFPPS3 was very low in all tissues examined, but the transcripts of HaFPPS4 were highly enriched in the head, epidermis and fat body (Zhang et al., Reference Zhang, Ma, Xiao, Liu, Chen, Wu and Liang2017). Subsequent injection of dsFPPS4 significantly reduced the mRNA level of HaFPPS4 in the head, which was accompanied by a decrease of JH titer in vivo and an effect on the normal molting of larvae. On the other hand, the results of temporal expression analysis of FPPS genes were more complicated, as they were influenced by various factors, including sex, molting, mating, stadium and feeding status (Kinjoh et al., Reference Kinjoh, Kaneko, Itoyama, Mita, Hiruma and Shinoda2007; Bomtorin et al., Reference Bomtorin, Mackert, Rosa, Moda, Martins, Bitondi, Hartfelder and Simões2014; Cheng et al., Reference Cheng, Meng, Peng, Qian, Kang and Xia2014; Li et al., Reference Li, Meng, Lu, Guo and Li2016; Zhang et al., Reference Zhang, Ma, Xiao, Liu, Chen, Wu and Liang2017). For example, the expression patterns of FPPS gene in the blister beetle Mylabris cichorii (emitting cantharidin as a defensive terpene) were different during different adult phases (Zha et al., Reference Zha, Yin, Wang, Huang, Li and Wang2017). There was only one case in which the expression of an aphid FPPS gene was analyzed, indicating that the single FPPS gene in Aphis gossypii was highly expressed in CA at adult stage (Ma et al., Reference Ma, Sun, Zhang, Li and Shen2010). In the present study, we firstly conducted a spatiotemporal expression analysis of the two FPPS genes (FPPS1 and FPPS2) in M. persicae and A. pisum; secondly, the amounts of EβF were quantitatively measured by gas chromatography-mass spectrometry (GC-MS), and finally, an association analysis was performed using the expression data and the amounts of EβF. Our results suggested that the cornicle area may be the site for EβF biosynthesis, and FPPS1 gene may play a key role in the biosynthesis of aphid alarm pheromone.
Method
Sample acquisition
M. persicae and A. pisum were reared on pepper and broad bean plants, respectively, and both aphid species were maintained separately in our laboratory (20 ± 1 °C; L16:D8; relative humidity 65–75%). Apterous adult aphids were transferred to host plants and removed after 12 h to acquire developmentally consistent aphid offspring. The aphids of each developmental stage were collected, including the embryo, 1st-, 2nd-, 3rd-, 4th-instar nymphs, apterous and alate adults (supplementary fig. 1). For nymphs and adults, the antennae of aphids were gently touched with a soft brush, and when their stylets were pulled out from plant leaves, the aphids were then collected into a 1.5-ml microcentrifuge tube, ensuring the cornicle droplets were not released from aphids; the embryos were dissected directly from the adults in a plastic petri dish. The aphids at different stages were directly put into liquid nitrogen for RNA extraction. For tissue-specific expression analysis, the apterous adult aphids were selected for the convenience of tissue dissection, which were dissected in 0.1% DEPC water under a stereomicroscope; the CA, cornicle (cut off from the 5th- or 6th-tergite) and midgut were isolated and immediately transferred to a centrifuge tube containing TRIzol reagent (Aidlab, Beijing, China) (Bogaert et al., Reference Bogaert, Jonghe, Damme, Maes and Smagghe2015). Total RNA was extracted following the instructions, and the first-strand cDNA was synthesized with 500 ng RNA by using the PrimeScript™ RT reagent Kit (TaKaRa, Beijing, China), which was diluted five times with double-distilled water for further quantitative reverse transcription-polymerase chain reaction (qRT-PCR) analysis.
Spatiotemporal expression analysis of FPPS1/2 by using qRT-PCR
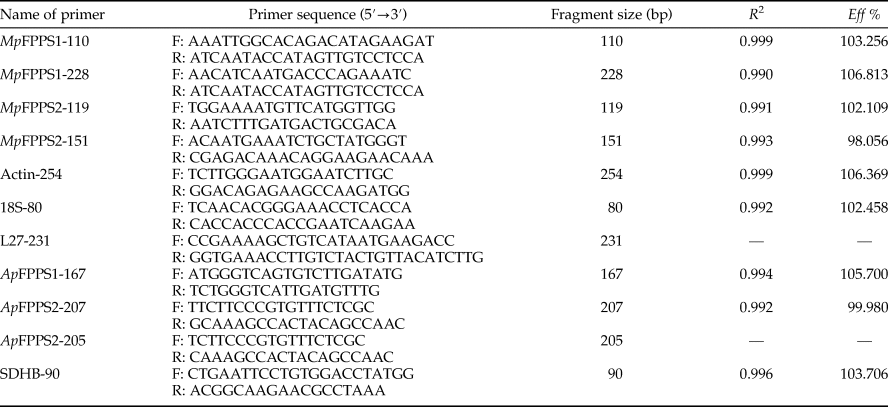
A total of seven pairs of primers were designed based on the cDNA sequences of MpFPPS1/2 of M. persicae (EU334430, EU334431) and ApFPPS1/2 of A. pisum (AY96858, XM_001950388), with four pairs of primers as reference primers accordingly (Mutti et al., Reference Mutti, Park, Reese and Reeck2006; Ma et al., Reference Ma, Sun, Zhang, Li and Shen2010; Yang et al., Reference Yang, Pan, Liu and Zhou2014; Kang et al., Reference Kang, Liu, Tian, Zhang, Guo and Liu2017) (table 1). The specificity of primers was verified by PCR in a total reaction volume of 25 µl containing 2 µl cDNA template, 1 µl of each primer (10 µM), 2.5 µl 10 × PCR buffer (TransGen Biotech, Beijing, China), 2 µl dNTP (2.5 mM), 0.5 µl Taq DNA polymerase (5.0 U µl−1) and 16 µl ddH2O. The reaction conditions were 94 °C for 5 min, 35 cycles of 94 °C for 30 s, 60 °C for 30 s, 72 °C for 30 s and a final 10 min extension at 72 °C. PCR products were analyzed by 1% agarose gel electrophoresis.
Table 1. Primers sets for qRT-PCR.
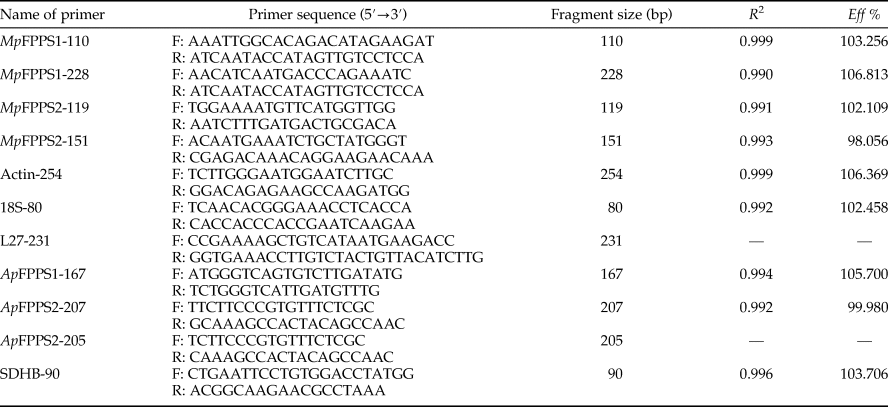
R 2, correlation coefficient; Eff %, amplification efficiency.
For qRT-PCR, the cDNA was successively diluted for 40, 41, 42, 43 and 44 times as templates, and the quality of primers was judged by the standard curve and melting curve. A technically qualified pair of primers for relative quantification should ensure that both the correlation coefficient and amplification efficiency of the standard curve are within the reference range (R 2 > 0.99; 90% < E < 110%) and the melting curve is unimodal (Livak & Schmittgen, Reference Livak and Schmittgen2001; Pfaffl, Reference Pfaffl2001). The reaction was performed in a total volume of 20 µl containing 10 µl AceQ® qPCR SYBR® Green Master Mix (Vazyme, Nanjing, China), 0.4 µl of each primer (10 µM), 1 µl cDNA and 8.2 µl ddH2O. Because the expression level of ApFPPS2 was excessively low, the amount of cDNA was increased to 4 µl. The thermocycling program was 50 °C for 2 min, 95 °C for 5 min, 40 cycles of 95 °C for 10 s, 60 °C for 30 s and the conditions for melting curve stage were 95 °C for 15 s, 60 °C for 60 s and 95 °C for 15 s. All samples were assayed in triplicate on an ABI 7500 ver. 2.0.6. The relative expressions of target genes were calculated by the formula ![]() $2^{-\Delta \Delta C_{\rm t}}$ (Livak & Schmittgen, Reference Livak and Schmittgen2001), where ΔΔC t = (
$2^{-\Delta \Delta C_{\rm t}}$ (Livak & Schmittgen, Reference Livak and Schmittgen2001), where ΔΔC t = (![]() $C_{t_{{\rm target}}}\ndash C_{t_{{\rm reference}}}$)treatment − (
$C_{t_{{\rm target}}}\ndash C_{t_{{\rm reference}}}$)treatment − (![]() $C_{t_{{\rm target}}}\ndash C_{t_{{\rm reference}}}$)control. Three biological repetitions were conducted.
$C_{t_{{\rm target}}}\ndash C_{t_{{\rm reference}}}$)control. Three biological repetitions were conducted.
Quantitative analysis of EβF in M. persicae
M. persicae aphids of different developmental stages were carefully transferred with a soft brush from pepper plants to 1.5 ml centrifuge tubes for counting or weighing before analysis of EβF. A total of 350, 350, 150, 50, 36 and 30 individuals for the embryo, 1st- to 4th-instar and adults were used, respectively. The individuals of similar size were selected on the 2nd day of each stage to eliminate the bias caused by body size. The sampling method was modified slightly from van Emden et al. (Reference van Emden, Dingley, Dewhirst, Pickett, Woodcock and Wadhams2014). Briefly, hexane (50 µl, with 0.005 µl undecane as the internal standard) was added to a 1.5 ml centrifuge tube and the aphids were fully crushed with a sealed plastic pipette tip, which was then centrifuged at 12 000 rpm for 5 min. Prior to analysis, the samples were stored at −20 °C for no more than 3 days. For GC-MS analysis, 30 µl supernatant without residues was transferred to a 2 ml glass chromatography vial with a 250 µl polypropylene intubation with polyurethane foot. A synthetic farnesene solution was diluted 200 times with hexane and used as the standard. The solvent extract (2 µl) and farnesene standard (2 µl) were analyzed, respectively, by Agilent 7890B/7200 (HP-5MS, 30 m × 0.25 mm inner diameter × 0.25 µm film thickness) with a low-pole column under the conditions reported by van Emden et al. (Reference van Emden, Dingley, Dewhirst, Pickett, Woodcock and Wadhams2014). The carrier gas was helium with a split ratio of 2:1 and mass spectra were obtained in the EI mode at 70 eV. The volatile substance was analyzed by Varian Saturn 2100D using NIST spectrum database and compared with farnesene standard. Three biological repetitions were conducted for each developmental stage. The measured amounts of EβF were corrected by the number of individuals or the mean weight per aphid (mg).
Data analysis
The gene expression in different tissues and EβF measurement data were sorted on Microsoft Excel and analyzed by using the Least Significant Difference (LSD) multiple comparison methods of one-way ANOVA and independent sample t test at 5% and 1% levels on SPSS v.21.0 software; the expression levels during developmental stages were analyzed by using Tukey's test, with the expression level of MpFPPS1 at apterous adult stage as the control. Association analyses were performed by linear regression on Excel.
Results
Optimization of qRT-PCR conditions and spatiotemporal expression profiling of MpFPPS1/2 in M. persicae
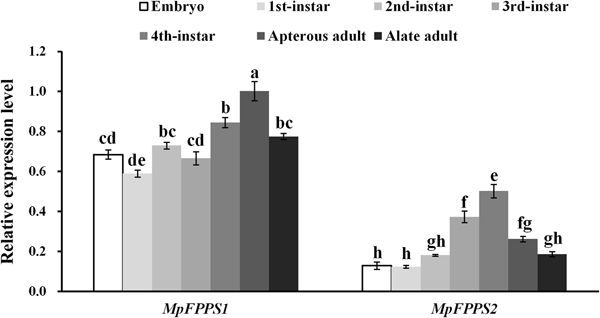
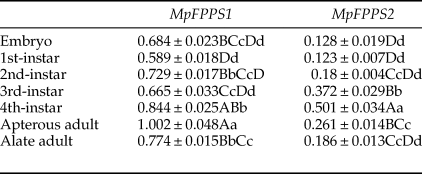
Totally seven pairs of primers (four FPPS genes and three reference genes) were checked. According to gel electrophoresis, the standard and melting curves, correlation coefficients (R 2) and amplification efficiencies (Eff %) (table 1), the primers MpFPPS1-110, MpFPPS2-119, Actin and 18S were selected for expression analysis of MpFPPS genes. Similarly, four pairs of primers (three FPPS genes and one reference gene) were checked for A. pisum, and the primers ApFPPS1-167 and ApFPPS2-207 were selected for expression analysis of ApFPPS genes. The reference gene as an internal control is very important for the quantitative analysis of the target gene. A qualified reference gene should be stably expressed in all tissues or at different developmental stages (Livak & Schmittgen, Reference Livak and Schmittgen2001). The actin gene is commonly used as an internal standard for qRT-PCR analysis (Ma et al., Reference Ma, Sun, Zhang, Li and Shen2010), and our analysis showed that it was expressed steadily during different developmental stages of M. persicae. We thus used actin as the reference gene for temporal expression analysis of MpFPPS1/2. The results showed that both MpFPPS1 and MpFPPS2 were expressed across the whole developmental period (fig. 1). Specifically, they were expressed uninterruptedly from the embryonic stage to adult stage, but MpFPPS1 exhibited an overall significantly higher expression than MpFPPS2 (P = 0.007). The expression levels of MpFPPS1 were higher than those of MpFPPS2 by 4.3-, 3.8-, 3.1-, 0.8-, 0.7-, 2.8- and 3.2-fold at the embryo, 1st- to 4th-instar, wingless and winged adult stages, respectively, reaching the highest at apterous adult stage, significantly higher than all other stages (P = 0.032) (table 2). In contrast, the expression of MpFPPS2 showed an increasing trend from the embryo and the 1st-instar to the 3rd-instar, and reached the peak at the 4th-instar stage, significantly higher than all other stages (P = 0.026); thereafter, its expression dramatically dropped at the adult stage (fig. 1; table 2).
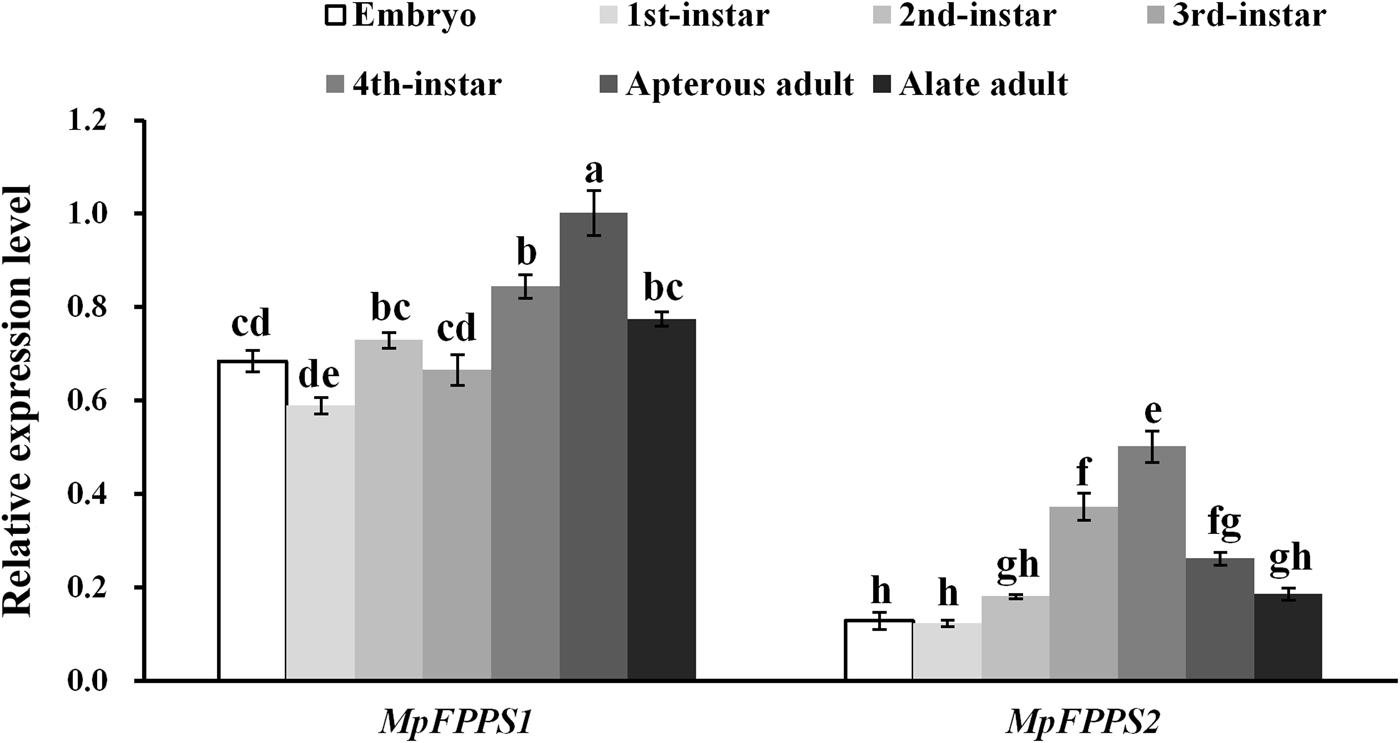
Fig. 1. Expression analysis of MpFPPS1 and MpFPPS2 at different developmental stages of M. persicae. Different lowercase letters on the bars indicate a significant difference in the expression level of MpFPPS1/2 between different stages at 5% level by using Tukey's multiple comparison methods. The alphabetical order corresponds to decreasing expression level. The same letters indicate no significant difference at 5% or 1% levels.
Table 2. Expression analysis of MpFPPS1/2 at different developmental stages of M. persicae.
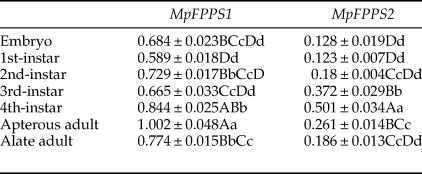
Data are mean ± S.E. (n = 3). Different lower and uppercase letters within the same column indicate a significant difference in the expression level of MpFPPS1/2 at 5% and 1% levels, respectively, by using Tukey's multiple comparison methods. The alphabetical order corresponds to decreasing expression level. The same letters indicate no significant difference at 5% or 1% levels.
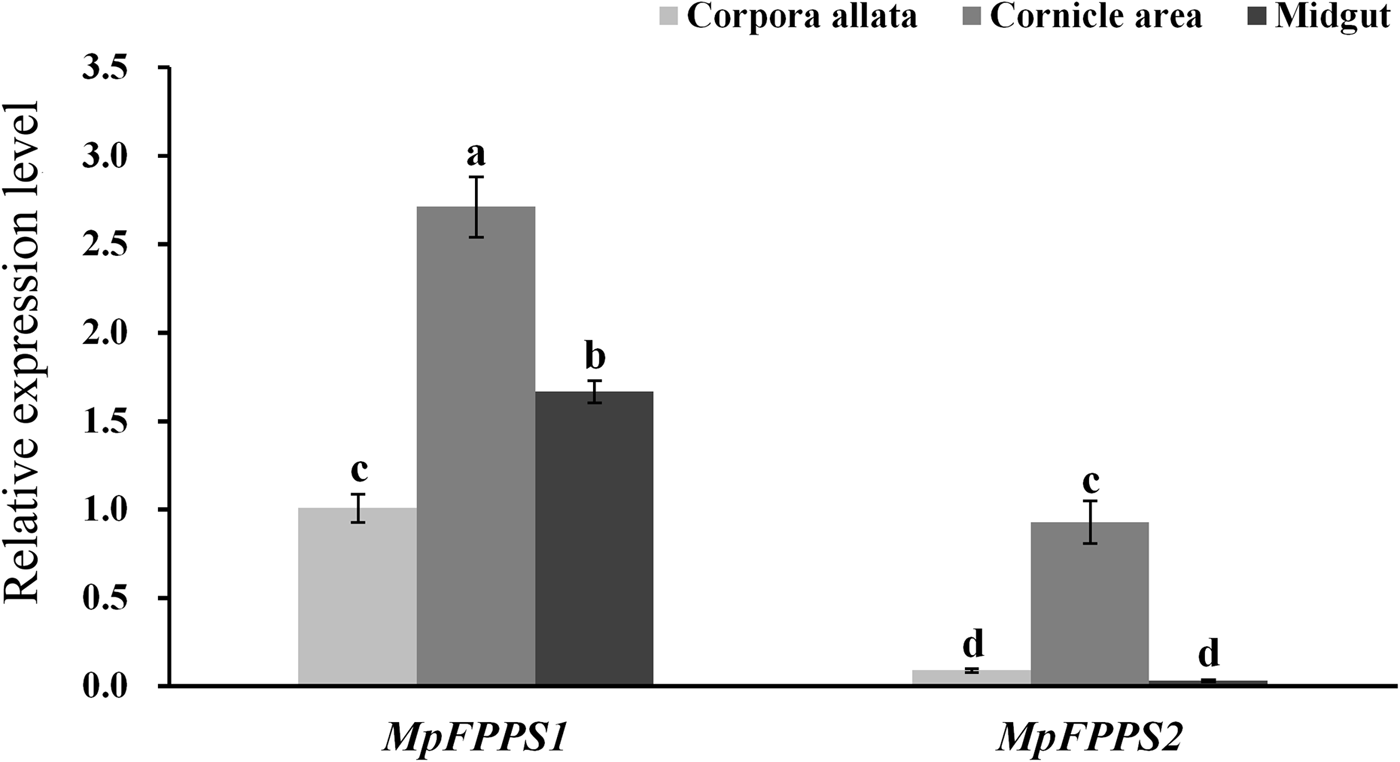
Based on the temporal expression analysis of MpFPPS1/2 and for the convenience of tissue dissection, the apterous adults were used for tissue expression analysis. When actin was used as the internal control, the results showed that MpFPPS1 had the highest expression in the midgut, followed by in the cornicle area, with the lowest in the CA. The transcript abundance of MpFPPS1 was more than 100 times higher in the midgut than in the CA (supplementary fig. 2). In comparison, MpFPPS2 showed approximately sevenfold higher expression in the cornicle area and midgut than in the CA. However, actin was found expressed inconsistently in different tissues (Supplementary fig. 3), implying that it is unsuitable for being used as an internal reference for tissue-specific expression analysis. Therefore, we tried the 18S gene reported by Kang et al. (Reference Kang, Liu, Tian, Zhang, Guo and Liu2017) for M. persicae. The results demonstrated that 18S was expressed steadily in different tissues (supplementary fig. 3). With 18S as the internal control, expression analysis showed that both MpFPPS1 and MpFPPS2 had the highest expression level in the cornicle area, and the overall expression of MpFPPS1 was remarkably higher than that of MpFPPS2 (fig. 2). More specifically, there was a significant difference in the expression of MpFPPS1 between different tissues (P = 0.003), with the lowest observed in the CA. Similarly, MpFPPS2 had approximately ninefold and 27-fold higher expression in the cornicle area than in the CA and midgut, respectively (P < 0.001), and there was no significant difference between CA and midgut (fig. 2).
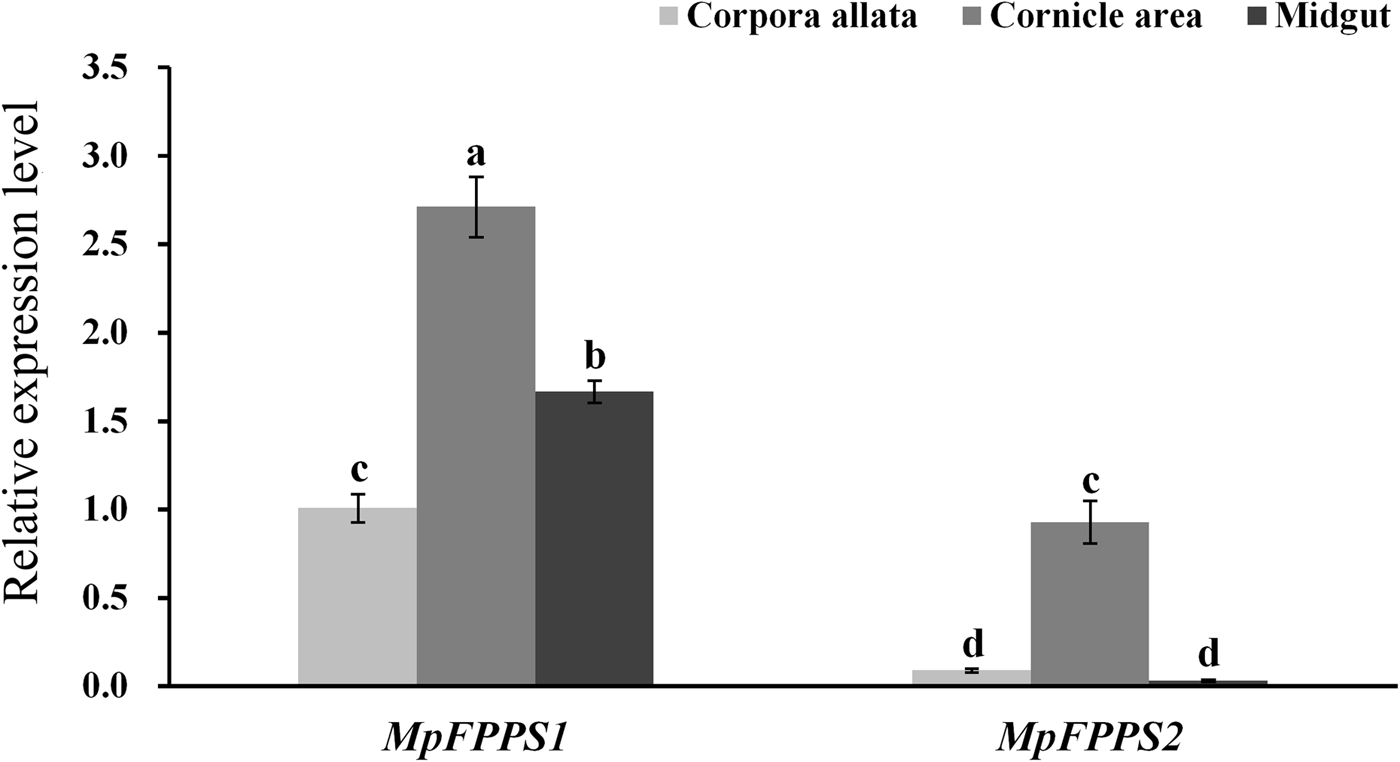
Fig. 2. Expression analysis of MpFPPS1 and MpFPPS2 in different tissues of the apterous M. persicae adults with 18S gene as the internal control. Different lowercase letters on the bars indicate a significant difference in the expression level of MpFPPS1/2 between different tissues at 5% level by using LSD multiple comparison methods. The alphabetical order corresponds to decreasing expression level. The same letters indicate no significant difference at 5% or 1% levels.
Spatiotemporal expression analysis of FPPS genes in A. pisum
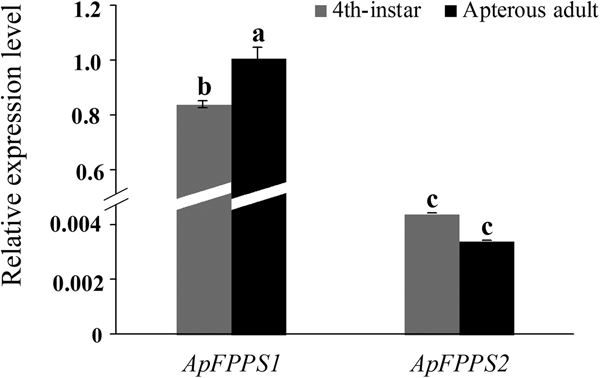
Phylogenetic analysis based on FPPS amino acid sequences showed that A. pisum and M. persicae are closely related aphid species (Ma et al., Reference Ma, Sun, Zhang, Li and Shen2010). Here A. pisum was used to verify the FPPS expression patterns observed in M. persicae. Since MpFPPS1 and MpFPPS2 had the highest expression in the 4th-instar and apterous adult stages, these two stages were used for expression analysis of ApFPPS1/2 in A. pisum. The SDHB gene was reported to be a suitable internal reference for A. pisum (Yang et al., Reference Yang, Pan, Liu and Zhou2014) and we confirmed its validity (supplementary fig. 4). Our qRT-PCR results showed that ApFPPS1 had a significant lower expression at the 4th-instar stage than at apterous adult stage (P = 0.038), but there was no significant difference in the expression of ApFPPS2 between these two stages (P = 0.146). Like MpFPPS1, ApFPPS1 showed significantly higher overall expression than ApFPPS2 during the two developmental stages (P < 0.001) (fig. 3).

Fig. 3. Expression analysis of ApFPPS1 and ApFPPS2 at the 4th-instar and apterous adult stages of A. pisum. Different lowercase on the bars indicates a significant difference in the expression level of ApFPPS1/2 between different stages at 5% level by using LSD multiple comparison methods. The alphabetical order corresponds to decreasing expression level. The same letters indicate no significant difference at 5% or 1% levels.
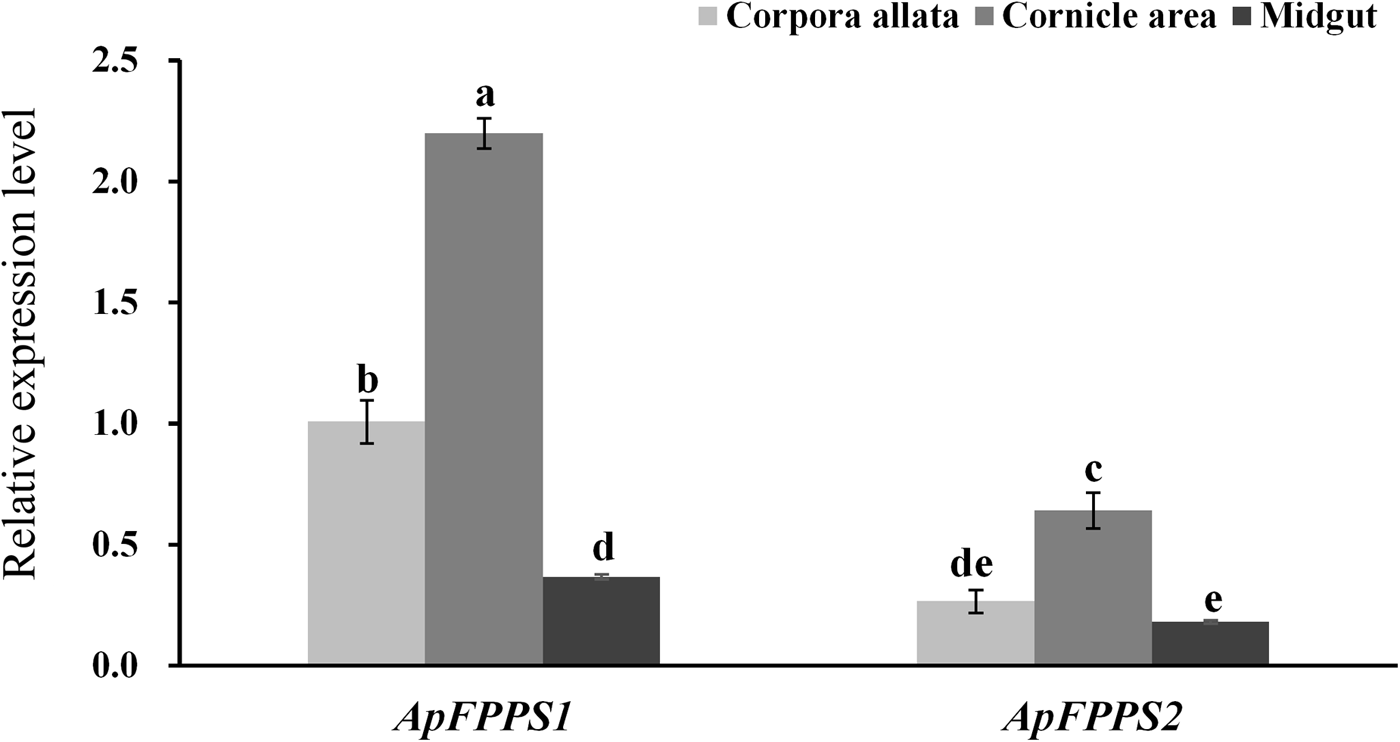
In tissue expression analysis, the CA, cornicle and midgut were dissected from apterous A. pisum adults. The results showed that both ApFPPS1 and ApFPPS2 were expressed significantly higher in the cornicle area. More specifically, the expression level of ApFPPS1 was significantly different between the tissues (P < 0.01), with the least in the midgut, but ApFPPS2 exhibited no significant expression between the CA and midgut (P = 0.37) (fig. 4).

Fig. 4. Expression analysis of ApFPPS1 and ApFPPS2 in different tissues of A. pisum. Different lowercase letters on the bars indicate a significant difference in the expression level of ApFPPS1/2 between different tissues at 5% level by using LSD multiple comparison methods. The alphabetical order corresponds to decreasing expression level. The same letters indicate no significant difference at 5% or 1% levels.
Quantitative analysis of EβF in the aphid
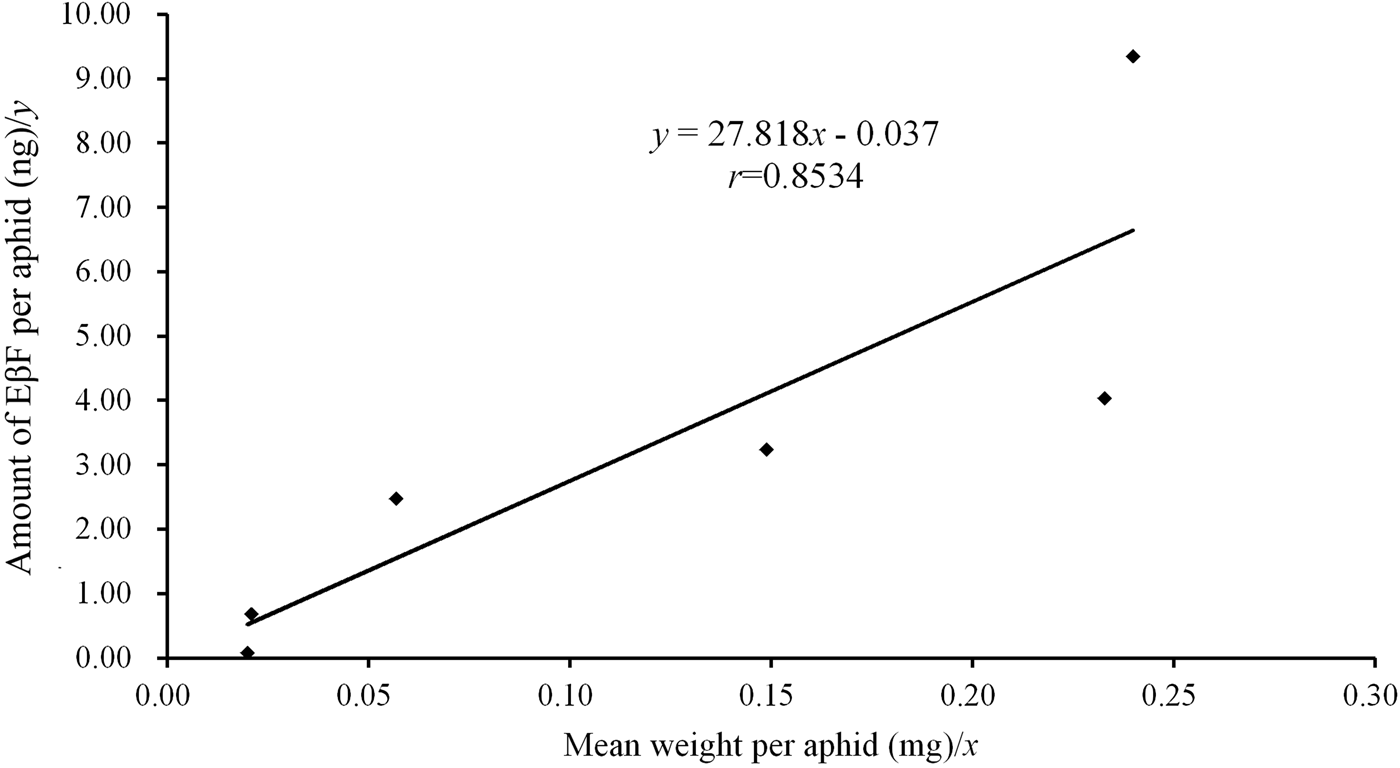
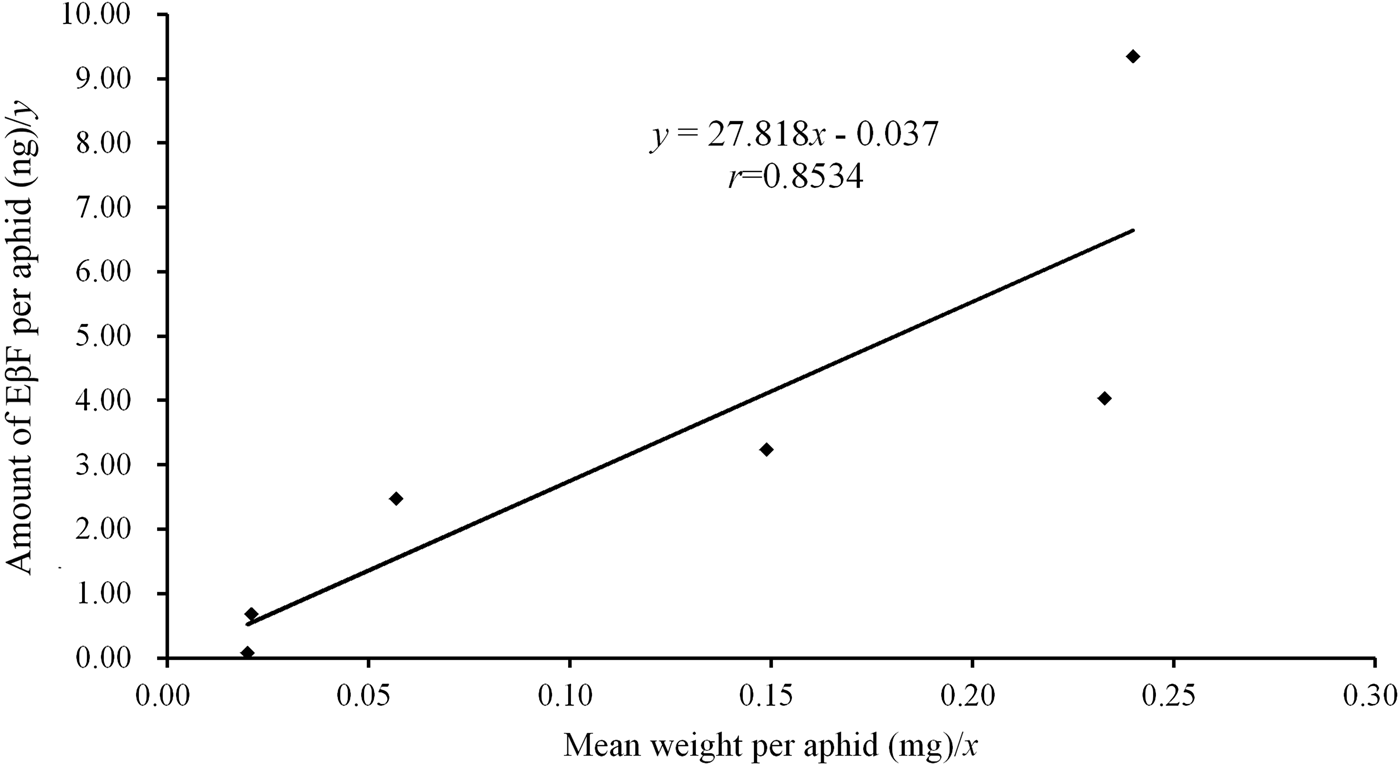
Since both MpFPPS and ApFPPS genes showed significantly higher expression in the cornicle area and the cornicle is the organ for secretion of aphid alarm pheromone, we thus speculated that FPPS genes should be closely related to the biosynthesis of EβF. Therefore, we conducted a quantitative measurement of EβF emitted by M. persicae by using GC-MS. We measured the content of EβF per aphid and the concentration of EβF per milligram of aphid. The retention time of EβF was 20.784 min and the characteristic ions were 69, 93, 105, 120, 133 and 161 (supplementary fig. 5). Quantitative analyses showed that, with the growth of M. persicae, the average weight of aphid significantly increased from 1st- to 4th-instar, but there were no significant differences between embryo and 1st-instar and between 4th-instar and apterous adult (table 3). Accordingly, the content of EβF per aphid showed an obvious increasing trend from embryo to adult: the content of EβF per aphid (y) was significantly correlated with the average weight per aphid (x), with the linear regression equation as followed: y = 27.82x − 0.037 (r = 0.8534, P = 0.0307); the content of EβF had a dramatic leap from the lowest level (0.072 ± 0.001 ng) at embryonic stage to 1st-instar stage. Thereafter, the content of EβF per aphid rose steadily to the highest (9.339 ± 0.094 ng) at the adult stage. Nevertheless, when measured by weight, the concentration of EβF per mg of aphid fluctuated drastically during different stages (r = 0.1212, P = 0.8191) (fig. 5). Two peaks were seen at the 2nd-instar and adult stages, but a valley was observed at 4th-instar stage (table 3).
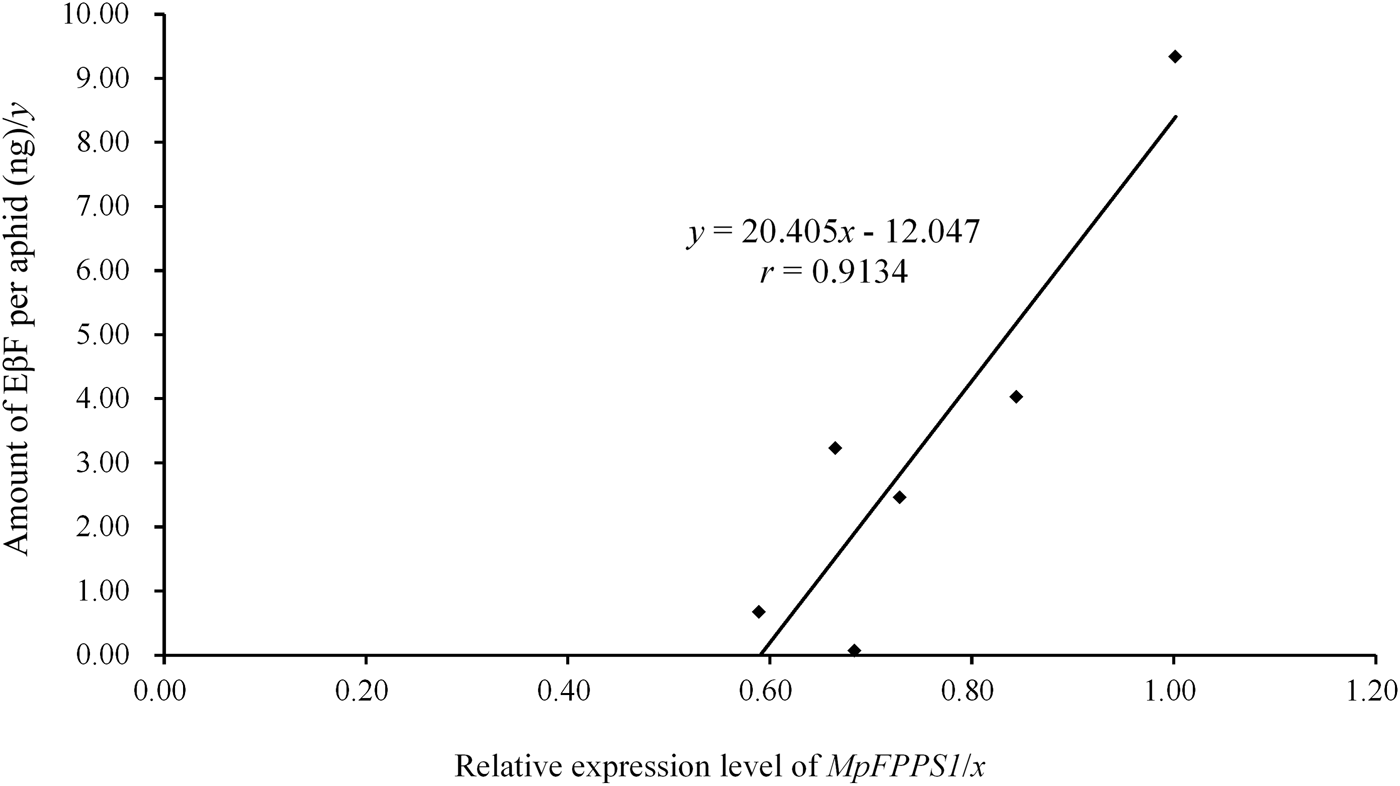
Fig. 5. Association analysis between the amount of EβF per aphid and the mean weight per aphid. Refer the data to table 3.
Table 3. Quantitative analysis of EβF in the green peach aphid M. persicae during different developmental stages.

Data are mean ± S.E. (n = 3). Different lower and uppercase letters within the same column indicate a significant difference in the average weight, amount of EβF per aphid or amount of EβF per mg of aphid at 5% and 1% levels, respectively, by using LSD multiple comparison methods. The alphabetical order corresponds to decreasing weight or amount. The same letters indicate no significant difference at 5% or 1% levels.
Association analysis
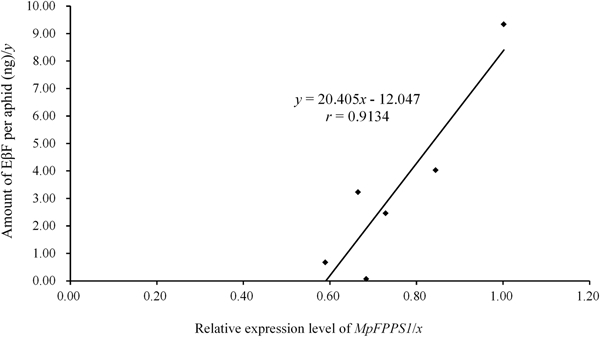
The expression data of MpFPPS genes (table 2) were used to perform an association analysis with the quantitative data of EβF per aphid during different developmental stages (table 3). The regression analyses revealed that there was a significant correlation between the amount of EβF per aphid (y) and the expression level of Mp FPPS1 (x), with the regression equation as followed: y = 20.405x − 12.047 (r = 0.9134, P = 0.0109) (fig. 6). In contrast, there was no significant correlation between the amount of EβF per aphid and the expression level of Mp FPPS2 (r = 0.4113, P = 0.4179). In addition, the concentration of EβF per mg of aphid was neither correlated with the mean weight per aphid (r = 0.1212, P = 0.8191) nor with the expression level of MpFPPS1 (r = 0.2553, P = 0.62532) or MpFPPS2 (r = 0.1728, P = 0.7434).
Discussion
The alarm behavior plays a key role in the ecology of aphids, but the site and molecular mechanism for the biosynthesis of aphid alarm pheromone (EβF) are largely unknown up to now. In the present study, the spatiotemporal expression analyses of the two FPPS genes in M. persicae and A. pisum suggested that FPPS1 may play a more important role than FPPS2 in aphids and the cornicle area is most likely the site for EβF biosynthesis; association analysis between the amounts of EβF and the expression levels of FPPS genes indicated that FPPS1 is very likely involved in the biosynthesis of aphid alarm pheromone. Taken together, these data suggest that FPPS1 may play a key role in the biosynthesis of EβF in the aphid.
Since the possibility of the host plant and endosymbionts as the sources of EβF in aphids has recently been eliminated (Sun & Li, Reference Sun and Li2017), it is thus postulated that the genes in the isoprenoid biosynthetic pathway are responsible for the synthesis of EβF in the aphid. Considering FPPS catalyzes the synthesis of FPP and theoretically, FPP is the precursor for biosynthesis of EβF, the FPPS gene should be closely correlated to the pathway leading to the production of EβF in aphids. We thus examined the spatiotemporal expression of the two FPPS genes in two important agricultural aphid species. M. persicae and A. pisum are two phylogenetically close aphid species based on FPPS sequences, implying that the spatiotemporal expression data obtained from one species can be corroborated with the data achieved from the other. Our results clearly demonstrated that the overall expression level of FPPS1 was significantly higher than that of FPPS2, although both of them were expressed extensively in all stages and tissues. Moreover, the expression patterns of the two genes were roughly similar during different developmental stages and in different tissues. According to these experimental results, it is speculated that the physiological functions of FPPS1 and FPPS2 may be similar, but the contributions of FPPS1 is hopefully greater than FPPS2. A possible explanation for this phenomenon might be that FPPS2 is undergoing an evolutionary degeneration as observed in the cotton aphid A. gossypii which contains only one FPPS gene in its genome (Ma et al., Reference Ma, Sun, Zhang, Li and Shen2010).
The only spatiotemporal expression analysis of FPPS gene that has been reported in the aphid was from A. gossypii (Ma et al., Reference Ma, Sun, Zhang, Li and Shen2010), where the stage-specific expression pattern of AgFPPS was generally consistent with that of MpFPPS1 except the alate adult stage, but the tissue-specific expression patterns were different between the two aphids, as the expression level of AgFPPS was significantly higher in the CA than in other tissues. Similarly, the highest expression of FPPS gene was observed in CA in other insect species such as A. ypsilon, Diploptera punctata and Leptinotarsa decemineata (Castillo-Gracia & Couillaud, Reference Castillo-Gracia and Couillaud1999; Huang et al., Reference Huang, Marchal, Hult and Tobe2015; Li et al., Reference Li, Meng, Lu, Guo and Li2016). This is obviously different from the tissue-specific expression pattern of M. persicae and A. pisum FPPS1/2 with far more expression in the cornicle area. This distinct variation might be resulted from at least two possible reasons: one is that the FPPS genes of the other examined insects are mainly responsible for providing the precursor for JH biosynthesis in CA; another reason may be that most aphids produce EβF as the major component of alarm pheromone in the cornicle area. In fact, the level of EβF in A. gossypii was very low (Byers, Reference Byers2005). Our results also showed that the expression of MpFPPS1/2 was higher in wingless adults than in winged adults. There were two possible explanations for this: (a) the reproduction of insects is regulated by JH (Truman & Riddiford, Reference Truman and Riddiford2002) and winged adults have lower fecundity (Kaitala, Reference Kaitala1991; Dixon & Agarwala, Reference Dixon and Agarwala1999), so the overall gene expression remains at a low level; (b) winged aphids are more active, making them easier to avoid predation and thus need less EβF.
A detailed electron microscopic observations on the cornicles of the rose aphid Macrosiphum rosae was described more than four decades ago (Edwards, Reference Edwards1966; Chen & Edwards, Reference Chen and Edwards1972). The aphid was readily induced by mechanical stimuli to release waxy droplets containing triglyceride and volatile alarm pheromone (EβF) from a pore at the tip of the cornicle. It was proposed that the waxy droplet arises from the cornicle secretory cells (CSC) which may be modified oenocytes. The CSCs are in a separate compartment like a detached sac, distinct from fat body cells in location and structure (Chen & Edwards, Reference Chen and Edwards1972). Nevertheless, up to now, no biochemical and molecular evidences have been provided to support the proposition that EβF is biologically synthesized in the CSC sac. Our spatiotemporal expression analysis in two aphid species demonstrated that there was an excessively higher expression of both FPPS1 and FPPS2 in the cornicle area of the aphids, suggesting that FPPS genes are very likely involved in the biosynthesis of EβF. This is the first molecular evidence relating FPPS to the biosynthesis of aphid alarm pheromone.
The content of EβF per aphid increased steadily from embryo and 1st-instar to the adult stage with the growth of aphids, but when measured by weight, the concentration of EβF per mg of aphid fluctuated dramatically during different developmental stages (table 3). The amount of EβF per aphid represents the cumulative content of EβF in the body of aphid. The sharp increase in the content of EβF from embryo to 1st-instar stage suggests that the 1st-instar stage, as a turning point in aphid development, is a critical stage for EβF biosynthesis. Considering that the newly-born aphids have to face the dangerous environment independently, it is comprehensible that they will quickly synthesize a large amount of EβF to adapt to the environment. If not released or degraded, the EβF accumulated in aphids will naturally increase with the increase of aphid age and size. On the other hand, the amount of EβF per mg of aphid represents the concentration of EβF in the aphid body. Our studies found that, unlike the rising trend in the content of EβF during the whole developmental process, two peaks of concentration were observed at the 2nd-instar and adult stages, and a valley appeared at the 4th-instar stage. This dramatic fluctuation in the concentration of EβF suggests that the biosynthesis of EβF in the aphid must have been affected by a variety of internal and external factors. Normally, when left undisturbed (without being attacked by predators), aphids keep releasing a small amount of EβF for detection of the population density (Almohamad et al., Reference Almohamad, Verheggen, Francis, Lognay and Haubruge2009; Verheggen et al., Reference Verheggen, Haubruge, Moraes and Mescher2009); if attacked by predators, the aphids will suddenly release a large amount of EβF for defense purpose. Under the controlled laboratory conditions, the aphids will normally not disturbed by predators, and therefore the variation in the concentration of EβF may reflect the change in the aphid's physiological status. For instance, the sudden drop in the concentration of EβF at the 4th-instar stage may be caused by the need for saving more energy for embryonic development. Up to date, quantitative measurement of EβF as per weight or direct counting was only reported in A. gossypii (Byers, Reference Byers2005), where the content of EβF per aphid increased with the weight of aphid and the content of EβF at the 1st-instar stage was much less than that in adults, which was consistent with our results; yet, the concentration of EβF was reported to decline with increasing weight. Obviously, the mechanism how the concentration of EβF is regulated in the aphid needs further studies.
The significant correlation between the amount of EβF per aphid and the expression level of FPPS1 gene indicates the close association of FPPS1 with the biosynthesis of EβF, but the non-significant relation between the amount of EβF and the expression level of FPPS2 gene does not necessarily deny the involvement of FPPS2 in the production of EβF, as the biosynthesis of EβF is inherently regulated by a complex of effectors, including the enzymes responsible for the synthesis and degradation of EβF, the effectors controlling the signaling pathway of alarm pheromone and the release of waxy droplets. Similarly, there is an inherent tissue-dependent bias in the association analysis between the amount of EβF per mg aphid (ng) and the expression level of MpFPPS1 gene during different developmental stages, since the expression levels were not measured specifically in the cornicle area (table 2).
FPPS catalyzes the synthesis of FPP, the precursor for EβF biosynthesis, and essentially, the FPPS genes are indispensable if the alarm pheromone is the product of the aphid's biosynthetic machinery. Moreover, FPPS also provides the precursor for the biosynthesis of JH, one of the key hormones in relation to the metamorphic development of aphids. Different from JH that plays a critical physiological role in the aphid, EβF is largely implicated in the ecological interactions, and therefore the release and thus the biosynthesis of EβF are to a great extent regulated by environmental factors. This might explain why the concentration of EβF in aphids fluctuates so drastically.
Conclusions
Based on the spatiotemporal expression data of the FPPS genes in M. persicae and A. pisum, it is postulated that: (i) FPPS1 may play a greater role than FPPS2 in aphids, and the latter seems to be undergoing an evolutionary process of degradation, while both FPPS1 and FPPS2 may have similar physiological functions; (ii) the cornicle area is most likely the site for EβF biosynthesis. Association analyses suggest that FPPS1 may play a major role in the biosynthesis of aphid alarm pheromone, although the role of FPPS2 cannot be eliminated. The biosynthetic pathway of EβF is inherently regulated by a complex of effectors and further studies should be focused on in vivo functional characterization of FPPS genes and other genes directly involved in EβF biosynthesis. Transcriptome and functional analysis via RNA interference is useful in this line of work.
Supplementary material
The supplementary material for this article can be found at https://doi.org/10.1017/S0007485318000706.
Acknowledgements
The authors are very grateful to Dr Gui-Rong Wang (Institute of Plant Protection, Chinese Academy of Agricultural Sciences, Beijing, China) for providing the starting stock of the pea aphid Acyrthosiphon pisum and to Professor Zhong-Ning Zhang (the Group of Chemical Ecology of Forest Insects, Institute of Zoology, Chinese Academy of Sciences) for providing the standard farnesene solution. This work is supported by the National Science Foundation of China (Grant nos. 31371940 and 31772169).


