


Introduction
The understanding of intraspecific variation, both within and among populations, possesses a central importance in the evolution of populations and species. Population structure can be determined by evolutionary processes, mainly natural selection, genetic drift and gene flow, apart from environmental and ecological factors (Endler, Reference Endler1973, Reference Endler1977; Storz, Reference Storz2002; Seymour et al., Reference Seymour, Räsänen and Kristjánsson2019).
Insect species, especially those with a wide geographic distribution, usually exhibit considerable intraspecific molecular and body size variation, providing an appropriate model to study the relative contribution of stochastic and adaptive processes on population divergence. When a species like this is also chromosomally polymorphic it is a bonus, since it allows us to examine population structure at chromosomal, genotypic and phenotypic levels at once (Hewitt, Reference Hewitt1979; Blanckenhorn and Demont, Reference Blanckenhorn and Demont2004; Blackmon et al., Reference Blackmon, Ross and Bachtrog2017; Hoy, Reference Hoy and Hoy2019).
Molecular markers can provide valuable information to estimate genetic diversity, effective migration (gene flow) and to understand both historic and contemporary population dynamics, providing new insights into the ecology and evolution of species (Kirk and Freeland, Reference Kirk and Freeland2011; Hoy, Reference Hoy and Hoy2019). Nuclear molecular markers, such as microsatellites and single-nucleotide polymorphisms, constitute null models of contemporary structure to test the adaptive significance of other traits (Roff and Mousseau, Reference Roff and Mousseau2005; Leinonen et al., Reference Leinonen, O'Hara, Cano and Merilä2008).
Similarly, the analysis of chromosomal intraspecific variation in chromosomally polymorphic species allows a better understanding of genomic structure evolution. Latitudinal clines for large chromosome rearrangements (i.e. inversions and centric fusions) are widespread and may have a major impact on evolutionary change in natural populations (i.e. Fouet et al., Reference Fouet, Gray, Besansky and Costantini2012; Taffarel et al., Reference Taffarel, Bidau and Martí2015; Kapun and Flatt, Reference Kapun and Flatt2018). Several examples of these chromosomal clinal patterns showed significant association with body size-related traits, developmental time and thermal tolerance advocating the adaptive significance of chromosome polymorphism (Fouet et al., Reference Fouet, Gray, Besansky and Costantini2012; Adrion et al., Reference Adrion, Hahn and Cooper2015; Kirkpatrick, Reference Kirkpatrick2017).
Both theoretical models and empiric data support that these chromosome rearrangement polymorphisms can be established and selectively maintained because they capture combinations of alleles that are beneficial to particular environmental variables (coadaptation model) (Dobzhansky, Reference Dobzhansky1970; Charlesworth and Charlesworth, Reference Charlesworth and Charlesworth1973; Schaeffer et al., Reference Schaeffer, Goetting-Minesky, Kovacevic, Peoples, Graybill, Miller, Kim, Nelson and Anderson2003; Charlesworth, Reference Charlesworth2015; Kapun and Flatt, Reference Kapun and Flatt2018); alternatively, under a migration–selection interaction model, the rearrangements may capture two or more locally adapted loci that are in initial linkage disequilibrium (local adaptation model) (Kirkpatrick and Barton, Reference Kirkpatrick and Barton2006; Guerrero and Kirkpatrick, Reference Guerrero and Kirkpatrick2014; Charlesworth and Barton, Reference Charlesworth and Barton2018). However, most of the well-documented examples correspond to inversion polymorphisms in genus Drosophila and other dipteran species, and therefore the role of centric fusions in evolution remains scarcely documented (Guerrero and Kirkpatrick, Reference Guerrero and Kirkpatrick2014).
It is accepted that body size-related traits have ecological and evolutionary significance because of their purported association with life history and fitness, including growth rate, survival and reproductive ability (Roff and Mousseau, Reference Roff and Mousseau2005; Whitman, Reference Whitman2008; Matthews et al., Reference Matthews, Narwani, Hausch, Nonaka, Peter, Yamamichi, Sullam, Bird, Thomas, Hanley, T.C. and Turner2011; Hausch et al., Reference Hausch, Shurin and Matthews2013). A great deal of studies examined clinal patterns of differentiation with respect to climatic (such as temperature and rainfall) and/or geographic variables (mainly latitude and altitude) because they may suggest environmental constraints and possible local adaptations (Endler, Reference Endler1977; Stearns, Reference Stearns1992; Berner and Blanckenhorn, Reference Berner and Blanckenhorn2006; Huizenga et al., Reference Huizenga, Shaidle, Brinton, Gore, Ebo, Solliday, Buguey, Whitman and Juliano2008; Whitman, Reference Whitman2008; Bidau et al., Reference Bidau, Miño, Castillo and Martí2012; Savolainen et al., Reference Savolainen, Lascoux and Merilä2013). In several of these examples, the detected relationships do not pinpoint the selective agent per se, but they may identify correlated characters that provide indirect evidence of natural selection in the wild (Roff and Mousseau, Reference Roff and Mousseau2005).
Nevertheless, clinal variation may also be the by-product of both the interactions between genetic drift and gene flow, and phenotypic plasticity in response to a change in the environment (Stearns, Reference Stearns1992; Berner and Blanckenhorn, Reference Berner and Blanckenhorn2006; Huizenga et al., Reference Huizenga, Shaidle, Brinton, Gore, Ebo, Solliday, Buguey, Whitman and Juliano2008).
Several approaches have been developed to elucidate whether both chromosomal and body size variability, as well as population differentiation, are either influenced by selective or by non-selective processes. In the last few decades, several advances were developed to distinguish the levels of population differentiation at potentially adaptive traits with respect to neutral DNA marker variation (Roff and Mousseau, Reference Roff and Mousseau2005; Leinonen et al., Reference Leinonen, O'Hara, Cano and Merilä2008; Whitlock, Reference Whitlock2008; Ayala et al., Reference Ayala, Fontaine, Cohuet, Fontenille, Vitalis and Simard2011; Ortego et al., Reference Ortego, Aguirre and Cordero2012; Rosetti and Remis, Reference Rosetti and Remis2013; Blanckenhorn et al., Reference Blanckenhorn, Bauerfeind, Berger, Davidowitz, Fox, Guillaume, Nakamura, Nishimura, Sasaki, Stillwell, Tachi and Schäfer2018). If traits were to evolve neutrally, the proportion of their variation among populations should be on average comparable to the proportion of among-population variation in allele frequencies at neutral loci.
In this line, some models would detect natural stabilizing – or directional – selection acting on morphometric traits by comparing the divergence for assumed neutral molecular markers (F ST) and that associated with quantitative traits (Q ST/P ST) (Spitze, Reference Spitze1993; Storz, Reference Storz2002; Chapuis et al., Reference Chapuis, Lecoq, Michalakis, Loiseau, Sword, Piry and Estoup2008; Martin et al., Reference Martin, Chapuis and Goudet2008; Brommer, Reference Brommer2011; Leinonen et al., Reference Leinonen, Mccairns, O'Hara and Merilä2013). Moreover, Guillot et al. (Reference Guillot, Renaud, Ledevin, Michaux and Claude2012) proposed a statistical model that allows the inclusion of information from spatial distribution, more explicitly related to observed geographic patterns, and the analysed genetic and/or phenotypic data by means of Bayesian tools, thus adding another comparative approach to the detection of natural selection on environment-related traits.
Among other insect taxa, the Neotropical grasshopper Cornops aquaticum (Bruner Reference Bruner1906) constitutes an appropriate model to assess variability in body size traits and karyotype in the context of differentiation and adaptation of insect populations because it occurs over a wide latitudinal range between Southern Mexico (23°N) and Uruguay and Central Argentina (35°S) (Adis et al., Reference Adis, Bustorf, Lhano, Amedegnato and Nunes2007). This semiaquatic grasshopper feeds and lay eggs specifically on aquatic Pontederiaceae plants, mainly on the water hyacinth Pontederia (formerly Eichhornia) crassipes. Based on molecular and morphological evidence, the genus Pontederia has recently been re-circumscribed to incorporate plant species of Monochoria, Pontederia and the polyphyletic group Eichhornia (Pellegrini et al., Reference Pellegrini, Horn and Almeida2018). The aquatic weed P. crassipes is native to South America (Gopal, Reference Gopal1987) and naturalized worldwide (Pellegrini et al., Reference Pellegrini, Horn and Almeida2018), becoming a serious problem in several aquatic ecosystems from the United States, Australia, Asia and Africa (Center et al., Reference Center, Hill, Cordo, Julien, van Driesche, Blossey, Hoddle, Lyon and Reardon2002). The introduced populations of this weed have low-genetic diversity and scarce differentiation when compared with those from the native range, and near to 80% of these introduced populations are composed of a single clone (Zang et al., Reference Zang, Zhang and Barrett2010). However, the occurrence of high number of propagules and multiple introductions around the world reveal important patterns associated with the elimination of founder effects and the success of plant invasions in the new range (Roman and Darling, Reference Roman and Darling2007).
Due to its specificity, C. aquaticum is currently under evaluation as a possible biological control agent of P. crassipes, which is considered the worst aquatic weed in South Africa (Oberholzer and Hill, Reference Oberholzer and Hill2000; Bownes et al., Reference Bownes, Hill and Byrne2010; Coetzee et al., Reference Coetzee, Hill, Byrne and Bownes2011). Despite several release attempts in South African sites, the establishment of this insect has yet to be confirmed, so genetics and ecological studies in the native range are particularly relevant to understand which factors may be responsible for the failure of its establishment in the new environment.
Additionally, earlier population cytogenetic studies demonstrated that at the southern extreme of its native distribution (27°S–34°S) C. aquaticum shows parallel latitudinal clinal patterns along the Paraná and Uruguay Rivers for three Robertsonian translocations (=centric fusions) whose frequencies increase southwards (Colombo, Reference Colombo2008). These rearrangements are associated with a reduction of recombination due to the decrease of linkage groups and the redistribution of chiasmata to distal positions in trivalents of structural heterozygotes (Colombo, Reference Colombo2007). This distal redistribution is correlated with an alternate orientation of trivalents in metaphase I, which is the only one that renders balanced gametes (Colombo, Reference Colombo2009).
The study of population structure by means of microsatellite loci in this area revealed that in this species also genetic diversity decreases southwards, coincidentally with the increase of all three Robertsonian fusion frequencies (Romero et al., Reference Romero, Colombo and Remis2017). The most southwardly marginal populations show the highest chromosomal differentiation and are simultaneously the most divergent ones from the genetic standpoint. Moreover, combined chromosomal and morphometric studies revealed that the fusions are associated with an increase of body size-related variables (Romero et al., Reference Romero, Colombo and Remis2014; Colombo and Remis, Reference Colombo and Remis2018).
Even though several studies assessed the relationship between centric fusions in C. aquaticum and morphometric body size-related variables, the relative role of natural selection on the phenotype and chromosome variations detected in natural populations remains unclear. This is important because the success of the introduction and establishment of C. aquaticum as a biological control in the introduced range implies the knowledge about the amount and distribution of intraspecific variability of the populations in their native range. In fact, in the context of evolutionary biology it is of foremost importance not only the detection, description and quantification of intraspecific chromosome and phenotypic variability, but also the inference of the relative relevance of the different evolutionary and demographic processes on the structure of such variation (Gaskin et al., Reference Gaskin, Bon, Cock, Cristofaro, Biase, Clerck-Floate, Ellison, Hinz, Hufbauer, Julien and Sforza2011; Roderick et al., Reference Roderick, Hufbauer and Navajas2012).
The release and establishment of C. aquaticum in its new environment are likely to have an effect on multiple ecological interactions with other organisms in the new range, including other biological control agents of the water hyacinth. Thus, a prediction of the outcome of biocontrol programmes requires knowledge about how natural selection operates in the phenotypic and chromosome variations of this grasshopper. In addition, it is widely known that body size variations have important implications in the capacity of dispersal, reproductive output and flight efficiency of insects (Rundle et al., Reference Rundle, Bilton, Foggo, Hildrew, Raffaelli and Edmonds-Brown2007). This is particularly important here because the relation among morphometric, geographic and climatic variables in the native range would be an additional tool to predict the feasibility of the establishment and dispersal of C. aquaticum as a biological control agent of the water hyacinth in the introduced range.
Summing, our aims in this study were:
(i) To examine the correlation between body size-related, geographic and climatic variables, based on the 13 populations sampled along the Paraná and Uruguay River Basins.
(ii) To compare the body size-related variables and chromosome variation patterns with respect to the null model of neutral molecular data to infer the signature of natural selection on intraspecific variation detected on the Paraná River Basin populations where molecular data were available.
Materials and methods
Biological material
Both adult males and females of C. aquaticum were captured from a boat or dry land waving a sweep net on Pontederia-floating meadows in 13 Argentinian populations along the Uruguay and Paraná River Basins during the breeding season (March–April) (2009–2011 along Paraná River Basin; 2014–2017 along Uruguay Basin) (fig. 1, table 1), namely Laguna Pampín (LP), Monte Caseros (MC), Salto Grande (SG), Santa Fe (SF), Colón (CO), Concepción del Uruguay (CU), Rosario (RO), Gualeguaychú (GU), San Nicolás (SN), Villa Paranacito (VP), San Pedro (SP), Zárate (ZA) and Tigre (TI).

Figure 1. Sampling area and C. aquaticum populations included in this study. Populations from the Paraná River Basin: Laguna Pampín (LP), Santa Fe (SF), Rosario (RO), San Nicolás (SN), San Pedro (SP), Zárate (ZA) and Tigre (TI). Populations from Uruguay River Basin: Monte Caseros (MC), Salto Grande (SG), Colón (CO), Concepción del Uruguay (CU), Gualeguaychú (GU) and Villa Paranacito (VP).
Table 1. Geographic and climatic variables associated with C. aquaticum populations from Paraná and Uruguay River Basins

Lat., south latitude; Long., west longitude; Min T, mean annual minimum temperature; Max T, mean annual maximum temperature (in °C); Rainfall, average monthly rainfall (in mm); mean number of fusions per individual in each grasshopper population is also indicated (fpi).
Abbreviations of grasshopper populations are given in fig. 1.
Phenotypic variation and structure
In the current paper, both compiled and new data of body size-related traits were analysed in the populations of C. aquaticum from both the Paraná and Uruguay River Basins. The phenotypic study was carried out on individuals with the aid of a Leitz Wetzler binocular microscope with a graded eyepiece (1 mm: 48 ocular units). The measured morphometric variables were phastigium–third coxa length (PCxL), taken from the phastigium to the third femur–third coxa articulation, third femur length (FL), third tibia length (TiL), prothorax length (TxL), prothorax height (TxH) and tegmen length (TegL).
To analyse population variation in a reduced set of independent variants, principal component analyses (PCA) of morphometric variables were additionally obtained separately for each sex due to the sexual size dimorphism in this species (Romero et al., Reference Romero, Colombo and Remis2014). The relationship between morphometric traits and principal components (PCs) with geographic (south latitude and west longitude) and climatic variables (mean annual minimum temperature, mean annual maximum temperature and average monthly rainfall) was analysed by means of nonparametric Kendall correlations using the STATISTICA package (Statistical Statsoft, 1996). We used nonparametric correlations because some variables did not fit the normal distribution even after using different transformations. Sequential Bonferroni correction for multiple comparisons was applied. Climatic data were obtained by means of the NewLocClim package (table 1).
Phenotype structure based on morphometric variation can be estimated by means of the P ST (Brommer, Reference Brommer2011) and Q ST (Spitze, Reference Spitze1993) statistics. Q ST statistic is inferred in a common garden and it assesses the divergence of a quantitative trait mainly explained by additive genetic effects. P ST statistic, a proxy of Q ST, is a phenotypic variance-based measure of divergence between natural populations, which is used when additive variance cannot be readily easily quantified (i.e. in field studies, Raeymaekers et al., Reference Raeymaekers, Van Houdt, Larmuseau, Geldof and Volckaert2007; Brommer, Reference Brommer2011).
P ST statistic was estimated according to Brommer (Reference Brommer2011) following the expression:

where c is the proportion of the total variance attributed to additive genetic effects between populations, h 2 is the heritability sensu stricto and σ 2B and σ 2W are the between- and within-population components of variance, respectively. It was assumed that the proportion of phenotypic variance that is due to additive genetic effects is the same within and among populations (i.e. c/h 2 = 1) (Brommer, Reference Brommer2011; Noguerales et al., Reference Noguerales, García-Navas, Cordero and Ortego2016). In general, the values of the proportion of the total variance attributed to additive genetic effects across populations (c) and heritability (h 2) are unknown in natural populations. However, one can identify the critical c/h 2 rate to infer the robustness of predictions (see below).
Components of variance, P ST statistics and their confidence intervals (95%) obtained by 1000 bootstrap were estimated with the Pstat package (v1.2, Blondeau Da Silva, Reference Blondeau Da Silva2017) of the R Statistical environment (R Core team, 2019).
Genetic structure
Microsatellite genotypic data previously assayed (Romero et al., Reference Romero, Colombo and Remis2017) in the same seven populations sited along the Paraná River that were analysed at the phenotypic level were considered here to examine genetic differentiation and to propose a neutral population structure scenario that would allow us to compare with phenotypic variation. Estimate variance components and F-statistic (Wright, Reference Wright1951, Reference Wright1965) over all loci, as outlined by Weir and Cockerham (Reference Weir and Cockerham1984), were accomplished using the hierfstat package (v0.04-22, Goudet and Jombart, Reference Goudet and Jombart2015) in R. Confidence intervals were estimated based on 1000 bootstraps.
Joint analysis of morphometric and molecular variation
Three approaches were developed to analyse simultaneously the assumed neutral differentiation and the phenotypic divergence.
At first, population pairwise distance matrixes of phenotypic and genetic differentiation were contrasted through a Mantel test using the R package vegan (v2.5-6, Oksanen et al., Reference Oksanen, Blanchet, Friendly, Kindt, Legendre, McGlinn, Minchin, O'Hara, Simpson, Solymos, Stevens, Szoecs and Wagner2019). Pairwise phenotypic differences between populations were estimated through the differences in trait means whereas genetic differentiation between the pairs of populations was analysed through pairwise F ST from Romero et al. (Reference Romero, Colombo and Remis2017).
Secondly, mean values of phenotypic differentiation (P ST) with assumed neutral microsatellite divergence (F ST) were compared to analyse the role of genetic drift and selection on body size-related traits (see for review Leinonen et al., Reference Leinonen, Mccairns, O'Hara and Merilä2013). Similarly, the confidence intervals of both statistics were compared to determine whether P ST and F ST are significantly different.
If P ST did not differ significantly from F ST, the phenotypic patterns of variation would be mainly explained by a migration–genetic drift interaction. On the contrary, higher or lower values of phenotypic divergence with respect to molecular marker differentiation would suggest that stabilizing (P ST < F ST) or divergence (P ST > F ST) selection are shaping up body size-related traits.
We tested the robustness of P ST–F ST comparisons by examining how well P ST approximates Q ST; to that effect we considered the rate between additive genetic effects across populations and heritability. We determined the minimum value of c/h 2 required for each phenotypic trait to produce non-overlapping confidence limits between P ST and F ST (Brommer, Reference Brommer2011; Noguerales et al., Reference Noguerales, García-Navas, Cordero and Ortego2016). According to Brommer (Reference Brommer2011), when P ST is higher than F ST, one should examine at which c/h 2 value (critical c/h 2) the lower confidence interval of P ST overlaps with the upper confidence interval of mean F ST estimate. Therefore, smaller values of critical c/h 2 provide stronger support for divergence selection affecting trait (Brommer, Reference Brommer2011).
Finally, the spatial phenotypic and molecular genotypic structures were inferred through a Bayesian approach by means of the Geneland program version 4.0.8 (Guillot et al., Reference Guillot, Renaud, Ledevin, Michaux and Claude2012) implemented in R. The most likely population number among the individual groups was determined, where each one of them is characterized by its multilocus genotype or its phenotype and their geographic coordinates. Ten runs (MCMC: 100,000; thinning: 100; burn-in: 100) were performed, and the results with the highest posterior probability were selected.
Joint analysis of chromosome and molecular variation
Population pairwise differentiation at karyotype and genetic levels were simultaneously analysed to infer the relative importance of selection on chromosome polymorphisms. Pairwise chromosome differentiation was estimated through the differences of mean centric fusion frequencies between pairs of populations (fusion 1/6, fusion 3/4 and fusion 1/5) included in Colombo (Reference Colombo2008). Pairwise genetic differentiation between populations (F ST) and their significance were obtained from Romero et al. (Reference Romero, Colombo and Remis2017). The statistical significance of chromosome differentiation was performed using Fisher's exact test with the P value computed based on the network developed by Mehta and Patel (Reference Mehta and Patel1983). All these tests were implemented in R Statistical environment (R Core team, 2019).
Results
Correlation between morphometric, geographic and climatic variables
Phenotypic datasets considering sample location along both Paraná and Uruguay River Basins indicated that body size decreases when south latitude increases (table 2). In males, both PCxL and TxH correlated negatively with latitude and positively with maximum and minimum temperatures, respectively. Besides, all variables except for FL were positively correlated with rainfall (table 3, fig. 2). In females, PCxL and TxH correlated negatively with latitude (r = −0.16, P = 0.003; r = −0.14, P = 0.01, respectively) whereas PCxL exhibited positive correlation with rainfall (r = 0.22; P = 0.00003). Even more, the morphometric cline was even more stressed when the LP population, which appeared as an outlier for females (table 2, fig. 3) was removed from the analysis. When this population was excluded, highly significant and negative correlations of PCxL, TxH and TxL with latitude and highly significant and positive correlations of all variables except for TxH with rainfall were found for females. Besides, a significant positive correlation of female TxH with maximum temperature was also detected (table 3). There is a parallelism between latitude, temperature and rainfall that may be attributed to the fact that, in this region, latitude and rainfall are strongly and negatively correlated.

Figure 2. Scatterplots of average values of body size-related traits from C. aquaticum populations along Paraná and Uruguay River Basins and climatic variables. Open circles: adult females; closed squares: adult males. Mean maximum temperature: mean annual maximum temperature (in °C); monthly rainfall: average monthly rainfall (in mm).

Figure 3. F ST and P ST for six morphometric traits (PCxL, FL, TiL, TxL, TxH and TegL) and their respective 95% confidence intervals across all populations of C. aquaticum here analysed. Global P ST values are shown for each sex separately. The reported P ST values are those obtained assuming c = h 2 = 0.5. Names of morphometric variables are given in table 2.
Table 2. Morphometric body size variables of C. aquaticum adult males (♂) and females (♀) from Paraná and Uruguay River Basins

Abbreviations of grasshopper populations are given in fig. 1 Morphometric variables measured were PCxL, length phastigium–third coxa; FL, third femur length; TiL, third tibia length; TxL, prothorax length; ThH, prothorax height; TegL, tegmen length.
Values of variables are given as mean and standard deviation (±). Samples marked with * and # were described in Colombo and Remis (Reference Colombo and Remis2018) and in Romero et al. (Reference Romero, Colombo and Remis2014) respectively, and those marked with + were resampled and measured (to analyse larger sample size), and (N) the unmarked ones belong to the current study.
Table 3. Kendall correlations of morphometric body size variables of C. aquaticum populations with geographic and climatic variables in Paraná and Uruguay River Basins

Similar relationships between geographic/climatic variables and body size-related traits were demonstrated when populations along each basin was considered, with body size showing correlation with latitude, maximum temperature and rainfall along the Paraná River, the same river basin from which molecular data are also available.
Results obtained with PCA from a set of independent variables showed that the first three PCs represented 84 and 83% of the total variance for males and females, respectively (table 4). The coefficients of PC1 in both sexes were similar and negatively related to all five morphometric traits and may be interpreted as a measure of general size. Accordingly, with the results of relationships mentioned above, PC1, negatively related to all analysed traits is negatively correlated with rainfall both in males and females (r = −0.23, P < 10–6; r = −0.21, P = 0.0001, respectively). Again, our results showed that populations with higher rainfall showed a larger body size.
Table 4. Loadings, eigenvalues and cumulative percentage of variance explained by the first three PCs on five body size-related traits of C. aquaticum populations from Paraná and Uruguay River Basins

Abbreviations of morphometric variables are given in table 2.
The coefficients of PC2 were positively associated with some traits and negatively with others and may contain information related to body shape. Moreover, both the magnitude and sign of the coefficients in PC2 for some traits are different between sexes, showing difference in body shape variation between males and females across the analysed geographic area. In males, PC2 is negatively correlated with latitude (r = −0.27, P < 10–6) and positively correlated with rainfall (r = 0.29; P < 10–6) and minimum and maximum temperatures (r = 0.25, P < 10–6; r = 0.20; P < 10–6, respectively), pointing out non-size-related shape differences. On the contrary, in females, PC2 did not correlated with any climatic/geographic variables.
No significant correlations were detected among PC3 and the climatic/geographic variables.
Joint analysis of phenotypic and genetic variation
When simultaneous phenotypic and molecular marker analyses were performed on males from populations collected along the Paraná River, the results showed that pairwise distance matrices of phenotype differentiation (P matrix) did not correlate with the genetic differentiation matrix (F ST matrix) in any body size-related trait (P > 0.05 in all cases), indicating that genetic drift has not played an important role in shaping the P matrix.
Afterwards, when we compared P ST–F ST estimated values, we found that the mean values of P ST for all body size-related traits were significantly higher than that of F ST. The 95% confidence intervals of P ST values for all characters analysed did not overlap with those obtained for F ST (fig. 3), which would indicate a prevailing effect of divergence selection on the observed patterns of among-population morphological differentiation. Further analyses showed that our results were consistent in more conservative scenarios under smaller c/h 2 ratios (table 5). These results indicated that P ST can be considered as a good proxy of Q ST in C. aquaticum populations here analysed.
Table 5. P ST values with their confidence intervals and the critical c/h 2 ratio for all the analysed body size-related traits in adult males of C. aquaticum from locations along the Paraná River Basins

Finally, we compare Bayesian genotypic and phenotypic spatial structure. The spatial model based on genotypic dataset identified three clusters which were coincident with those previously obtained by using multidimensional scaling analysis based on pairwise F ST (Romero et al., Reference Romero, Colombo and Remis2017). Most populations grouped together in a single cluster, except for the extreme downstream ZA and TI populations, which diverged from each other and from the rest; both populations were the southernmost, most marginal ones and also the most polymorphic from the chromosomal point of view (figs 4a–c). The same analysis based on phenotypic data identified three clusters but rendered a different pattern, setting apart the distant, northernmost LP and SF populations from each other and from the rest, and merging all five populations from the Paraná River Delta (figs 4d–f), thus suggesting that the phenotypic pattern could not be explained under a neutral scenario.

Figure 4. Genotype (a–c) and phenotype (d–f) spatial distribution of each group defined by Geneland for C. aquaticum populations in the medium and lower Paraná River. Lighter colours indicate higher probabilities of population membership. Abbreviations of populations are given in fig. 1.
Joint analysis of chromosome and molecular variation
Clinal patterns for three centric fusions were obtained along the southwardly flowing Paraná River (Colombo, Reference Colombo2008). The comparison between pairwise chromosome differentiation for each fusion and genetic differentiation showed that chromosomal variation was significantly higher than the variability attributable to neutral markers (table 6). The spatial chromosome variation did not reflect the spatial variation for neutral markers, suggesting that neutral processes cannot explain variation in karyotype.
Table 6. Level of significance for pairwise comparisons between C. aquaticum populations along the Paraná River Basin at molecular (F ST) and chromosome levels
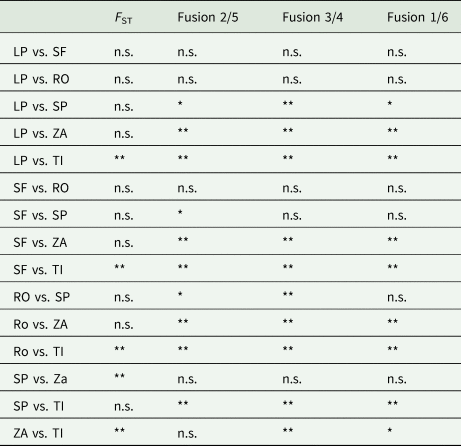
Data of F ST from Romero et al. (Reference Romero, Colombo and Remis2017). n.s. indicates non-significant differences; * and ** indicate significant differences and highly significant differences, respectively, after Bonferroni correction.
Discussion
Phenotype, karyotype and molecular variation in C. aquaticum populations
The distribution of intraspecific variation across landscapes can provide insights into the interactions between the environment and genotype to evolve to local conditions (Bragg et al., Reference Bragg, Supple, Andrew and Borevitz2015; Flatt, Reference Flatt2016). Our results that deal with the intraspecific variability of C. aquaticum populations in its native range are relevant both from a theoretical standpoint as well as from an applied perspective, due to the eventual introduction of this grasshopper as a biological control of water hyacinth in South Africa. The current paper includes a holistic analysis of chromosomal, phenotypic and molecular variability of this semiaquatic grasshopper thus compiling and extending the findings of previous studies.
Earlier studies in this region including populations located from 27 to 34°S latitude revealed that C. aquaticum has a rich chromosomal variability, with three polymorphic centric fusions whose frequencies increase from north to south (Colombo, Reference Colombo2008; Colombo and Remis, Reference Colombo and Remis2018). Even though the potential of polymorphic chromosomal inversions in facilitating local adaptation has been widely examined, just a few studies started to deal with the role of centric fusions in microevolution (Dumas and Britton-Davidian, Reference Dumas and Britton-Davidian2002; Bidau et al., Reference Bidau, Miño, Castillo and Martí2012; Colombo, Reference Colombo2013; Guerrero and Kirkpatrick, Reference Guerrero and Kirkpatrick2014; Wellband et al., Reference Wellband, Mérot, Linnansaari, Elliott, Curry and Bernatchez2018), which adds relevance to the results obtained in this study.
The centric fusions in C. aquaticum, as well as in other polymorphic species (i.e. grasshoppers and house mouse), reduce recombination between the unfused acrocentrics and the fusion metacentrics by decreasing the number of independent groups; furthermore, they cause a reduction of proximal chiasmata in the resulting trivalent, what helps to ensure the proper orientation and segregation of the meiotic trivalent of heterozygotes, and also prompts genetic differentiation between rearranged and non-rearranged chromosomes (recombination-free regions) (Dumas and Britton-Davidian, Reference Dumas and Britton-Davidian2002; Colombo, Reference Colombo2007, Reference Colombo2013; Bidau et al., Reference Bidau, Miño, Castillo and Martí2012).
Nonetheless, genomic approaches support that genetic divergence between the rearranged and non-rearranged sequences can vary along the chromosome. Theoretical and some empirical approaches showed pronounced peaks of genetic divergence in the proximity of the breakpoints (limited or nearly absent gene flux) and on the locally adapted loci further than the breakpoints (Kirkpatrick, Reference Kirkpatrick2017; Kapun and Flatt, Reference Kapun and Flatt2018).
Although the strong negative association of fusion frequencies with maximum temperature, as well as the consistent repetition of clines along the Paraná and Uruguay River Basins, suggests an adaptive nature to the clinal variation in C. aquaticum populations (Colombo and Remis, Reference Colombo and Remis2018), it must be considered that clinal patterns can be also produced by neutral processes (Endler, Reference Endler1973; Storz, Reference Storz2002). For this reason, we have taken pains to perform additional analyses that further demonstrate a non-neutral explanation to the parallel clines, namely, a population pairwise differentiation study between the frequency of centric fusions and that of neutral microsatellite pattern. The results of this study are consistent with an adaptive explanation. Some genetically homogenous population pairs (such as LP-SP; SF-ZA and RO-ZA) exhibited high differentiation in chromosomal constitution, as expected if differential selective pressure on chromosomal variation were to be found in populations with significant gene flow. On the contrary, some genetically differentiated population pairs showed little chromosomal divergence (such as ZA-SP), suggesting similar chromosomal selective pressures in both populations according to environmental conditions despite the low gene flow between them.
Our results showed that the clinal chromosomal variation found in C. aquaticum may be mostly explained by spatially varying selection that increases higher centric fusion frequencies in the downstream populations. Centric fusions could be favoured in situations when tight linkage is advantageous (Guerrero and Kirkpatrick, Reference Guerrero and Kirkpatrick2014). One possible hypothesis is that locally adaptive genes preserved from recombination by centric fusions at lower latitudes are associated with increased tolerance to colder climates in this originally tropical species, which could have implication for the establishment of this species in some temperate regions of South Africa. Further studies identifying adaptive loci within the limits of different centric fusions can improve our understanding about intraspecific variation in C. aquaticum.
A considerable body size variation in C. aquaticum was detected in both sexes along the Paraná and Uruguay Basins. Spatial environmental variation is widespread, and populations of a wide range of species are associated with proximate and ultimate causes comprising biotic and abiotic conditions (Whitman, Reference Whitman2008; Hernández et al., Reference Hernández, Monteiro and Favila2009; Bidau et al., Reference Bidau, Miño, Castillo and Martí2012; Savolainen et al., Reference Savolainen, Lascoux and Merilä2013). The understanding of phenotypic variation patterns of C. aquaticum is essential to distinguish environmental restrictions and selective effects, predicting the response of grasshopper populations to environmental change in the native range as well as in the process of establishing of this species in the new environment at the introduced range, as previously found in other taxa (Stearns, Reference Stearns1992; Berner and Blanckenhorn, Reference Berner and Blanckenhorn2006; Huizenga et al., Reference Huizenga, Shaidle, Brinton, Gore, Ebo, Solliday, Buguey, Whitman and Juliano2008).
Clinal variation in C. aquaticum is not limited to chromosomal constitution and we have provided evidence here that a significant deal of body size variation occurs both in males and females of this grasshopper species. Besides, body size correlates negatively with latitude, in discordance with Bergmann's rule, and in agreement with most other arthropod species (for a review see Blanckenhorn and Demont, Reference Blanckenhorn and Demont2004). Morphometric variation is also correlated with temperature and rainfall, two variables that seem to be good indicators of some factors with adaptive significance.
It is known that host plants may influence morphometry and morphology of herbivores; as for C. aquaticum, they were mentioned by Adis et al. (Reference Adis, Sperber, Brede, Capello, Franceschini, Hill, Lhano, Marques, Nunes and Polar2008), who found that C. aquaticum females are larger on P. azurea than on P. crassipes, whereas males have larger wings than their body on P. azurea, and similar lengths on P. crassipes. Furthermore, they emphasize that these morphological changes may have resulted from phenotypic plasticity, selection for small size or a loss of genetic diversity in quantitative traits. More studies are needed to determine other potential factors (isolation, low-genetic diversity, competition, low-quality food, etc.) influencing C. aquaticum morphometry.
Positive correlations of some body size-related traits with temperature, may be related to both the traits themselves and to life history-related issues such as the time in which growth and reproduction of this grasshopper take place, as previously found in other insects (Roff and Mousseau, Reference Roff and Mousseau2005; Lehmann and Lehmann, Reference Lehmann and Lehmann2008; Whitman, Reference Whitman2008). C. aquaticum individuals from the Paraná and Uruguay Basins attain larger sizes at subtropical, lower latitudes with longer breeding season length. On the contrary, this grasshopper reaches smaller body size at colder, higher latitudes such as both rivers' mouth in the Rio de La Plata River, where breeding season lengths are shorter, thus limiting the optimal time for foraging, growth and development. This association between life history strategies and phenotypic traits neatly fits the converse Bergmann pattern found in our study. Our results are in agreement with previous studies in grasshoppers and crickets that highlight the importance of seasonal length to attain optimal body size across latitudes (Mousseau and Roff, Reference Mousseau and Roff1989; Sesarini and Remis, Reference Sesarini and Remis2008; Bidau et al., Reference Bidau, Miño, Castillo and Martí2012).
Moreover, there is a very good positive correlation of phenotypic traits with rainfall, a fact probably related to the optimal conditions for greater availability of water in the system and consequently greater coverage of the host plant and increased habitat availability (Turić et al., Reference Turić, Temunović, Radović, Vignjević, Sudarić Bogojević and Merdić2015). In fact, in tropical populations of C. aquaticum from the Amazonian rainforest (lat 3°S) and the Pantanal of Mato Grosso, a marshland in Brazil (lat 16°S) the rhythms of the populations' cycles (where population size rises and falls over a predictable period of time) are marked mainly by the availability of water (‘flood pulse’); in both populations, reproduction is continual, with a larger breeding season in the Amazonian rainforest (Silva et al., Reference Silva, Marques, Battirola and Lhano2010). Our results indicated that the availability of water (and resource availability) as well the season length are central for C. aquaticum and may help to explain the close relationship between body size, rainfall and latitude here described.
The P ST–F ST comparison demonstrated that the phenotypic differentiation for all the body size-related traits here analysed is higher than that expected under a neutral model. Thus, our results support a preponderant role of phenotypic divergence selection as the leading evolutionary process explaining among-population morphometric variation (Brommer, Reference Brommer2011; Noguerales et al., Reference Noguerales, García-Navas, Cordero and Ortego2016). Despite the potential shortcomings of using P ST as an approximation of Q ST (Pujol et al., Reference Pujol, Wilson, Ross and Pannell2008), the estimated P STs represent good proxies of the corresponding Q ST (high robustness of inferences). Moreover, our complementary studies support the hypothesis that phenotype variation may be an adaptive response of C. aquaticum to environmental challenges; this fact may suggest that the relevance of our results in the context of biological control science and the ongoing climate change may not be unconsiderable.
The comparison of variation in body size-related characters here described does not correlate with the detected, purportedly neutral molecular variability, showing that morphometric variation cannot be explained by stochastic factors (Leinonen et al., Reference Leinonen, O'Hara, Cano and Merilä2008, Reference Leinonen, Mccairns, O'Hara and Merilä2013; Brommer, Reference Brommer2011; Noguerales et al., Reference Noguerales, García-Navas, Cordero and Ortego2016). Moreover, our results from spatial Bayesian population structure indicate that phenotypic differentiation is not driven by genetic drift and point to a more important role of local adaptation processes in the medium and lower course of the Paraná River. A clear phenotypic differentiation of the distant, northernmost SF and LP populations from the populations of the Paraná Delta was evident. Instead, the neutral genetic variation clearly singles out the southernmost, marginal, and chromosomally highly polymorphic ZA and TI populations, with all the other –deltaic or not – showing little or no differentiation from both the genetic and chromosomal standpoint (Brede et al., Reference Brede, Adis and Schneider2008; Colombo, Reference Colombo2008; Romero et al., Reference Romero, Colombo and Remis2017). Therefore, the clinal phenotypic variation of the semiaquatic grasshopper C. aquaticum may be associated with water availability and season length and seems to reflect clinal patterns of local adaptation.
New sampling along the Uruguay River will allow us to compare neutral microsatellite variation with chromosome and phenotype divergences on the Paraná Basin, therefore improving our knowledge of adaptive variation in C. aquaticum. On the contrary, analysis of morphology using geometric morphometric methods (MMG) would provide additional and complementary information concerning the phenotypic divergence associated with shape in insects (Bai et al., Reference Bai, Dong, Guan, Xie and Xu2016). The linear morphology approach we employed here is a basic, but necessary step to further advance with MMG in when newer samples of C. aquaticum are available.
Relevance of our results on the biological control of water hyacinth
The knowledge of natural population variability may be useful in the biological control programmes. The information on the amount and distribution of genetic variability in the native range of a biocontrol agent renders complementary information that maximises the efficiency of the control programme (Wajnberg, Reference Wajnberg, Ehler, Sforza and Mateille2004).
Despite a considerable number of ecological and biological studies about C. aquaticum, the genetic aspects and their relevance to the biological control science remain relatively poorly understood, so our holistic study comprising chromosome, genetic and phenotype variability in the southernmost extreme of the range distribution are useful to fill these knowledge gaps.
Our results presented here and those obtained previously (Colombo, Reference Colombo2007, Reference Colombo2008) are critically important to provide applications along with further directions which would be valuable for developing future biocontrol programmes with C. aquaticum, mainly in concern to selection of the founder colony and temperature of the introduced range. In fact, climatic incompatibility and low-genetic variability as a result of isolated conditions have been mentioned as responsible for the low insect performance and failure establishment of C. aquaticum in the introduced range (Venturi, unpublished; Brede et al., Reference Brede, Adis and Schneider2008). However, substantial genetic variation may be retained or recovered after a bottleneck in water hyacinth biological control agents as Eccritotarsus catarinensis Carvalho (Taylor et al., Reference Taylor, Downie and Paterson2011).
The quarantine population of C. aquaticum in the introduced range experienced a reduction in body size, with males having wings smaller than body length (Adis et al., Reference Adis, Sperber, Brede, Capello, Franceschini, Hill, Lhano, Marques, Nunes and Polar2008; Franceschini, pers. obs.). Large body size is known to increase the competitive ability of insects and in the particular case of females, is usually correlated with a larger offspring (Smith and Belk, Reference Smith and Belk2018). In this context, our results showing a positive correlation between morphometric variables and temperature as well the prevalence of divergence selection in the phenotypic patterns, could indicate that C. aquaticum body size of the source population in the native areas and local temperature of the introduced range could be important for the selection of the founder colony and establishment of this insect as a biological control agent.
Our studies (Colombo, Reference Colombo2007, Reference Colombo2008) suggest that southern, downstream C. aquaticum populations bear a lower amount of genetic diversity, possibly restricted by a higher frequency of Robertsonian translocations. The genetic structure along the Paraná River inferred from neutral markers is divergent from that calculated from both karyotypic and body size-related traits, thus that the two latter may have adaptive. It is not difficult to find literature supporting an adaptive value to body size. Robertsonian rearrangements in C. aquaticum populations from the deltaic region of the Paraná River just north of Buenos Aires may hold together genes that enhance the adaptation to environments with lower winter temperatures, as was found previously in other insects (Guerrero and Kirkpatrick, Reference Guerrero and Kirkpatrick2014). The fact that both Cape Town and Buenos Aires are sited at the same latitude (34°S), with lower winter temperatures and frequent frosts, is highly suggestive and we think that must be held into account in any release plan of C. aquaticum as a biocontrol in South Africa.
The introduction of C. aquaticum grasshoppers from Northern areas – deprived from Robertsonian translocations and consequently with higher genetic variability – would be, at a first glance, a safer bet for improving the ability to face selection pressures in the alien environment, and consequently to enhance its chance of establishment. However, it should be held into account that the probability of success of the biological control programme also increases when the environment of the source habitat matches that of the target one (Messenger and van den Bosch, Reference Messenger, van den Bosch and Huffaker1971). Furthermore, that a mix of populations with high interpopulation divergence (rather than intraspecific) may also render the genetic diversity needed to face new selective challenges. In this alternative scenario, a blend of southern, chromosomally polymorphic populations, would be a more suitable choice.
We think that the answer to this conundrum is to be found in future studies along the wide latitudinal range where C. aquaticum occurs, in order to further elucidate the relative role of natural selection on the phenotypic and chromosomal variations of C. aquaticum; according to us, this would be a necessary step to bring about thriving populations of this prospective biological agent for the control of the world's worst water weed.
Concluding remarks
In the current study, it was observed that the genetic structure of C. aquaticum along the Paraná River inferred from neutral markers is divergent from that calculated from both karyotypic and body size-related traits, thus reflecting that the latitudinal patterns of phenotypic and chromosome variation related to adaptive significance. The clinal patterns of variation on morphometric traits are consistent with divergence selection favouring differences on body size that are related to the environment. Furthermore, it is also shown that karyotypic variation cannot be explained under a neutral scenario, thus adding another hint of a possible adaptive role for the Robertsonian rearrangements in this species. The southernmost populations of C. aquaticum displaying high chromosomal variation and the greatest genetic interpopulation divergence should be considered in the selection of the founder colony and any controlled release of this species as a biological control in the introduced range.
Acknowledgements
The authors wish to thank Drs S. Capello, M. Marchese and Club de Regatas Rosario, Club Náutico San Pedro and Club Náutico Zárate for assistance in the collection of most specimens.
Financial support
Financial support from the Consejo Nacional de Investigaciones Científicas y Técnicas (Argentina) (11220130100492CO) and Agencia Nacional de Promoción Científica y Tecnológica (PICT 2018-02567) (Argentina) to Dra Maria Isabel Remis, and Universidad de Buenos Aires (Argentina) (20020170100270BA) to Dr Juan C. Vilardi is gratefully acknowledged.


