


Introduction
The Chinese wax scale (Ceroplastes sinensis) is a polyphagous soft scale (Hemiptera, Coccidae and Lecaninae) that feeds on more than 200 vegetal species (Qin et al., Reference Qin, Gullan, Beattie, Trueman, Cranston, Fletcher and Sands1994). Ceroplastes sinensis is considered a pest especially on citrus trees, to which direct injuries are caused by phloem content suction, and also indirect injuries derive from the excretion of honeydew on leaves and fruits, and the subsequent shooty mould that reduces photosynthesis and respiration, disturbs the control of other pests, marks fruits and annoys harvesters (Llorens, Reference Llorens1990; Katsoyannos, Reference Katsoyannos1996). Chinese wax scale was first described in Italy (Del Guercio, Reference Del Guercio1900). Its origin is neotropical (Qin et al., Reference Qin, Gullan, Beattie, Trueman, Cranston, Fletcher and Sands1994), although it is currently distributed throughout all continents (Gómez-Clemente, Reference Gómez-Clemente1927; Freeborn, Reference Freeborn1931; Snowball, Reference Snowball1970; Qin et al., Reference Qin, Gullan, Beattie, Trueman, Cranston, Fletcher and Sands1994; Katsoyannos, Reference Katsoyannos1996; Stathas et al., Reference Stathas, Kavallieratos and Eliopoulos2003).
Chinese wax scale is considered a key pest of citrus in Australia and New Zealand (Smith et al., Reference Smith, Beattie and Broadley1997; Lo, Reference Lo2004); however, in the Mediterranean Basin, it is considered a secondary pest, because its populations usually remain below economic injury levels due to unfavourable environmental conditions, natural enemies and sprays performed to control other citrus pests. Nevertheless, local outbreaks occasionally occur in the western countries of the region, especially on clementine varieties (García-Marí et al., Reference García-Marí, Costa and Ferragut1994; Katsoyannos, Reference Katsoyannos1996; Stathas et al., Reference Stathas, Kavallieratos and Eliopoulos2003). In Spain these outbreaks have recently been observed to be more frequent (personal observation), since growers are increasingly using more selective pesticides for citrus pest management. As a result, the need to perform chemical treatments to manage C. sinensis is increasing.
After egg hatching, C. sinensis crawlers move onto the leaves and are located along the leaf midrib. They then settle down and insert their stylets, begin to feed and produce white waxy secretions in a star shape. Immature C. sinensis moult twice on leaves, and at the end of the third instar, they migrate to the twigs to develop into a female (Llorens, Reference Llorens1990). Males are rare in this species (Llorens, Reference Llorens1990). Snowball (Reference Snowball1970) found that males comprised only 2.5%, suggesting that the fertilization of females is not necessary for reproduction. Females on twigs become immobile and their wax cover becomes almost hemispheric. Each adult female lays 2000 eggs on average between its body and a ventral veil that separates it from the plant. Crawlers from the hatched eggs leave the mother at staggered times and invade the leaves (Gómez-Clemente, Reference Gómez-Clemente1927).
Lecaninae have a thick waxy coating that protects them from chemical treatments, especially third instars and females (Panis, Reference Panis1977). Consequently, to ensure successful control, accurately determining the seasonal trend of C. sinensis during the year is crucial, since pesticide applications must be performed against the most sensitive stages, first and second instars. The high fecundity of females contributes to pest outbreaks when weather conditions are favourable, and determines that sprays must be performed when most of these eggs have hatched. Frequently, sprays are performed when the grower observes numerous young nymphs on the canopy. The presence of abundant nymphs on leaves only indicates that hatching has started, but not that the majority has hatched, often resulting in spraying being performed when only a small proportion of eggs have hatched. Moreover, determining the phenology of C. sinensis will help to establish the most effective timing for inundative releases of entomophagous arthropods to enhance biological control.
Surveys of natural enemies conducted in Spain have recorded the presence of the eulophid Aprostocetus ceroplastae Girault and the pteromalid Scutellista cyanea Motschulsky as parasitoids of C. sinensis (Limón et al., Reference Limón, Meliá, Blasco and Moner1976; Ripollés, Reference Ripollés1986). Metaphycus helvolus has been found on several species of Ceroplastes (Guerrieri & Noyes, Reference Guerrieri and Noyes2000) and parasitizing upon C. sinensis in Australia (Snowball, Reference Snowball1970). No information about the efficacy of these parasitoids on C. sinensis is available in the literature.
Integrated pest management (IPM) programs require the pest population abundance to be estimated, to decide whether to perform chemical control. Even though different empirical sampling methods are used (BOJA, 2002; BORM, 2012; DOGV, 2012; DOGC, 2013), no scientific approaches have been studied and no reliable and precise sampling methods have been developed for C. sinensis in citrus.
Ceroplastes sinensis dynamics in the Mediterranean Basin has been sparsely documented (Panis, Reference Panis1977; Stathas et al., Reference Stathas, Kavallieratos and Eliopoulos2003), and its life cycle remains unclear. The reported number of generations per year ranges from one to two, and peaks of crawler emergence are reported to occur in different months (Gómez-Clemente, Reference Gómez-Clemente1927; Llorens, Reference Llorens1990; García-Marí et al., Reference García-Marí, Costa and Ferragut1994; Stathas et al., Reference Stathas, Kavallieratos and Eliopoulos2003). Thus, the aim of this research was to improve the integrated management of C. sinensis in citrus as a result of better knowledge of its life cycle in the Mediterranean area, defining the correct time for evaluating its population, knowing the parasitoid complex and developing feasible and accurate sampling methods, binomial and enumerative, for the estimation of C. sinensis abundance.
Material and methods
Sites and sampling methods
Seasonal trends and the parasitoid complex were studied in six commercial citrus groves with medium to high infestations of C. sinensis. The study was conducted in different varieties located in the citrus area of Northern Spain: four Clementine (Citrus reticulata Blanco) groves (three Clemenules variety groves, ‘Soldebre’, ‘Didac’, and ‘Mianes’, and one Marisol variety grove, ‘Müller’, in Tarragona province), and two Valencia (Citrus sinensis Osbeck) variety groves, ‘Gravera’ and ‘Sant Rafel’, in Tarragona and Castellón province, respectively. The ‘Mianes’ grove was sampled only for parasitism. Eight trees per grove were selected from the centre of a 1800 m2 area, where no pesticide treatments were performed during the entire experiment. Trees were sampled fortnightly from August 2010 to February 2013, except ‘Gravera’, that was sampled from August 2010 to November 2012, due to a pesticide treatment performed by the grower, and ‘Mianes’, a citrus grove incorporated later in the study, sampled from April 2012 to February 2013. In each grove and sampling, 40 not fully lignified twigs with infested leaves were randomly taken from trees, placed into plastic bags and transported to the laboratory. The twigs were cut into pieces and carefully mixed to ensure randomness. To accurately estimate the proportion of immature stages with respect to the total population, three twigs were chosen, and the length of the twig was measured and the number of leaves was counted. Under a stereoscopic microscope (Leica MZ6 stereomicroscope (Leica Microsystems, Wetzlar, Germany)), the number of adults on each twig and the number of immature C. sinensis on five leaves randomly selected from the twig were counted. From the same sample, 40 twigs were randomly chosen and using a stereoscopic microscope, up to 100 live females, identified according to Llorens (Reference Llorens1990), were counted, removed from the twigs and classified into six categories, according to the presence of hatched and unhatched eggs, and crawlers: (1) young females (before oviposition, the ventral surface of young females was red and turgid (Llorens, Reference Llorens1990)); (2) females with eggs and 1–12% eggs hatched; (3) females with crawlers and 13–40% eggs hatched; (4) females with crawlers and 41–64% eggs hatched; (5) females with crawlers and 65–90% eggs hatched; and (6) females with crawlers and 91–100% eggs hatched. In addition, several leaves were randomly removed from the twigs and on each one, all living individuals were counted, and the developmental stage (first, second, and third instar) for up to 200 alive individuals was noted. Developmental stages were identified according to Llorens (Reference Llorens1990).
The percentage of each developmental stage (L1+L2, L3, young female, female with eggs and female with crawlers) was statistically analysed by GLM for data from 2011 and 2012 in the groves that were sampled throughout the entire year (‘Soldebre’, ‘Didac’, ‘Müller’ and ‘Sant Rafel’).
Chinese wax scale parasitoid complex was investigated in the six groves. For each grove and sampling, when present, 100–300 individuals belonging to each developmental stage (first instar (L1), second instar (L2), third instar (L3) and females) were counted and placed in ventilated cylindrical emergence cages (4 cm×6.5 cm). These cages were kept at 24–27 °C and 60–80% relative humidity for 40–45 days. Samples were later examined under a stereoscopic microscope, and emerged parasitoids determined. We used the keys of Guerrieri & Noyes (Reference Guerrieri and Noyes2000) and Hayat (Reference Hayat and Gupta1998) to identify the Hymenoptera. Cecidomyiidae present in the same samples were also collected.
To establish sampling plans, in June and July, the population of C. sinensis was sampled in 96 citrus commercial groves. Groves were selected throughout the citrus study area from different varieties, soil and pesticide management regimes, and C. sinensis abundance, to ensure general variability and that the sampling method would be generally applicable to all citrus groves. In each grove, 20 trees were randomly selected, and the number of C. sinensis females was counted on six, 25–35 cm-long randomly selected not fully lignified twigs per tree.
Climatic data were obtained from the Amposta meteorological station (40°42′27.98″N; 0°37′55.57″E), belonging to XAC (Catalan Agrometeorological Network).
Statistical analysis
Differences on the relative proportion of each C. sinensis developmental stage were studied by analysis of variance (PROC GLM). Means were compared using Duncan's multiple range test with a 95% significance level. The regression analyses were performed by PROC REG procedure for estimating Taylor's Power law and Kono & Sugino parameters. Probit analysis (PROC PROBIT procedure) was performed on the log of the percentage of hatched eggs to estimate the 50 and 90% of egg hatching. Differences in egg hatching data were assessed by a comparison of the 50 and 90% of hatched eggs and overlap in 95% fiducial limits. All analyses were conducted using the statistical package SAS Institute Inc. (2009).
Measure of dispersion
Spatial distribution indices for C. sinensis females were calculated according to Taylor's power law, which relates the logarithm of variance (s 2) to the logarithm of the mean (m) of all counts (Taylor, Reference Taylor1961): ln s 2=ln a+b ln m, where a is a sampling factor, which depends on the sample size but has no ecological meaning, and b is an intrinsic property of the species that describes the degree of aggregation with a constant graduation of the distribution of the population from near regular (b<1), through random (b=1), to aggregated (b>1).
Enumerative sampling
Calculation of the sample size for the enumerative sampling method was based on Green's formula (Green, Reference Green1970), which establishes the precision of the sampling considering the standard error (
 $s/\sqrt n $
) as a fixed proportion (E) of the sampling mean (m). In our study, we applied a value of E=0.25, which is usually applied to extensive studies of insect populations (Southwood & Henderson, Reference Southwood and Henderson2000) and is considered appropriate for the commercial monitoring of pest populations within IPM programs (Hutchins, Reference Hutchins, Pedigo and Buntin1994). The variance value in the formula has been replaced by its expression according to Taylor's index: n=a m
(b−2)
E
−2.
$s/\sqrt n $
) as a fixed proportion (E) of the sampling mean (m). In our study, we applied a value of E=0.25, which is usually applied to extensive studies of insect populations (Southwood & Henderson, Reference Southwood and Henderson2000) and is considered appropriate for the commercial monitoring of pest populations within IPM programs (Hutchins, Reference Hutchins, Pedigo and Buntin1994). The variance value in the formula has been replaced by its expression according to Taylor's index: n=a m
(b−2)
E
−2.
Binomial sampling
With this method, the population density is estimated by counting the number of sampling units occupied (or not) by the insect. It can only be applied if there is a constant relationship between the proportion of occupied units (p) and the mean number of insects per sampling unit (m). This relationship can be obtained from the empirical formula proposed by Kono & Sugino (Reference Kono and Sugino1958), Gerrard & Chiang (Reference Gerrard and Chiang1970) and Nachman (Reference Nachman1984):
 $$\ln (m) = a' + b'\ln ( - \ln [1 - p])$$
where a′ and b′ are the constants obtained from the regression. Another possibility for relating m and p depends on knowing the function of distribution of the population. The negative binomial distribution (NBD) often adjusts to the distribution of insects in nature, which is usually aggregated. The formula that relates p with m is then: p=1−(k/(k+m)) k (Bliss & Fisher, Reference Bliss and Fisher1953), where k is a parameter characteristic of the NBD. Wilson & Room (Reference Wilson and Room1983) suggested substituting k in this formula by its value as a function of the mean and constants of the expression of Taylor's power law a and b,
 $$k = m^2 /(am^b - m)$$
giving the expression, p=1−exp(−m[ln(am (b−1))/(am (b−1) −1)]).
The sample size or number of sampling units required to estimate the population density with a given level of precision has been calculated from the expression of the variance. There are no exact estimates for the variance of m for the empirical model, but several approximations have been suggested (Jones, Reference Jones, Pedigo and Buntin1994). We used the equation with four components proposed by Schaalje et al. (Reference Schaalje, Butts and Lysks1991) to estimate the variance of ln m: Var[ln(m)]=c 1+c 2+(c 4−c 3), where
 $$\eqalign{&c_1\! = pb'^2 /n(1-p)\ln (1-p)^2 \cr &c_2\! = {\rm MSE}/N + (\ln [ - \ln (1-p)]-P)^2 s_b^2 \cr & c_3\! = \exp (\ln a + [b-2][a' + b'\ln ( - \ln [1 - p])])/n \cr & c_4\! = {\rm MSE}} $$
Terms a′ and b′ are the intercept and slope of equation (1), MSE is the mean-square error from the regression of equation (1), N is the number of data points in that regression, P is the mean of the independent variable [ln(−ln[1−p])] in the data set used for the regression, s b 2 is the variance of slope b′, and a and b are the parameters of Taylor's power law.
The equations used to calculate the sample size n required to estimate m for a fixed relative precision E, were obtained by considering E as a ratio of the standard error of the mean, E=[var(m)]0.5/m, and by estimating the var(m) from the relationship (Nachman, Reference Nachman1984), var(m)=m 2 var[ln(m)].
For the NBD model the sample size was estimated using the expression of the variance suggested by Kuno (Reference Kuno1986):
 $$n = (1/E)(1-[1 - p])(1 - p)^{ - (2/k) - 1} (k[(1 - p)^{ - 1/k} -1])^{ - 2} $$
where k, the parameter of the negative binomial distribution, was calculated from equation (2).
Results
Ceroplastes sinensis seasonal trends
Although some variability between years and groves was observed, no large differences in dynamics were found. For stages L1+L2 and females with eggs, no interactions were found among grove and year, grove and month or year and month (table 1). Neither, statistical differences were found among groves or years, but significant differences were found among months. The maximum percentage of L1+L2 was achieved in August, 94±1%, followed by September and July, which were significantly different, with 53±7% and 45±11%, respectively (fig. 1). In October, this percentage was 17±4%, significantly lower than those reported during the other months, which were zero or very low. The highest percentage of females with eggs was observed in June, with 34.9±6.1%, followed by July with 20.1±4.7%. For the rest of the year, the percentage was less than 2%.
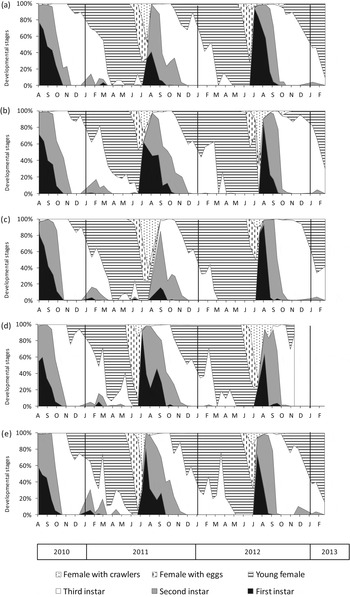
Fig. 1. Seasonal relative abundance of C. sinensis developmental stages in five citrus groves: (a) Didac, (b) Müller, (c) Soldebre, (d) Gravera and (e) Sant Rafel from July 2010 to February 2013.
Table 1. Statistic parameters for the relative abundance of the different stages of C. sinensis in five citrus groves during 2011 and 2012 (PROC GLM).
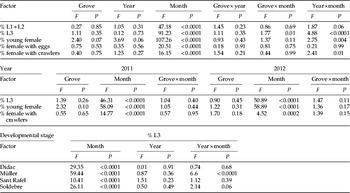
df: Grove=3; year=1; month=11; grove×year=3; grove×month=33; year×month=10.
For L3, young females and females with crawlers, interactions among year and month were found: therefore, data were analysed by year. In the case of L3, the highest percentage was achieved in 2011 from October to December, and in 2012 on October and November. Due to interactions found for L3 between grove and month, data were analysed by grove: the highest percentage of L3 was reached between September and December in ‘Didac’ and ‘Sant Rafel’ groves, and from October to December in the other two groves. Overall, the L3 stage reached 78.0±3.3% in November. For young females, the highest percentage was observed in 2011 from March to June and in 2012 from March to May. Overall, the young female stage reached 94.4±2.0% in May. For females with crawlers, the highest percentage was reached both in 2011 and 2012 in July, and overall, this stage reached 22.7±5.3%. Ceroplastes sinensis completed a single generation per season (fig. 1). The earliest third instars were observed on leaves in mid-August. During the following nine months, they were observed, until May, and between October and January this instar represented more than 50% of the overall population. Third instars moved to twigs and moulted on young females. Young females were observed for eight months; they appeared in late October and early November and remained until the end of June. During April and May, more than 90% of the population was composed of young females. Egg oviposition started in late May to early June, and continued until mid-July (fig. 1). Egg hatching began in mid-June in 2011 and 2012. Since year (χ 2=52.7; df=1; P<0.0001) and grove (χ 2=27.2; df=4; P<0.0001) were found to be significant, all the observations together could not be adjusted into a single curve. The 50 and 90% of hatched eggs varied from 15.4 to 34.3 days and from 41.7 to 56.7, respectively, from the start of the hatching period. Fifty percent of eggs hatched between 1 July and 20 July, depending on the year and grove. During this month, egg hatching increased dramatically, reaching about 90% at the end of July and the beginning of August. Overall, in the first quarter of August, the maximum percentage of eggs hatched was reached (fig. 2). The emergence of nymphs occurred quickly and was synchronized; consequently, in 15 days, nearly all eggs hatched. From the end of August until early October, a small proportion, below 5.2%, of females with crawlers was detected (fig. 1). These crawlers evolved into a small number of nymphs during winter (fig. 1). This proportion was higher in 2010, coinciding with higher July temperatures compared with 2011 and 2012 (25.3±0.1 °C, 23.6±0.2 °C and 23.5±0.2 °C, respectively). Females with crawlers were observed for two and a half months, from late June until the end of August, with a maximum in mid-July (fig. 1). From mid-June to mid-July, first instars emerged, with a maximum corresponding to late July, and in September to October, this instar disappeared. Second instars appeared in July and remained until October to November, with a maximum in early August to mid-September. These two instars are considered to be the most sensitive to pesticides, and their maximum number occurred in August in all years and groves (fig. 1). During May and June, the proportion of first and second instars in the population was almost negligible, and during June, the population was composed only of females.

Fig. 2. Cumulative percentages of C. sinensis egg hatching in the five citrus groves in 2010, 2011 and 2012.
Parasitism complex and seasonal trend of parasitoids
In all samples, from 68,443 individuals of C. sinensis (L1: 9356; L2: 12,809; L3: 23,735; females: 31,899), we obtained a total of 1416 adults of Hymenoptera parasitoids belonging to four species and families: Coccophagus ceroplastae (Aphelinidae), M. helvolus (Encyrtidae), Scutellista caerulea (Pteromalidae) and A. ceroplastae (Eulophidae) (table 2).
Table 2. Relative abundance of parasitoid species emerging from C. sinensis from six citrus groves.
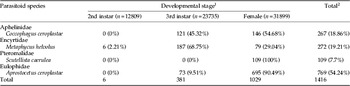
1 In brackets, the percentage of each parasitoid species respect to the developmental stage.
2 In brackets, the percentage of each parasitoid species respect to the total emerged.
The most abundant species was A. ceroplastae, corresponding to 54% of emerged parasitoids. Coccophagus ceroplastae and M. helvolus represented 19%, and S. caerulea 8% of the total (table 2). Although C. ceroplastae was found in all groves, it only represented an important percentage, 34% of all parasitoids emerging, in one grove, ‘Müller’. In the other groves, it did not exceed 5%.
Although all four species were found in the six groves, species composition varied with the grove: in ‘Sant Rafel’ and ‘Gravera’, located in the south, S. caerulea and M. helvolus predominated, followed by A. ceroplastae, and C. ceroplastae only had a token presence. In ‘Didac’ grove, M. helvolus accounted for over 50% of the parasitoids emerged, followed by A. ceroplastae and S. caerulea and C. ceroplastae represented less than 10% of the total. The presence of A. ceroplastae in ‘Mianes’ and ‘Soldebre’ accounted for over 80% of the total. In ‘Müller’ grove, A. ceroplastae represented more than 50% and C. ceroplastae 34%, whereas the presence of S. caerulea was the lowest, representing only 0.4% of all parasitoids emerged. Notably, S. caerulea was very abundant in ‘Gravera’ and ‘Sant Rafael’, with frequencies of 36 and 45%, respectively, whereas in the remaining groves, its frequency was less than 10% (fig. 3).

Fig. 3. Relative abundance of C. sinensis emerged parasitoids in particular citrus groves.
Regarding the preferential developmental stages for parasitism, 71% of M. helvolus emerged from immature stages, and most emerged from the L3 stage (68.8%). Aprostocetus ceroplastae preferably parasitized females, as 90.5% emerged from them. Coccophagus ceroplastae emerged from L3 and females, with frequencies of 54.7 and 45.3%, respectively. All S. caerulea emerged from females.
Concerning the developmental stage of C. sinensis, all parasitoids that emerged from L2 were M. helvolus males. From the parasitoids that emerged from L3, M. helvolus was the most abundant, representing 49.1%, followed by C. ceroplastae (32%) and A. ceroplastae (19%). Most of the parasitoids that emerged from females were A. ceroplastae, representing 67.5%; the other parasitoids that emerged from females were C. ceroplastae (14.2%), S. caerulea (10.6%) and M. helvolus (7.7%).
As for the seasonal trend of the relative abundance of C. sinensis parasitoid complex, the largest populations of C. ceroplastae occurred in spring and autumn (fig. 4) coinciding with a high percentage of L3 and young females of C. sinensis (fig. 1). The major populations of M. helvolus were obtained from October to April, coinciding with high percentages of L3 and young females of C. sinensis. Aprostocetus ceroplastae was the most stable species, since it was recovered in all months studied (except September 2012). Its population was high from October to December, related to L3 of C. sinensis, and in March to July, coinciding with a high population of C. sinensis females. The population of S. caerulea peaked in July and August and coincided with a high percentage of C. sinensis females with crawlers.
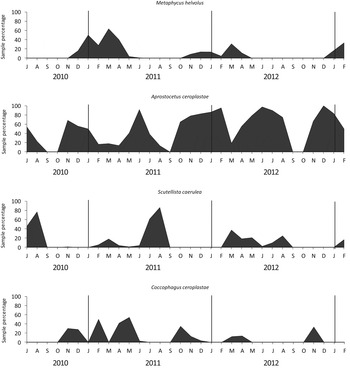
Fig. 4. Relative abundance of C. sinensis emerged parasitoids in six citrus groves from July 2010 to February 2013.
The maximum percentage of emergence observed for L3 of M. helvolus, A. ceroplastae and C. ceroplastae was 17, 14 and 10%, respectively. In the case of females, the maximum percentage of M. helvolus, A. ceroplastae, S. caerulea and C. ceroplastae was 10, 29, 12 and 13%, respectively. For L2, only M. helvolus was found, and the maximum percentage of emergence was 0.6%. In figs. 5 and 6, the mean percentage of emergence of each parasitoid and each developmental stage of C. sinensis throughout the year are shown.
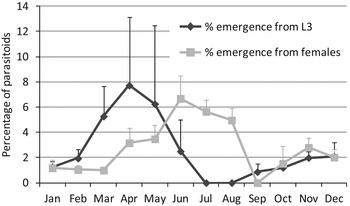
Fig. 5. Mean percentage emergence of parasitoid species from C. sinensis third instars (L3) and females on citrus.
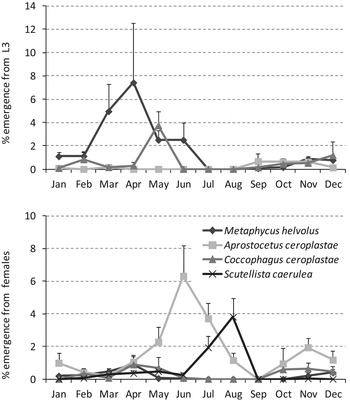
Fig. 6. Average percentage of emergence of each parasitoid species of C. sinensis on citrus: (a) emergence from L3 and (b) emergence from females.
Although the developmental stages were not specified in the female samples for the study of the parasitoid complex, because the biological cycle was studied simultaneously in the same groves, it can be assumed that C. ceroplastae and M. helvolus parasitized younger females, S. caerulea only parasitized females with crawlers and A. ceroplastae parasitized all types of females: young ones, and those with eggs and crawlers.
From the emerging cages, 60 cecidomyiid adults were recovered, mainly from females. These were present throughout the year, except in December, January, and February and the population peaked in June and July.
Spatial distribution patterns of C. sinensis females on twigs
The regression analysis for the relationship of ln(s 2) and ln(m) defined by Taylor's power law indicated a significant relationship, with a high coefficient of determination (R 2=0.97; F=3162.05, df=83, P<0.0001) for females on twigs (fig. 7). The value of Taylor's parameter b was 1.40±0.03 (n=85, Taylor's parameter a=3.81). The slope of the regression line (b) was significantly larger than 1.0 (t=56.23; df=1, 84; P<0.0001), indicating that females of C. sinensis followed an aggregative distribution pattern on twigs.
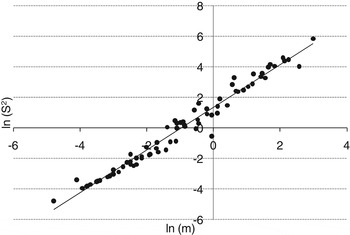
Fig. 7. Linear regression of the scaling relationship between the sample mean and the variance of the number of live C. sinensis females per twig.
Relationship between the number C. sinensis females per twig and the proportion of infested twigs
There was a strong relationship between the mean number of C. sinensis females per twig (m) and the proportion of occupied twigs (p), both for Wilson and Room's binomial expression (Wilson & Room, Reference Wilson and Room1983) and for Kono & Sugino's empirical expression (Kono & Sugino, Reference Kono and Sugino1958), with a′=0.97 and b′=1.27 for the Kono & Sugino formula (R 2=0.97, F=3166.27; df=83; P<0.0001) (fig. 8). The values of the coefficients of determination obtained for the linear regressions between observed and estimated proportions of occupied twigs R 2=0.97 (F=2614.84; df=83; P<0.0001) and R 2=0.91 (F=646.45; df=83; P<0.0001) for the negative binomial and the empirical models, respectively, were high and very similar, showing that both adjustments fitted the data properly.
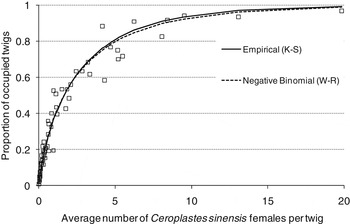
Fig. 8. Empirical and negative binomial relationship between the proportion of twigs invaded by females of C. sinensis and the mean number of females of C. sinensis per twig.
As the number of females increased, the proportion of infested twigs rapidly increased, to about 0.8. Binomial sampling models have upper limits when approaching unity, thus for further increases in female numbers per twig, there were only very small increases in the proportion of the twigs occupied.
Therefore, a mean of 0.2 females per twig corresponded to 12% of twigs with at least one female; 0.5 females per twigs corresponded to 20% of occupied twigs; one female per twig corresponded to 35% of occupied twigs; and five females per twig to 80% of occupied twigs (fig. 8).
Optimum sample size
The sample-size curves used to determine the number of twigs per sample required to achieve the fixed precision of E=0.25, for the enumerative and the two binomial sampling models are shown in fig. 9. The binomial methods resulted in a higher number of sampling units than the enumerative method. Comparing both binomial models, the method based on the NBD gave a lower sample size for populations smaller than seven females per twig. To obtain a precise estimation of the mean of 0.2, 0.5, 1.0 and 5 females per twig, for enumerative sampling, 160, 90, 60 and 23 twigs per grove must be sampled, respectively (table 3). For the binomial method, the number of twigs to sample increases to 245, 160, 140 and 130, respectively, but only the presence of C. sinensis females on the twig has to be recorded, which reduces the analysis time of each twig.

Fig. 9. Optimum sample size at different population densities using enumerative and binomial sampling plans for C. sinensis females on twigs to attain a pre-fixed precision level of E=0.25.
Table 3. Ceroplastes sinensis female population on twigs: relationship between the number of female on twigs and the proportion of invaded twigs. Minimum sample size (#twigs per sample) required to attain a pre-fixed precision level (E=0.25) estimated using the following methods: enumerative, binomial empirical and negative binomial.
Discussion
Ceroplastes sinensis had one generation per year, which followed similar trends in each of the three years and each grove. In general, the literature corroborates our observations about the number of generations per year (Gómez-Clemente, Reference Gómez-Clemente1927; Snowball, Reference Snowball1970; Llorens, Reference Llorens1990; García-Marí et al., Reference García-Marí, Costa and Ferragut1994; Stathas et al., Reference Stathas, Kavallieratos and Eliopoulos2003). Panis (Reference Panis1977) suggested a probable partial second generation. In Australia, Chinese wax scale is monovoltine in the central and south coast regions of New South Wales but might be bivoltine in Queensland (Smith et al., Reference Smith, Beattie and Broadley1997). From our observations, crawler emergence started in July, and until September first instars were observed on leaves. At this point, controversy exists among authors: although Stathas et al. (Reference Stathas, Kavallieratos and Eliopoulos2003) confirm our observations, Llorens (Reference Llorens1990) and Gómez-Clemente (Reference Gómez-Clemente1927) indicate that crawler revival starts in July and continues until August, and García-Marí et al. (Reference García-Marí, Costa and Ferragut1994) indicate that hatching occurs later, from September to October. In Australia, hatching begins in early January, but peaks during February and early March (Smith et al., Reference Smith, Beattie and Broadley1997). In our study, maximum hatching occurred in early August, in a synchronized and concentrated pattern in all groves and years. This point coincided with the maximum number of sensitive first and second instars. From the end of August until early October, a small proportion of non-hatched eggs were detected, thus in winter, a small quantity of first and second instars could be found. These eggs probably entered a state of dormancy or diapause due to high temperatures, and hatched when temperatures decreased. No information about summer diapauses of eggs on soft scales is available. In our opinion, there was no partial second generation. In any case, the proportion of non-hatched eggs was very low and represented a minor proportion of the total population (under 10%).
Third instar stages were present throughout the year except for June and July, and females were present from May to August. Consequently, for most of the year, the population was predominantly composed of stages that were not sensitive to chemical treatments. Pesticides must be applied against the first and second instars to ensure successful control (Flint et al., Reference Flint, Kobbe, Clark, Dreistadt, Pehrson, Flaherty, O'Connell, Phillips and Morse1991). Accordingly, three factors must concur to achieve an optimal efficacy: (1) a maximum of sensitive instars, (2) a maximum of hatched eggs and (3) a minimum presence of new third instars. In Spain, almost every year, Aonidiella aurantii and other dispididae are chemically controlled with sprays in early June, during the maximum presence of sensitive instars of these scales (Campos-Rivela et al., Reference Campos-Rivela, Martínez-Ferrer and Fibla-Queralt2012). At this time, the C. sinensis population is mostly composed of females, the most resistant stage, and thus these treatments are inefficient.
Since C. sinensis is univoltine and the sensitive stages are present for a brief period of time, a single chemical treatment per season would be efficient. In addition, for the same reasons, performing only one sampling per year would be sufficient to estimate the population size. The ideal developmental sampling stage should fulfil three conditions: (a) to allow quick and easy sampling; (b) to remain at this stage for a prolonged period of time; and (c) to be practically the only existing stage during that period (Moreno & Garijo, Reference Moreno and Garijo1980). These authors established different sampling methods on citrus Saissetia oleae, based on the observation of females on twigs.
During June and nearly all of July, only females were found on citrus trees in all groves and years. Each C. sinensis female can lay up to 2000 eggs (Gómez-Clemente, Reference Gómez-Clemente1927). Sampling first and second instars on leaves in the field is relatively inefficient for decision making: they are very numerous, it is difficult to observe whether they are dead or alive, the duration of the presence of sensitive stages is very short and most importantly, at the time of sampling, not all of the eggs might have hatched. Therefore, the optimal sampling time is at the stage of development of females on twigs in June and July, when all third instars have already evolved into young females and the population is composed only of females. Females represent the most easily observable and identifiable stage, and the easiest at which to distinguish whether individuals are alive or dead, and primarily, this stage is a measure of the potential future abundance of the sensitive population on leaves. Mean population densities ranged from 0 to 19.8 females per twig. For soft scales, management programs in Spain usually include different sample sizes, to estimate female or third instar population niches (BOJA, 2002; DOGV, 2012; DOGC, 2013). Furthermore, the only suggested thresholds in the literature are those proposed by Ripollés et al. (Reference Ripollés, Marsá and Martínez1995) of 0.2–0.5 females per twig for soft scales. Considering these values, sampling plans developed for C. sinensis in citrus groves for pest management should target population densities of 12–20% of invaded twigs, equivalent to 0.2–0.5 females per twig. The sample size would be 90–160 twigs per grove for the enumerative plan and 160–245 for the binomial plan.
Aprostocetus, Metaphycus, and Coccophagus are primary parasitoids, and larvae of Scutellista feed as predators on the eggs and young larvae of the coccid under the scale cover. Aprostocetus ceroplastae is a solitary endoparasitoid of the nymphal stages and adult females; it has been recorded in Mediterranean areas and in Spain by Limón et al. (Reference Limón, Meliá, Blasco and Moner1976) and Ripollés (Reference Ripollés1986). Scutellista caerulea, which is regarded as an African species, has been recorded on C. sinensis in Spain by Limón et al. (Reference Limón, Meliá, Blasco and Moner1976) and Ripollés (Reference Ripollés1986). Metaphycus helvolus was introduced into Spain in about 1976 (Llorens, Reference Llorens1990) as a biological control agent of black scale (S. oleae) and now belongs to its parasitoid complex (Tena et al., Reference Tena, Soto and García-Marí2008). Snowball (Reference Snowball1970) recorded this encyrtid species for the first time as a parasitoid of C. sinensis. This study is the first published record of M. helvolus on C. sinensis in Spain. Coccophagus ceroplastae is a cosmopolitan aphelinid present in the old-world tropics, well known mostly as Aneristus ceroplastae (Hayat, Reference Hayat and Gupta1998). It was introduced and established in France against Ceroplastes rusci on citrus and S. oleae (Muzaffar & Ahmad, Reference Muzaffar and Ahmad1977). This study is the first record of C. ceroplastae in Spain.
In conclusion, for the satisfactory control of C. sinensis, it is recommended to sample the citrus grove in July to estimate the population abundance. If the proposal threshold by Ripollés et al. (Reference Ripollés, Marsá and Martínez1995) is reached, egg hatching and the evolution of immature stages should be studied, to determine the maximum hatching and population of sensitive instars. Normally, sprays might be conducted during the first half of August, when there is a high percentage of hatched eggs and the population is largely comprised of forms that are sensitive to treatments.
Four hymenoptera have been found to parasitize C. sinensis, mainly third instars and females. The information provided in this study concerning the parasitoid complex, its seasonal trend, and its relationship to the seasonal phenology of C. sinensis could be very useful for the improvement of the biological control of C. sinensis via conservation, mass rearing, and later releases of these parasitoids. Although further studies have to be conducted to elucidate the impact of these parasitoids, the side-effects of pesticides on them should be determined, as an important component of IPM strategies.
Acknowledgements
We wish to thank Dr Jordi Riudavets and two anonymous referees for critical comments on an earlier version of this manuscript. We are grateful to Rafel Monfort, Àngel Roda and Marçal Pla for their assistance in the laboratory and groves. This study was supported by the Generalitat of Catalunya, Departament d'Agricultura, Ramaderia, Pesca, Alimentació i Medi Natural, Integrated Production Unit.


