


Introduction
Trehalose, a non-reducing disaccharide formed by two glucose molecules linked by a 1α–1α bond, is widely present in bacteria, fungi, plants, and invertebrates (Avonce et al., Reference Avonce, Mendoza-Vargas, Morett and Iturriaga2006) and can be induced under various conditions of stress (Li et al., Reference Li, Ye, Pan, Zheng and Lin2009; Thorat et al., Reference Thorat, Gaikwad and Nath2012; Sánchez-Fresneda et al., Reference Sánchez-Fresneda, Guirao-Abad, Argüelles, González-Párraga, Valentín and Argüelles2013). Trehalose is also referred to as ‘blood sugar’ because of its important functions in insect growth and development (Wyatt, Reference Wyatt1967; Tang et al., Reference Tang, Wei, Chen, Wang and Zhang2012). The molecular characterization of trehalose biosynthetic pathways and corresponding genes in various organisms has revealed at least five biosynthetic pathways for trehalose (Elbein et al., Reference Elbein, Pan, Pastuszak and Corroll2003; Avonce et al., Reference Avonce, Mendoza-Vargas, Morett and Iturriaga2006), which includes TPS/TPP (trehalose-6-phosphate synthase/trehalose-6-phosphate phosphatase), TreY/TreZ (maltooligosyl trehalose synthase/maltooligosyl trehalose trehalohydrolase), TreP (trehalose phosphorylase), and TreT (trehalose glycosyltransferring synthase) pathways (Avonce et al., Reference Avonce, Mendoza-Vargas, Morett and Iturriaga2006). Insect trehalose is mainly synthesized by TPS/TPP (Tang et al., Reference Tang, Chen, Yao, Pan, Xu, Wang and Zhang2010). It has also been reported that insects have two distinct types of trehalase – soluble trehalase (trehalase 1 or TRE1) and membrane-bound trehalase (trehalase 2 or TRE2) – which function was degraded trehalose to glucose (Chen et al., Reference Chen, Tang, Chen, Yao, Huang, Chen, Zhang and Zhang2010a; Tang et al., Reference Tang, Wei, Chen, Wang and Zhang2012; Reference Tang, Wei, Zhao, Shi, Shen, Yang, Xie and Wang2016; Zhao et al., Reference Zhao, Yang, Shen, Liu, Shi, Wang and Tang2016).
Since the first insect TPS gene was discovered and cloned in the fruit fly Drosophila melanogaster in 2002 (Chen et al., Reference Chen, Ma, Behar, Xu and Haddad2002), many TPS homologs have been cloned and reported from a variety of insects, including the cotton bollworm (Helicoverpa armigera) (Xu et al., Reference Xu, Bao, Zhang, Yi and Xu2009), the brown planthopper (Nilaparvata lugens, Stål) (Chen et al., Reference Chen, Zhang, Yao, Zhang, Dong, Tian, Chen and Zhang2010b; Yang et al., Reference Yang, Zhao, Shen, Xie, Wang and Tang2017), the beet armyworm (Spodoptera exigua Hübner) (Tang et al., Reference Tang, Chen, Yao, Pan, Xu, Wang and Zhang2010), the locust (Catantops pinguis Stål) (Tang et al., Reference Tang, Zheng, Xu, Zou, Wang, Zhang, Wang and Zhang2011), the German cockroach (Blattella germanica Linnaeus) (Chen & Zhang, Reference Chen and Zhang2015), the Chinese citrus fly (Bactrocera minax Enderlein) (Xiong et al., Reference Xiong, Wang, Deng, Pu, Fan and Liu2016), and the Colorado potato beetle (Leptinotarsa decemlineata Say) (Shi et al., Reference Shi, Xu, Sun, Mu, Guo and Li2016). Moreover, two TPS genes in B. germanica (BgTPS1: KR050213 and BgTPS2: KR050214) and in N. lugens (NlTPS1: GQ397450 and NlTPS2: KU556826) have been cloned (Chen & Zhang, Reference Chen and Zhang2015; Yang et al., Reference Yang, Zhao, Shen, Xie, Wang and Tang2017). Furthermore, some cases of singular TPP genes in insects have been found in GenBank [e.g., the Formosan subterranean termite (Coptotermes formosanus Oshima; JN565075), the fruit fly D. melanogaster (NM_135269), and the diamondback moth (Plutella xylostella Linnaeus; XM_011559193)]; however, it is shorter than TPS, contains one TPP domain, and is highly similar to the TPS of each respective species, with only a few differences in protein sequence at the N-terminus.
The chitin biosynthesis pathway is vital to insect growth and development, and includes trehalases (TRE), hexokinases (HK), glucose-6-phosphate isomerase (G6PI), glutamine-fructose-6-phosphate aminotransferase (GFAT), and chitin synthase (CHS) (Tang et al., Reference Tang, Chen, Yao, Pan, Xu, Wang and Zhang2010; Chen et al., Reference Chen, Zhang, Yao, Zhang, Dong, Tian, Chen and Zhang2010b). It has been reported that TPS is also vital to insect growth and development. For example, introducing mutations into the TPS gene of D. melanogaster larvae has been shown to be fatal (Chen et al., Reference Chen, Ma, Behar, Xu and Haddad2002). Abnormalities in the molting process have been observed in S. exigua, N. lugens, L. decemlineata, and B. minax as a result of TPS inhibition (Tang et al., Reference Tang, Chen, Yao, Pan, Xu, Wang and Zhang2010; Chen et al., Reference Chen, Zhang, Yao, Zhang, Dong, Tian, Chen and Zhang2010b; Shi et al., Reference Shi, Xu, Sun, Mu, Guo and Li2016; Xiong et al., Reference Xiong, Wang, Deng, Pu, Fan and Liu2016; Yang et al., Reference Yang, Zhao, Shen, Xie, Wang and Tang2017). As TPS is known to be vital to insect growth and development, the present study investigated the putative functions of TPS in Tribolium castaneum using RNAi via the injection of double-stranded RNA (dsRNA) corresponding to conserved TPS and TPP structure. In this study, we aimed to (a) synthesize dsRNA fragments from the conserved domains of TPS-1 and TPS-2 from the TPS sequence of T. castaneum (TcTPS: XM_970683, fig. 1), (b) analyze the functions of the TPS gene using RNAi, and (c) assess the viability of this technique for use as a potential method of pest control for T. castaneum, especially via the chitin synthesis pathway.

Fig. 1. Nucleotide and deduced amino acid sequences of Tribolium castaneum trehalose-6-phosphate synthase (TPS). Both initiation and termination codons are indicated by bold typeface and italic. Two conserved domains used for dsRNA synthesis of TP S (751–1362 bp) and trehalose-6-phosphate phosphatase (TP P) (1897–2308 bp) are shaded in gray. qRT–PCR primers sequences used to detect TPS-1 and TPS-2 are indicated by bold typeface and gold-colored shading. The two glycosylation sites are boxed.
RNA interference (RNAi) is widely used to study gene function by suppressing gene expression via the injection of dsRNA (Fire et al., Reference Fire, Xu, Montgomery, Kostas, Driver and Mello1998). RNAi technology also has been widely used to investigate the functions of essential genes in insects (Tomoyasu & Denell, Reference Tomoyasu and Denell2004; Chen et al., Reference Chen, Tian, Zou, Tang, Hu and Zhang2008; Gong et al., Reference Gong, Luo, Rizwan-ul-Haq and Hu2012; Wang et al., Reference Wang, Zhu, Li, Chen, Lai and Fu2017; Zhang et al., Reference Zhang, Liu, Ma and Zhao2013; Asokan et al., Reference Asoka, Chandra, Manamohan and Kumar2013; Qi et al., Reference Qi, Su, Lu, Liu, Liang and Cheng2015), and has been particularly employed to silence vital genes (Belles, Reference Belles2010; Liu et al., Reference Liu, Ding, Zhang, Yang and Liu2010; Wang et al., Reference Wang, Fan, Huang, Xue, Wu, Bao, Xu, Zhu, Cheng and Zhang2012). Similar studies using RNAi have resulted in diverse malformed phenotypes in insects and show varying efficiencies in the insect tissues investigated (Zhu et al., Reference Zhu, Arakane, Beeman, Kramer and Muthukrishnan2008; Belles, Reference Belles2010; Scott et al., Reference Scott, Michel, Bartholomay, Siegfried, Hunter, Smagghe, Zhu and Douglas2013; Xi et al., Reference Xi, Pan, Ye, Yu, Xu and Zhang2015). The red flour beetle (T. castaneum, Herbst 1797; Coleoptera) is a holometabolous insect with embryonic, larval, pupal, and adult stages, and is considered to be a serious pest of stored grains (Adarkwah et al., Reference Adarkwah, Obeng-Ofori, Buttner, Reichmuth and Scholler2010). Several studies have revealed that RNAi in T. castaneum is efficient in maintaining the silencing effect for a longer period and inducing a higher rate of deformations (Chen et al., Reference Chen, Tang, Chen, Yao, Huang, Chen, Zhang and Zhang2010a; Xi et al., Reference Xi, Pan, Ye, Yu, Xu and Zhang2015), even in the postembryonic stages (Tomoyasu & Denell, Reference Tomoyasu and Denell2004; Arakane et al., Reference Arakane, Muthukrishnan, Kramer, Specht, Tomoyasu, Lorenzen, Kanost and Beeman2005; Minakuchi et al., Reference Minakuchi, Namiki, Yoshiyama and Shinoda2008, Reference Minakuchi, Ohde, Miura, Tananka and Niimi2015). Previous studies have also shown that T. castaneum is an effective and reliable insect for conducting RNAi research (Noh et al., Reference Noh, Beeman and Arakane2012; Tang et al., Reference Tang, Wei, Zhao, Shi, Shen, Yang, Xie and Wang2016).
Materials and methods
Insect rearing
The experimental beetle populations of T. castaneum were raised in whole-wheat flour with 5% yeast powder in the dark at 30 °C (Minakuchi et al., Reference Minakuchi, Namiki, Yoshiyama and Shinoda2008; Reference Minakuchi, Ohde, Miura, Tananka and Niimi2015). Developmental stages were synchronized by providing fresh coarse wheat bran to replace old coarse wheat bran daily, while the old coarse wheat bran mixture (containing T. castaneum eggs) was cultured for future experiments.
RNA extraction, cDNA synthesis, and cloning of TPS
Total RNA was extracted from the whole body of T. castaneum larvae or adults using TRIzol reagent (Life Technolodies, Carlsbad, California, USA) following the manufacturer's instructions. The RNA concentration was determined by measuring the absorbance at 260 nm using a spectrophotometer (NanoDrop™ 2000, Thermo Scientific, Waltham, MA, USA). Purified RNA was stored at −80 °C for future experiments. First-strand cDNA synthesis was performed using the PrimeScript® RT reagent Kit with gDNA Eraser (TaKaRa Bio Inc., Dalian, China) according to the manufacturer's protocol.
Primers were designed using a cDNA template according to TcTPS (XM_970683). A primer pair – TcTPS-F and TcTPS-R – was designed to amplify the open reading frame (ORF) of TcTPS (table 1). The reaction mixture included 10× polymerase chain reaction (PCR) buffer with 0.1 mM dNTPs, 0.2 µM of each primer, and 0.5 U HiFi Taq DNA polymerase (TransGen Biotech, Beijing, China), for a total of 25 µl. PCRs were performed according to the following conditions: 10 min at 94 °C; followed by 30 cycles of 30 s at 94 °C, 30 s at 55 °C, and 160 s at 72 °C and a final extension at 72 °C for 10 min. Products were analyzed by agarose gel electrophoresis. Bands corresponding to the expected size (approximately 2500 bp) were excised and purified using a DNA gel extraction kit (Omega Bio-Tek, Inc., Norcross, Georgia, USA). Purified DNA was ligated into the pMD18-T vector (TaKaRa Bio Inc., Dalian, China) and sequenced.
Table 1. Tribolium castaneum-specific primers used in this study and GenBank accession no. for each sequence.
Tissue-specific expression of TcTPS using quantitative real-time PCR (qRT–PCR)
Tissue-specific expression of the TPS conserved domains sequences was analyzed via qRT–PCR using gene-specific primers for qTcTPS-1 and qTcTPS-2 (table 1). The epidermis (Ep), midgut (Mg), Malpighian tubules (Mt), and fat body (Fb) from larvae of last-instar larvae were dissected in a saline solution (0.75% NaCl) and stored at −80 °C for future analyses. Total RNA was isolated from these tissues and reverse transcribed into cDNA as previously described. Expression was detected using qRT–PCR with the Bio-Rad CFX96™ system (Bio-Rad Laboratories, Redmond, Washington, USA) and SsoFast™ Eva Green Supermix (Bio-Rad Laboratories) according to the manufacturer's protocol. Each reaction was performed in a final volume of 20 µl, containing 1 µl cDNA sample (or standard), 1 µl (10 µmol µl−1) each primer, 7 µl RNase-free and DNase-free water, and 10 µl SsoFast™ Eva Green Supermix. The thermocycler profile was as follows: 3 min of initial denaturation at 95 °C; 40 cycles of denaturation at 95 °C for 5 s, annealing at 55–62.5 °C for 20 s; and melting curve performed at 65–95 °C (according to the instructions for SsoFast™ Eva Green Supermix). Standard curves were obtained using tenfold serial dilutions of pooled total RNA. In addition primers specific to T. castaneum β-actin (Tcβ-actin) were used as a control in the qRT–PCR analyses (table 1).
dsRNA synthesis from the conserved domains of TPS-1 and TPS-2 and subsequent injection
The two conserved domains (TPS-1 and TPS-2) from TcTPS were used as target sequences in dsRNA production (fig. 1). The lengths of the resulting TcTPS-1 and TcTPS-2 dsRNAs were 612 and 412 bp, respectively, corresponding to sites 751–1361 (251–454 aa) and 1897–2308 (633–770 aa), respectively. Two pairs of primers, with the T7 RNA promoter sequence flanking the 5′-ends, were designed according to these regions and synthesized using the T7 RiboMAX™ Express RNAi system (Promega Corporation, Madison, Wisconsin, USA) (table 1). Templates for in vitro transcription were prepared via PCR using gene-specific primers.
The NT-88-V3 series (Nikon Corporation, Tokyo, Japan) micromanipulator system was used for injection. The dorsal side of the first abdominal segment of T. castaneum was selected as the injection point, and 0.5–0.7 µg of dsRNA (3 µg µl−1), targeting TcTPS sequences and green fluorescent protein (GFP) (control) were injected into last-instar larvae (Noh et al., Reference Noh, Beeman and Arakane2012; Tang et al., Reference Tang, Wei, Zhao, Shi, Shen, Yang, Xie and Wang2016).
Insect selection, phenotype observations, and sample collection
Following injection of last-instar insects, 30–50 larvae were pooled as one group for injection as a replicate, and each injection treatment for dsTPS-1, dsTPS-2, and dsGFP was performed in nine replicates. Abnormal insects were observed and counted every 12 h after RNAi treatment (for a total of 72 h). Individuals displaying phenotypic abnormalities were collected at 48 and 72 h post-injection to detect gene expression via qRT–PCR, while some abnormal insects were also collected for the determination of trehalose concentration, chitin content, and trehalase activity.
Determination of chitin content
The abnormal larvae of T. castaneum, 48 h post-injection, were used for the determination of chitin content. These insects were first dried in an oven at 50 °C for 4 days, milled to a powder, and weighed. The chitin extraction from T. castaneum was performed as follows: briefly, the powder was treated with 50 ml of 4 M HCl solution at 75 °C for 2 h to remove minerals and catechols. Subsequently, the sample was filtered, and the residue was rinsed thoroughly with distilled water. To deproteinize the sample, the filtrate was treated with 50 ml of 4 M NaOH solution for 20 h at 150 °C. The mixture was filtered and washed repeatedly with distilled water. Finally, the sample was placed in an oven at 60 °C for 24 h to be dried. Thereafter, the dry weight of chitin contents was calculated (Kaya et al., Reference Kaya, Tozak, Baran, Sezen and Sargın2013; Reference Kaya, Lelešius, Nagrockaitė, Sargin, Arslan, Mol, Baran, Can and Bitim2015; Tang et al., Reference Tang, Yang, Shen, Xu, Wang and Wang2017). Additionally isolation chitin samples were led to air-dry in shade at room temperature for 10 days. Then dried samples were weighted and determined (Kaya et al., Reference Kaya, Lelešius, Nagrockaitė, Sargin, Arslan, Mol, Baran, Can and Bitim2015).
Determination of trehalase activities, trehalose, and glucose concentration
The activity of trehalase was determined as described previously with some modifications (Tatun et al., Reference Tatun, Singtripop, Tungjitwitayakul and Sakurai2008; Yang et al., Reference Yang, Zhao, Shen, Xie, Wang and Tang2017). Every 10–15 individuals were homogenized with phosphate buffer (pH 7.0), and the homogenate was centrifuged at 1000g for 20 min at 4 °C. Supernatant (350 µl) was obtained and centrifuged at 20,800g for 60 min at 4 °C. The remaining supernatant was used for the determination of protein concentration, glycogen, and trehalose. The supernatant collected after high-speed centrifugation was used for the determination of trehalase 1 (soluble trehalase) activity and protein content, and the sediment [suspended by phosphate buffer (pH 7.0)] was used for the determination of trehalase 2 (membrane-bound trehalase) activity and protein content. Samples (both supernatant and resuspended pellet) (60 µl) were incubated at 37 °C in the presence of 165 µl phosphate buffer and 75 µl 40 mM trehalose (Sigma-Aldrich Co., St. Louis, Missouri, USA) in a final volume of 300 µl. After 1 h, samples were centrifuged at 12,000g for 10 min at 4 °C, and trehalase activity was determined in 10 µl supernatant using the glucose (Go) Assay Kit (Sigma-Aldrich). The concentration of protein was determined using the BCA protein Assay Kit (Pierce Biotechnology, Rockford, Illinois, USA) according to the manufacturer's protocol.
For glucose measurement, the larvae were homogenized in 0.2 and 0.3 ml of PBS, respectively, after which the glucose levels were measured with GO reagent (Sigma-Aldrich). The trehalose content was determined in 10 µl samples obtained as described above using the anthrone-sulfuric acid method. Another 10 µl of sample, obtained as described above, were incubated at 37 °C for 4 h in the presence of starch glycosidase enzymes, and the glucose content subsequently determined using the glucose (Go) Assay Kit (Sigma-Aldrich) according to the manufacturer's instructions.
Quantification of mRNA expression
The effects of RNAi on the expression of several genes in the chitin biosynthesis pathway were analyzed using qRT–PCR. Total RNA (1 µg) from each sample was reverse transcribed according to the methods as previously described. All primers were designed to determine the expression of the corresponding homologous gene sequences from the chitin synthesis pathway (table 1). The quantification of mRNA expression detection as previously described. In addition, primers specific to Tcβ-actin were used as a control in the qRT–PCR analyses (table 1).
Statistical analyses
The mRNA expression level in the dsGFP-injected groups was designated as controls. All the data obtained in this study are expressed as the mean ± standard error (SE) of 3–6 replicates, and were determined by one-way analysis of variance and Tukey–Kramer HSD (honestly significant difference) test using JMP software (version 7.0.1 for Macintosh; SAS Institute Inc., Cary, North Carolina, USA) (Tang et al., Reference Tang, Qin, Shi, Wang, Guo, Wang and Zhang2014b). Asterisks (*) indicate significant differences in mRNA expression between the dsGFP group and dsTcTPS-injected groups measured at the same time (P < 0.05), while double asterisks (**) indicate highly significant differences (P < 0.01).
Results
Analysis of full-length TcTPS ORF and tissue-specific expression
TcTPS is 2487 bp in length and contains an ORF of 828 aa, and includes conserved TPS and TPP structures (fig. 1). Our results indicate that TPS is composed of approximately 500 aa (from 27 to 497 aa), while TPP contains 242 aa (from 533 to 774 aa). The theoretical TPS protein has an isoelectric point of 6.58 and a molecular weight of 93.07 kDa, has two N-glycosylation sites, and possesses no signal peptides or transmembrane structures (fig. 1). The tissue-specific expression of TcTPS was determined in the midgut, fat body, epidermis, and Malpighian tubules, through qRT–PCR. Our results show that, of the four tissues studied, TcTPS expression was detected in the fat body at a very higher level (fig. 2).
Fig. 2. qRT–PCR analyses of TcTPS in tissues of last-instar larvae of Tribolium castaneum. Two fragments of TPS-1 and TPS-2 have been used to detect the TPS gene expression in four different tissues of T. castaneum. Total RNA was extracted from control group (no any tissues cDNA added, CK), epidermis (Ep), midgut (Md), Malpighian tubules (Mt), and fat body (Fb) tissues and the expression of TPS gene was obtained by qRT–PCR, using Tcβ-actin as the internal control. Primers TPS-1 and TPS-2 correspond to amplicons only TPS-1 domain and only TPS-2 domain, respectively. Values are means ± SEs from three independent measurements.
Efficiency and specificity of RNAi targeting of TcTPS and expression-induced changes in trehalose metabolism
Significant decreases in TPS-1 and TPS-2 expression were observed at 48 and 72 h post-dsTPS-1 (P < 0.01) or dsTPS-2 injection (P < 0.05), respectively (fig. 3a, b). Our results also indicate that while TPS-1 expression was significantly higher 72 h post-dsTPS-2 RNA injection, TPS-2 expression in the dsTPS-1-injected group was higher than in the dsTPS-2 group at 48 h. Furthermore, four soluble trehalase isoforms in T. castaneum, TcTRE1-1, TcTRE1-2, TcTRE1-3, TcTRE1-4, and a membrane-bound trehalase of TcTRE2 genes’ expressional analysis as detected by qRT–PCR, the results showed that their expression decreased significantly at 48 and 72 h, with the exception of TRE1-1 at 72 h in dsTPS-1-injected individuals (fig. 3c, e–g). However, the expression of TcTRE1-2 was increased significantly at 48 h post-dsTPS-1 and dsTPS-2 injection (P < 0.05) (fig. 3d).
Fig. 3. Effects of dsTPS-1 and dsTPS-2 RNAi injection on genes involved in trehalose metabolism in last-instar larvae after 48 and 72 h. This experiment included dsGFP, dsTPS-1, and dsTPS-2 treatment groups. Approximately 30–50 larvae were pooled as one group for injection as a replicate. The mRNA levels of two TcTPS-1, TcTPS-2, and five trehalases (TRE1-1, TRE1-2, TRE1-3, TRE1-4, and TRE2), relative to Tcβ-actin expression, were measured via qRT–PCR. (a–g) indicate TcTPS-1, TcTPS-2, TcTRE1-1, TcTRE1-2, TcTRE1-3, TcTRE1-4, and TcTRE2, respectively. Each point represents the mean ± standard error from dsGFP group and dsTcTPS-injected groups. Asterisks (*) indicate significant differences between dsGFP injection group and dsTPS-1 or dsTPS1-2 injection group (Tukey's method, *P < 0.05, **P < 0.01). TPP, trehalose-6-phosphate phosphatase; TPS, trehalose-6-phosphate synthase.
In addition, trehalose was quantified at 48 and 72 h post-dsTPS-1 and dsTPS-2 RNA injection. These results show that the trehalose content decreased, most notably at 72 h compared with the dsGFP RNA injection group (fig. 4a). Although increases in glucose levels were observed, the differences were not statistically significant (fig. 4b). These results indicate that the trehalose synthesis pathway was effectively inhibited. In addition, the results demonstrate that the activities of both soluble trehalase (trehalase 1 or TRE1) and membrane-bound trehalase (trehalase 2 or TRE2) were decreased post-dsTPS-1 and dsTPS-2 RNA injections (fig. 4c, d). The activity of trehalase 1 was 0.0916 in the dsGFP RNAi treatment group, and was significantly higher at 72 h than both post-dsTPS-1 RNA (0.0684) and dsTPS-2 RNA injection (0.0597) (P < 0.01) (fig. 4c). In addition, trehalase 2 activity was significantly decreased 48 h post-dsTPS-2 RNA injection and 72 h post-dsTPS-1 RNA injection (fig. 4d).

Fig. 4. Trehalose and glucose levels and trehalase 1 (soluble trehalase) and trehalase 2 (membrane-bound trehalase) activities were detected at 48 and 72 h after dsGFP, dsTPS-1, and dsTPS-2 dsRNA injection. Approximately 30–50 larvae were pooled as one group for injection as a replicate. (a–d) indicate trehalose levels, glucose levels, trehalase 1 activity, and trehalase 2 activity, respectively. All Tribolium castaneum larvae were divided into six groups and injected with dsGFP, dsTPS-1, and dsTPS-2. Insects were collected and used to detect trehalose and glucose levels, and trehalase isoenzyme activity after 48 h. Each group had three to five replicates.
Effects of RNAi on phenotype, development, mortality rates, and chitin
The results showed that high mortality and presented various abnormal phenotypes were found in insect when TPS gene expression knockdown by RNAi (fig. 5a). These results indicate that a portion of T. castaneum larvae is not able to complete the molting process. In addition, chitin content was observed to decrease significantly, where the chitin content was 10% in the control (dsGFP RNAi) treatment, and was 8% and 7% in TPS-1 and TPS-2 dsRNA-injected groups at 48 h, respectively (fig. 5b). The abnormality and mortality rates were 26% and 38%, respectively, 72 h post-injection with dsTPS-1 and 31% and 28% at 72 h post-injection, respectively, post-injection with dsTPS-2 (fig. 5c, d). The abnormality and mortality rates of insects injected with dsGFP were 0% and 4%, respectively, at 72 h, and were significantly lower (P < 0.05) than those in the dsTPS-1 and dsTPS-2 treatment groups. Several abnormal molting/deformed phenotypes were observed post-dsTPS-1 and dsTPS-2 injection during development (from larvae to pupae).
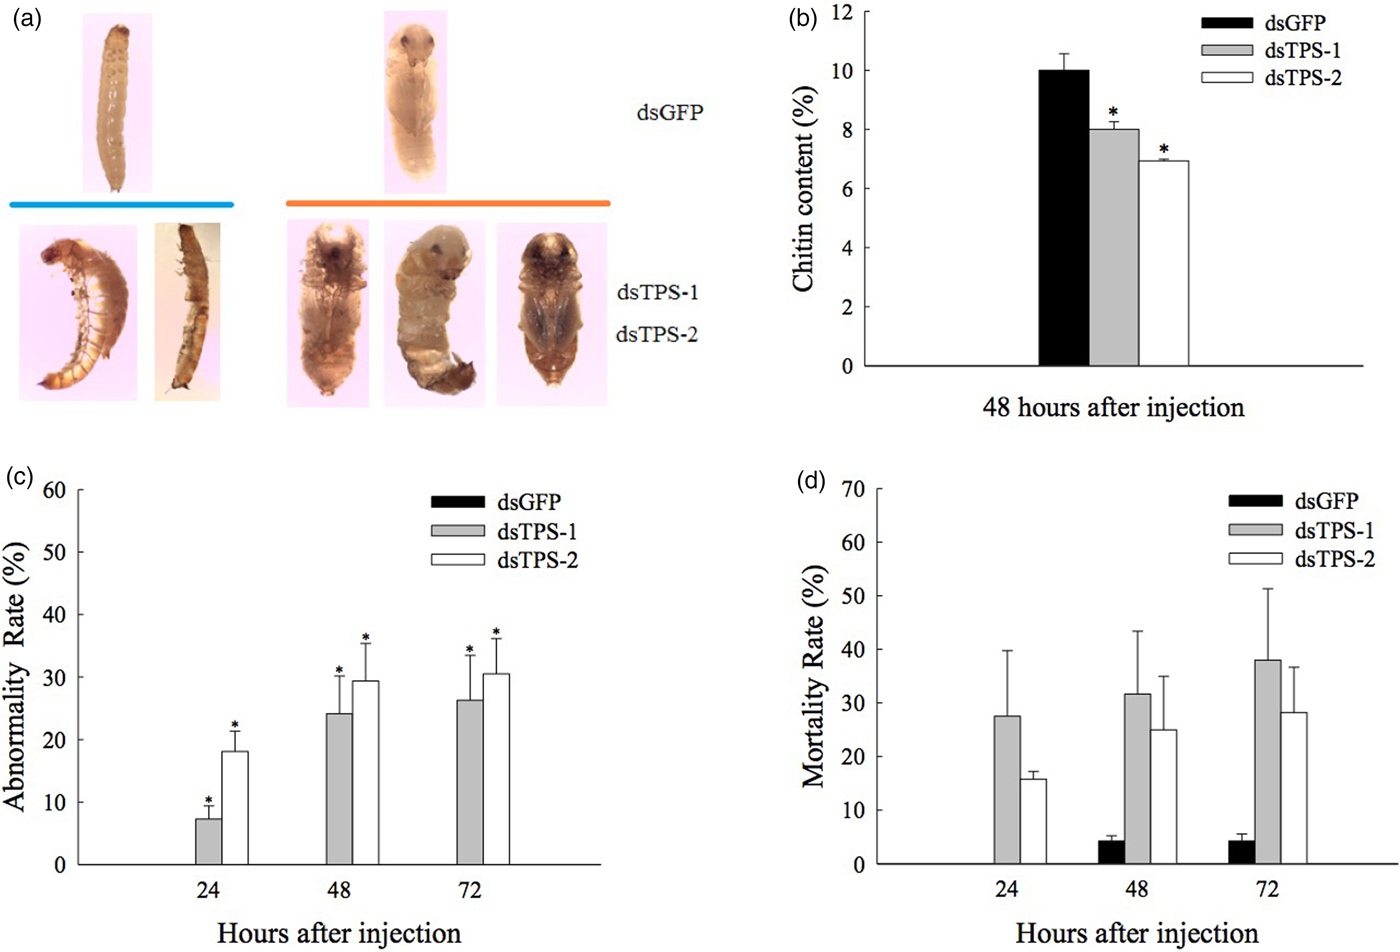
Fig. 5. Phenotypes, abnormality, mortality rates, and chitin content in response to injection with dsTPS-1 and dsTPS-2 RNA fragments in Tribolium castaneum. Approximately 30–50 larvae were pooled as one group for injection as a replicate. (a) Abnormal phenotypes (larvae–pupae). (b) Chitin content changes at 48 h. (c) Abnormality rates. (d) Mortality rates 24–72 h after dsGFP, dsTPS-1, and dsTPS-2 RNA injection. Each point represents the mean ± standard error from dsGFP group and dsTcTPS-injected groups. Asterisks (*) indicate significant differences between dsGFP injection group and dsTPS-1 or dsTPS1-2 injection group (Tukey's method, *P < 0.05, **P < 0.01). GFP, green fluorescent protein; TPS, trehalose-6-phosphate synthase.
Effects of TcTPS RNAi on the gene expression of genes involved in the chitin biosynthesis pathway
Real-time fluorescence qRT–PCR was used to measure the effect of RNAi targeting of TPS-1 and TPS-2 on the mRNA expression of genes related to chitin biosynthesis. The results showed that the expression of the six genes tested (HK2, G6PI, GFAT, PFK, and CHS2) were significantly or extremely significantly downregulated from 48 to 72 h (P < 0.05 or < 0.01, respectively) (fig. 6). The expression of CHS1 significantly decreased at 48 h post-dsTPS-1 injection, and then significantly increased at 72 h, post-injection with dsTPS-2 in comparison to the dsGFP-injected group (fig. 6f).
Fig. 6. Effects of dsTPS-1 and dsTPS-2 RNAi on the expression of chitin synthesis-related genes in last-instar larvae of Tribolium castaneum. Approximately 30–50 larvae were pooled as one group for injection as a replicate. TcHK1 and TcHK2: hexokinases, TcG6PI: glucose phosphate isomerase, TcGFAT: glutamine-fructose-6-phosphate aminotransferase, TcCHS1 and TcCHS2: chitin synthase, TcPFK: phosphofructokinase. The mRNA expression levels were measured via qRT–PCR. Each point represents the mean ± standard error from the dsGFP group and dsTcTPS-injected groups. Asterisks (*) indicate significant differences between dsGFP injection group and dsTPS-1 or dsTPS1-2 injection group (Tukey's method, *P < 0.05, **P < 0.01). TPS, trehalose-6-phosphate synthase.
Discussion
RNAi is an effective and important tool used to study gene function, as well as used to systematically downregulate genes of interest and analyze theirs in a biological process (Yilmazel et al., Reference Yilmazel, Hu, Sigoillot, Smith, Shamu, Perrimon and Mohr2014). However, it is critical that the siRNA specifically targets the expression of the gene of interest but has no off-target effects (OTEs) on other genes (Seinen et al., Reference Seinen, Burgerhof, Jansen and Sibon2011), and some reports have shown that off-targeting can widely occur during RNAi (Nunes et al., Reference Nunes, Aleixo, Barchuk, Bomtorin, Grozinger and Simões2013), especially in Drosophila and mammalian cells (Kulkarni et al., Reference Kulkarni, Booker, Silver, Friedman, Hong, Perrimon and Mathey-Prevot2006; Ma et al., Reference Ma, Creanga, Lum and Beachy2006; Moffat et al., Reference Moffat, Reiling and Sabatini2007; Seinen et al., Reference Seinen, Burgerhof, Jansen and Sibon2010; Reference Seinen, Burgerhof, Jansen and Sibon2011). In the previous reports, one method was described which enables the identification of potential off-targets at a genome-wide level wobble mismatches (Seinen et al., Reference Seinen, Burgerhof, Jansen and Sibon2010). The dsRNAs predictions about OTEs based on sequence similarity: there is a high prevalence of predicted off-targets when this method was used to investigate the occurrence of six genes targets of dsRNA sequences (Seinen et al., Reference Seinen, Burgerhof, Jansen and Sibon2011). Therefore, it is important to ensure that the dsRNA length and corresponding siRNA sequence do not exert OTEs (Moffat et al., Reference Moffat, Reiling and Sabatini2007; Koch & Kogel, Reference Koch and Kogel2014), and it can minimize off-targeting effects by use of highly specific sequences in siRNA and controlling their expression through specific and inducible promoters (Kola et al., Reference Kola, Renuka, Madhav and Mangrauthia2015). In our study, only one TPS gene was found in T. castaneum, and TPS-1 and TPS-2 dsRNA sequences have been blast with the genomic sequence in order to reduce OTEs (fig. 1). Importantly, it is known that human and other mammal species did not synthesize trehalose because it lacks TPS and TPP genes, which can be used as a potential pest control target genes.
To date, multiple TPS genes have been cloned in N. lugens and B. germanica (Chen & Zhang, Reference Chen and Zhang2015; Yang et al., Reference Yang, Zhao, Shen, Xie, Wang and Tang2017), while instances of singular TPP genes can also be found in the NCBI database. In addition, similarly to insects, four TPS isoforms, varying at the 5′ end, have been cloned in the blue crab (Callinectes sapidus Rathbun); however, an analysis of their structures revealed that TPS-mus1 contains TPS and TPP conserved structures, and TPS-mus-1b and TPS-mus-1c contain only one TPS structure (Shi & Chung, Reference Shi and Chung2014). In our study, in the four tissues studied here (epidermis, midgut, fat body, and Malpighian tubule), TcTPS was found to be expressed very higher in the fat body (fig. 2), similar to B. minax TPS, which exhibited the highest levels of expression in the fat body (Xiong et al., Reference Xiong, Wang, Deng, Pu, Fan and Liu2016). However, in S. exigua, TPS was shown to be expressed not only in the fat body and ovary (Tang et al., Reference Tang, Chen, Yao, Pan, Xu, Wang and Zhang2010), but also in the midgut, hemolymph, and leg muscles (Cui & Xia, Reference Cui and Xia2009; Chen et al., Reference Chen, Zhang, Yao, Zhang, Dong, Tian, Chen and Zhang2010b).
In the present study, insect can't complete the molting process because of the inhibition of TPS genes by RNAi (fig. 5a), this result is in agreement with N. lugens and S. exigua TPS genes’ study (Tang et al., Reference Tang, Chen, Yao, Pan, Xu, Wang and Zhang2010; Yang et al., Reference Yang, Zhao, Shen, Xie, Wang and Tang2017), but the mortality rate is different. It has been reported that the inhibition of TPS expression in N. lugens resulted in mortality rates of up to 60% in dsTPS1 RNA groups (2.4 times higher than dsGFP controls), and 25% when subjects were fed the corresponding dsRNA for 10 days (Chen et al., Reference Chen, Zhang, Yao, Zhang, Dong, Tian, Chen and Zhang2010b). The inhibition of TPS expression via dsTPS injection resulted in mortality rates of over 65% in S. exigua, while the mortality of dsGFP-injected individuals was only 10% (Tang et al., Reference Tang, Chen, Yao, Pan, Xu, Wang and Zhang2010). The mortality rates in the present study reached 37.98% and 28.22% when T. castaneum was injected with dsTPS-1 and dsTPS-2 RNA fragments, respectively (fig. 5d). In recent studies, mortality rates of up to 28 and 55% were observed in B. minax and L. decemlineata, respectively, when TPS gene expression was knocked down by RNAi (Shi et al., Reference Shi, Xu, Sun, Mu, Guo and Li2016; Xiong et al., Reference Xiong, Wang, Deng, Pu, Fan and Liu2016). The enzyme trehalase catalyzes the degradation pathway of trehalose, and observations regarding the function of decrease in TRE via dsTPS-1 or dsTPS-2 RNAi show that mortality rates are similar or even higher than those observed in insect studies where TRE expression is inhibited by RNAi in S. exigua (Chen et al., Reference Chen, Tang, Chen, Yao, Huang, Chen, Zhang and Zhang2010a) and in the small brown planthopper Laodelphax striatellus Fallen (Zhang et al., Reference Zhang, Lu, Pu, Wu and Han2012).
In addition, similar abnormal phenotypes, such as molting deformity, have been observed as a result of the knockdown of TRE and TPS genes (fig. 5a; Tang et al., Reference Tang, Wei, Zhao, Shi, Shen, Yang, Xie and Wang2016; Zhao et al., Reference Zhao, Yang, Shen, Liu, Shi, Wang and Tang2016; Yang et al., Reference Yang, Zhao, Shen, Xie, Wang and Tang2017). This indicates that TPS and TRE play a key role, not only in trehalose synthesis, but also in chitin synthesis. Our results show that the content of trehalose decreased significantly at 72 h, while glucose increased slightly at 72 h post-injection with dsTPS-1 and dsTPS-2 RNA (fig. 4a, b). These findings are similar to those observed in B. minax, where the knockdown of the TPS gene resulted in a significant decrease in trehalose and a significant increase in glucose (Xiong et al., Reference Xiong, Wang, Deng, Pu, Fan and Liu2016). Similarly, the trehalose content in the hemolymph, fat body, epidermis, and brain/corpora cardiaca/corpora allata complex of L. decemlineata were significantly decreased when the TPS gene was inhibited by way of RNAi (Shi et al., Reference Shi, Xu, Sun, Mu, Guo and Li2016). However, in N. lugens, trehalose content increased in response to dsNlTPS1 and dsNlTPS2 knockdown, and the activities of both the soluble and membrane-bound TREs decreased, where TRE2 activity was extremely significantly decreased at 48 h (Yang et al., Reference Yang, Zhao, Shen, Xie, Wang and Tang2017). In our study, the activities of TRE1 and TRE2 also decreased (fig. 4c, d), where TRE1 decreased significantly 72 h post-dsTPS-1 and dsTPS-2 RNA injection. At the same time, the trehalase gene expressions were regulated and two trehalase activities changed after TcTPS RNAi. These results indicated that TPS effectively regulates chitin biosynthesis or degradation by the way of TRE. This hypothesis has been confirmed via knockdown of the TPS gene by RNAi in N. lugens, where a portion of genes involved in the chitin biosynthesis pathway and nearly all of the chitinase genes were observed to have decreased expression (Yang et al., Reference Yang, Zhao, Shen, Xie, Wang and Tang2017).
TPS has been shown to play an important regulatory role in insect growth and development, especially in the chitin synthesis pathway (Tang et al., Reference Tang, Chen, Yao, Pan, Xu, Wang and Zhang2010; Chen et al., Reference Chen, Zhang, Yao, Zhang, Dong, Tian, Chen and Zhang2010b). Inhibition of the expression of the four TRE isoforms by injection with dsTPS-1 or dsTPS-2 RNA (with one exception) (fig. 3) indicates that knockdown of TPS results in altered expression of TRE1 and TRE2. In our previous study, we demonstrated that chitin content decreased significantly at 48 h when a trehalase inhibitor validamycin had been injected into N. lugens (Tang et al., Reference Tang, Yang, Shen, Xu, Wang and Wang2017). Likewise, the chitin content also decreased significantly at 48 h in response to dsTPS-1 and dsTPS-2 RNA injection in to T. castaneum larvae in the present study (fig. 5b). Similarly, chitin content decreased significantly at day 8 when the TPS gene was knocked down by RNAi in L. decemlineata (Shi et al., Reference Shi, Xu, Sun, Mu, Guo and Li2016).
It is well known that the chitin biosynthesis pathway is a well-established pathway to target for pest management and control. The discovery and characterization of increasing numbers of important regulatory genes in the chitin biosynthesis pathway will promote the further development of pest management science. Our study shows significant decreases in the expression of chitin content and genes related to chitin synthesis (figs. 5b and 6), although the mRNA expression of CHS1 was not suppressed in response to TPS knockdown (fig. 6f). In the present study, while we observed phenotypes expressing molting deformities in response to TPS inhibition, similar phenotypes were observed in response to the inhibition of genes related to chitin synthesis (Arakane et al., Reference Arakane, Muthukrishnan, Kramer, Specht, Tomoyasu, Lorenzen, Kanost and Beeman2005, Reference Arakane, Specht, Kramer, Muthukrishnan and Beeman2008). Therefore, imbalances in chitin metabolism could result in the molting difficulties observed in T. castaneum in the present study, as the expression of chitinase was not measured. Above all, TPS is a suitable potential pest control gene because it has not been shown to exist in humans and other mammals (Tang et al., Reference Tang, Xu, Zhao, Wang and Zhang2014a).
In conclusion, we provide insights regarding the role of TPS in regulating the chitin biosynthesis pathway, and help to elucidate the molecular mechanisms underlying the gene regulation of chitin synthesis by TPS during the molting process. In future studies, we aim to screen the genes related to the trehalose synthesis pathway via TPS/TPP and provide evidence for their role in the regulation of trehalose synthesis genes in chitin metabolism. In the meantime, the application of inhibitors to prevent trehalose synthesis points toward a promising future in formulating strategies for insect pest control.
Acknowledgements
This study was supported by the National Natural Science Foundation of China (Grant No. 31672081 and 31371996).


