


Introduction
Carabids are an abundant group of predators in farmland and an important component of the beneficial fauna that contributes to biological control of crop pests (Kromp, Reference Kromp1999; Sunderland, Reference Sunderland and Holland2002). The role of carabids in reducing pest populations is affected by their dispersal within and between habitats in the landscape. Hence, spatial movement of carabids has drawn considerable interest (e.g. Bertoncelj and Dolman, (Reference Bertoncelj and Dolman2013), Gordon and McKinlay (Reference Gordon and McKinlay1986), Joyce et al. (Reference Joyce, Holland and Doncaster1999), Kennedy (Reference Kennedy, Desender, Dufrêne, Loreau, Luff and Maelfait1994), Negro et al. (Reference Negro, Casale, Migliore, Palestrini and Rolando2008), Rykken et al. (Reference Rykken, Jepson and Moldenke2011), Zhang et al. (Reference Zhang, Drummond, Liebman and Hartke1997), Baars, Reference Baars1979a ; Wallin & Ekbom, Reference Wallin and Ekbom1988; Lys & Nentwig, Reference Lys and Nentwig1991, Reference Lys and Nentwig1992; Charrier et al., Reference Charrier, Petit and Burel1997). Studies on movement (i.e. the spatial behaviour of individuals) and dispersal (i.e. the spatial redistribution of populations) abound in the literature. Dispersal and movement are related as it is (in part) random movement of individuals that underlies the redistribution in space of a population (Turchin, Reference Turchin1998; Nathan et al., Reference Nathan, Getz, Revilla, Holyoak, Kadmon, Saltz and Smouse2008; Schellhorn et al., Reference Schellhorn, Bianchi and Hsu2014). Several attempts have been made to mathematically model dispersal of carabids under field conditions (Sherratt & Jepson, Reference Sherratt and Jepson1993; Firle et al., Reference Firle, Bommarco, Ekbom and Natiello1998; Westerberg et al., Reference Westerberg, Ostman and Wennergren2005; Benjamin et al., Reference Benjamin, Cedric and Pablo2008).
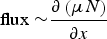
A common starting point for modelling arthropod movement is the assumption that an individual follows a random walk. The consequences at the population level of random walks by individuals can be mathematically modelled with diffusion (Turchin, Reference Turchin1998; Ovaskainen, Reference Ovaskainen2008). Two subtly different diffusion laws are applied in ecology: Fickian diffusion and Fokker–Plank diffusion. Fickian and Fokker–Planck diffusions are similar in the sense that the modelled fluxes are functions of local densities. There is, however, a critical difference in how the flux is expressed. In Fickian diffusion, the flux is proportional to the local density gradient:
 $${\rm flux \sim} D\displaystyle{{\partial N} \over {\partial x}}$$
where D is the diffusion coefficient (m2 d−1), N is the local density (# m−2), and x is space (m). In Fokker–Plank diffusion, the flux is proportional to the gradient in the product of density and motility:
 $${\rm flux \sim} \displaystyle{{\partial \left( {\mu N} \right)} \over {\partial x}}$$
where μ is the motility (m2 d−1). If space is homogeneous (spatially invariant D and μ), the solutions of Fickian and Fokker–Plank diffusions are identical. If μ is spatially varying, the Fokker–Plank diffusion allows a persistent difference in density between adjacent locations, with density proportional to the inverse of the motility, contrary to Fickian diffusion which eventually results in evening out of density differences, irrespective of the spatial variation in D (Turchin, Reference Turchin1998). Given the spatial heterogeneity in real landscapes, and the fact that organisms respond with their movement to local conditions, the usage of Fokker–Plank diffusion rather than Fickian diffusion is advisable (Turchin, Reference Turchin1998).
Many studies on movement ecology of carabids were based on the movement of individuals, whereas some studies quantified dispersal following mass release. Both types of measurement can be used to predict the rate of dispersal, defined as the rate at which a population spreads over space according to random dispersal. The rate of movement in studies on individuals is usually expressed as distance covered per day (L T−1), averaged over a varying time period (e.g. Thiele, Reference Thiele1977; Lys & Nentwig, Reference Lys and Nentwig1991; Holland et al., Reference Holland, Begbie, Birkett, Southway, Thomas, Alexander and Thomas2004), or distance covered in a single day (e.g. Wallin & Ekbom, Reference Wallin and Ekbom1988; Lys & Nentwig, Reference Lys and Nentwig1992). Although daily displacement is easy to interpret and understand, it cannot directly be scaled up to movement at larger time scales, because actual movement has an important random component which is not accounted for in a linear movement rate. Random walk theory predicts that dispersal distance increases with the square root of time (Turchin, Reference Turchin1998; Codling et al., Reference Codling, Plank and Benhamou2008). The distance covered by individuals in a population can be characterized by the variance of the distribution of dispersal distances. This variance increases linearly in time, in proportion to the value of the motility: σ2 = 4μt. Motility is therefore better suited to upscale movement than linear distance, but has in only few cases been estimated from data (Drach & Cancela Da Fonseca, Reference Drach and Cancela Da Fonseca1990; Petit & Burel, Reference Petit and Burel1993; Thomas et al., Reference Thomas, Parkinson and Marshall1998; Bommarco & Fagan, Reference Bommarco and Fagan2002). More often, authors report measures of linear displacement of carabids.
Parameters of the dispersal process can also be estimated using inverse modelling (Ovaskainen, Reference Ovaskainen2008). Inverse modelling is the process of identifying model structure and parameter values from a set of data. It involves the fitting of multiple model versions, each based on different sets of assumptions, to the same data, and the use of information criteria such as Akaike's Information Criterion (AIC), to select the model(s) with the greatest support from the data (e.g. Hilborn & Mangel, Reference Hilborn and Mangel1997; Bolker, Reference Bolker2008). Use of an information criterion in model selection helps to balance goodness of fit with the number of parameters that need to be estimated, and avoid overfitting. The model with the greatest support from the data is interpreted as the set of ecological hypotheses that has the greatest support from the ecological data (Hilborn & Mangel, Reference Hilborn and Mangel1997; Bolker, Reference Bolker2008).
This paper addresses the problem of estimating motility from linear displacement data, and seeks for patterns in motility data reported in the literature. For this, we use meta-analysis. The aims of this paper are twofold. First, we present approximate methods to estimate motility from literature data on linear displacement, and analyse a mass mark–recapture dataset with Pterostichus melanarius in a homogeneous habitat to compare results of inverse modelling with those of mathematical formulas. Secondly, we present an overview of motility estimates based on literature, and ask whether there are consistent differences in movement between carabid species and between habitats, and whether the obtained estimates of motility are affected by the empirical method used to obtain the movement data and the method used to calculate motility from the data. Thirdly, we show how pitfall catch data may be transformed into estimates of density, using the concept of motility.
Materials and methods
In this section, we first give an overview of the movement data reported in literature used for the meta-analysis, explain how motility was approximated from dispersal distances, and describe the statistical analysis of the movement data. Secondly, we describe the experimental design of a mark–recapture experiment with P. melanarius, the Fokker–Planck diffusion model for analysis of these data, the parameter estimation procedure, the boundary conditions used for the numerical solution, and the model selection procedure and statistical methods that were used to discriminate between model variants and calculation of confidence intervals for parameters. Thirdly, we show how the concept of motility may be used to convert pitfall catches of carabids into estimates of density.
Meta-analysis on motility of carabids
Literature search
Studies that report experimental field data on movement or the diffusion rate of carabids were gathered from a review by Brouwers et al. (2009) and by a literature search on ISI web of Science in January 2014. The database was searched for articles with the terms ‘movement’, ‘dispersal’, ‘diffusion’, and ‘motility’ in the topic and ‘carabid*’ or ‘ground beetle*’ in the title. The titles and abstracts of the resulting 295 references were checked for relevant content. Studies were included if they (1) were conducted under field conditions and (2) reported a diffusion coefficient or motility, or reported the mean distance moved and a measure of variability (standard deviation, standard error, or confidence interval) from which the variance of movement distance could be calculated. The variance is needed to calculate motility from measures of linear movement (see below).
The literature search yielded 16 studies in 15 papers that met the inclusion criteria for the meta-analysis (table S1, Appendix A, Supplementary materials). Four studies, including the field study described in this paper, gave a direct estimate of motility and are referred to as the analysis method ‘direct’. The other 12 studies reported a mean net displacement rate calculated over recaptures made in a single day (‘one-day’) or a mean net displacement rate calculated over recaptures made over multiple days (‘multiple-days’). In 8 out of 16 studies, carabid movement was studied with individual mark–recapture. In individual mark–recapture, beetles are individually marked and the moment and location of recapture in a grid of pitfall traps is recorded. Individuals may be re-released after capture. Six of the 16 studies were based on mass mark–recapture, in which no individual marking is done and beetles are released only once. Finally, 2 of the 16 studies used telemetry (harmonic radar or radio tracking) to follow the movement of individual beetles at 15 min intervals during a period of continuous activity.
The four studies that directly estimated motility from movement data used different analytical methods. Drach and Cancela Da Fonseca (Reference Drach and Cancela Da Fonseca1990) and Petit (Reference Petit, Desender, Dufrêne, Loreau, Luff and Maelfait1994) derived motility from the slope of the dispersal gradient. Thomas et al. (Reference Thomas, Parkinson and Marshall1998) derived motility from the slope of the linear relationship between squared displacement distances and time duration between release and recapture (see Equation (2) below). The direct estimate of motility from our own study was obtained by inverse modelling (Section 2.2) and checked with Equation (2) (see below).
Estimating motility from movement distance
The average movement rate, as reported in several studies, is calculated from observed dispersal distances in a mark recapture experiment in an unbounded space as:
 $$\bar r = \displaystyle{1 \over n}\sum\limits_{i = 1}^n {\displaystyle{{d_i} \over {t_i}}} $$
where d i is the distance (from the point of release) at which the ith individual is found at time t i and n is the number of individuals. From the same mark–recapture data motility can be calculated using the random walk theory (Turchin, Reference Turchin1998) with the formula:
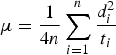 $$\mu = \displaystyle{1 \over {4n}}\sum\limits_{i = 1}^n {\displaystyle{{d_i ^2} \over {t_i}}} $$
In the dataset that we used in the meta-analysis, some studies reported average distance
 $\bar d$
± SE covered in 1 day. In this case, μ was calculated as (see Appendix B, Supplementary materials):
$\bar d$
± SE covered in 1 day. In this case, μ was calculated as (see Appendix B, Supplementary materials):
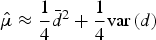 $$\hat \mu \approx \displaystyle{1 \over 4}\bar d^2 + \displaystyle{1 \over 4}{\mathop{\rm var}} {\kern 1pt} (d)$$
The variance was calculated as nSE2, where n is the sample size and SE is the reported standard error of the mean.
Twelve studies reported the average distance covered per day over periods from 1 up to 125 days. None of these studies reported how many beetles were collected on each day. Again, we used Equation (3) to estimate motility from the average movement distance per unit time. The average distance covered per day, calculated over longer time frames than 1 day, is expected to give underestimates of the true distance covered per day because of the less than linear increase of dispersal distance with time. The calculation method of dispersal distance was included in the analysis as a covariable to determine whether the expected bias in estimated μ could be identified from the data.
Statistical analysis
A total of 58 data records was extracted from the 16 studies included in the meta-analysis (table S1, Appendix A, Supplementary materials). These 58 records contained data on 17 carabid species, with 10 species (40 records) associated with open field habitats and 7 species (18 records) associated with forested habitats. Linear mixed models were used to analyse the data. Literature source was used as a random term to account for random effects of study. The explanatory fixed terms of the model were: observation method (individual mark–recapture, 37 records; mass mark–recapture, 14 records; telemetry, 7 records), analysis method (direct, 9 records; one-day, 24 records; multiple-days, 25 records), habitat type (arable land, 40 records; woody habitat, 18 records) and one out of the three variables: species, species grouped according to a size class or grouped according to habitat association. We did not include the three variables related to species in one model to avoid a high degree of collinarity and confounding. Habitat type was grouped according to the major area in which the experiment took place, either farmland with or without margin habitats or woody habitat, i.e. hedgerows or forest patches. The size classes were defined as 10–14 mm (22 records), 15–19 mm (27 records), and 20–32 mm (9 records). For habitat association species were grouped into species associated with forested or open habitat. Values of motility were log transformed to meet the requirement of normality and homoscedasticity. Normality was checked by plotting the ordered residuals vs. quantiles of the normal distribution and homoscedasticity was checked by plotting residuals vs. predictions (Zuur et al., Reference Zuur, Ieno, Walker, Saveliev and Smith2009). Models were ranked according to AIC, corrected for sample size, AICc (Bolker, Reference Bolker2008). A posterior probability (‘degree of belief’) for each model was calculated as exp (−ΔAICc/2) and divided by the sum of exp (−ΔAICc/2) over the considered models (Bolker, Reference Bolker2008, p. 215). For the model with the lowest AICc, significant treatment effects were further explored using pairwise comparisons between treatment levels with Tukey's honestly significant differences (i.e. least significant differences, provided the main effect was significant). All analyses were performed using the Statistical Software package R (R Core Team, 2014), and the packages nmle (Pinheiro et al., Reference Pinheiro, Bates, DebRoy and Sarkar2014), MuMIn (Bartoń, Reference Bartoń2014), multcomp (Hothorn et al., Reference Hothorn, Bretz and Westfall2008), and car (Fox & Weisberg, Reference Fox and Weisberg2011). Specifically, we used the function lme for linear mixed models (package nmle), the function dredge for ranking multiple models with AICc (package MuMIn), the function glht (package multcomp) for making multiple comparisons, and the function qqPlot (package car) for checking normality of the residuals.
Table 1. Ranking of different parameterizations of a linear mixed effect model in a meta-analysis of motility in relation to habitat, species traits, and methods for observation and data analysis. Factor levels are given in the footnote. Literature source was included in all models as a random term. A plus symbol indicates a factor is included in the model. df is degrees of freedom (number of estimated parameters), LL is log likelihood, AICc is Akaike's Information Criterion, corrected for sample size, ΔAICc is the change in AICc compared to the best model, p m is the marginal probability of the model, and model weight is the relative degree of belief assigned to a model. Model weight is calculated as the marginal likelihood p m divided by the sum of the marginal likelihoods (see Bolker, Reference Bolker2008, p. 215).

The following factor levels were distinguished. Habitat type: arable land or woody habitat; Species: species identity, species size class, or species habitat association; Observation method: individual mark–recapture, mass mark–recapture, or telemetry; analysis method: direct, one-day, or multiple-days. To avoid collinearity, maximally one of the factors species, size class, or habitat association was included in the model.
Mark–release–recapture study
A mark–release–recapture study was made in the field to collect data on dispersal and test an inverse modelling framework for estimating motility of P. melanarius. On 26 June 2009, 1000 adult beetles (500 males plus 500 females) were released in a 6 m2 release area in a 50 × 250 m large field of winter triticale (× Triticosecale Wittmack.) undersown with grass–clover at the experimental farm Droevendaal, Wageningen, The Netherlands. Beetles had been collected in the week before release using pitfall traps and had been kept in a dark room at 4°C with defrozen fly maggots (Lucilia caesar) as food. A few days before release, beetles were marked with red nail polish (HEMA, long lasting no. 84). After release, beetles were recaptured with pitfall traps placed in circles of 10, 20, and 30 m radius around the centre of release (fig. 1). At each trapping station, a cross-shaped barrier was placed with three pitfall traps in each quadrant. The numbers of beetles caught per trapping station were counted daily for a period of 2 weeks. Recaptured beetles were removed from the experiment.

Fig. 1. Schematic overview of the layout of traps in the field experiment. At each trapping station a cross-shaped plastic barrier was placed with three pitfall traps in each quadrant.
Fokker–Planck diffusion model for spread
Motility was estimated by fitting an extended Fokker–Planck diffusion model to the mark–recapture data:
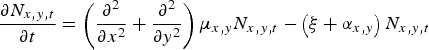 $$\displaystyle{{\partial N_{x,y,t}} \over {\partial t}} = \left( {\displaystyle{{\partial ^2} \over {\partial x^2}} + \displaystyle{{\partial ^2} \over {\partial y^2}}} \right)\mu _{x,y} N_{x,y,t} - \left( {\xi + \alpha _{x,y}} \right)N_{x,y,t} $$
where N x,y,t is the density of beetles at location (x, y) at time t; μ x,y is motility (m2 d−1) at location (x, y); ξ (d−1) is a relative loss rate of beetles due to other causes than recapture (e.g. death or mark wear), hereafter: relative loss rate; and α x,y (d−1) describes the rate of recapture at location (x, y) which we assume to be proportional to density at location (x, y) (Baars, Reference Baars1979b , Turchin & Thoeny, Reference Turchin and Thoeny1993). We call α x,y the relative recapture rate and assume that α x,y is proportional to the motility, μ x,y , of the beetles:
 $$\alpha _{x,y} = \omega _{x,y} \mu _{x,y} $$
where the constant of proportionality ω x,y (m−2), is a measure for trapping efficiency. At locations without traps ω x,y = α x,y = 0. The relative recapture rate α x,y can be interpreted similar to the relative loss rate ξ with the one difference that α x,y is location specific, whereas ξ is the same everywhere.
Model predictions were obtained by numerical integration of Equation (4) using the forward central finite difference method (Press et al., Reference Press, Teukolsky, Vetterling and Flannery2007) on a lattice of grid-cells with mesh size Δx = Δy = 1 m. The time step of integration Δt was one-third of an upper value Δt max obtained using the Von Neumann criterion (Press et al., Reference Press, Teukolsky, Vetterling and Flannery2007):
 $$\Delta t_{\max} \le \displaystyle{{h^2} \over {4\mu + 0.5\,(\alpha + \xi )h^2}} $$
in which h 2 = ΔxΔy.
The simulated field of grid cells was bordered on all sides by a 1-m wide ‘slow-release’ boundary with a reflective outer edge. This slow-release boundary represents in an abstract way the ‘landscape context’ of the experiment. The motility μ0 in this slow-release boundary determines how long beetles are retained outside the field before returning. In this way, the model was allowed to ‘choose’ the most appropriate boundary conditions, from reflective to absorbing, or intermediate. When motility in the boundary strip is small compared with motility in the field, then the boundary strip acts as a semi-absorbent boundary or slow-release boundary. If motility in the boundary strip is zero, then beetles have a zero return probability, resulting in an absorbent boundary. A ratio of motilities in the boundary strip and in the crop field ≫1 will result in a reflective boundary.
Model calibration and model selection
Values of model parameters in Equation (4) were identified by minimizing the negative log-likelihood (NLL) of the data, given the model (Bolker, Reference Bolker2008):
 $$NLL = - \sum\limits_{t,i} {\ln \left( {L\left( {Y_{t,i} \vert f\,(t,i,p)} \right)} \right)} $$
where L is the negative binomial or Poisson likelihood of the data Y t,i given model predictions f at time t and trap location i, based on parameter vector p. The NLL was minimized using a differential evolution algorithm (Storn & Price, Reference Storn and Price1997), implemented in C++ code that is part of the Landscape IMAGES framework (Groot et al., Reference Groot, Jellema and Rossing2010).
The most appropriate boundary conditions and error distribution, and the appropriateness of including a loss term were determined by model selection based on AIC (Hilborn & Mangel, Reference Hilborn and Mangel1997; Van den Hoeven et al., Reference Van den Hoeven, Hemerik, Jansen, Reydon and Hemerik2005; Bolker, Reference Bolker2008). First, the best boundary conditions were determined by comparing AICs of models with absorbing, reflective or slow-release boundaries calibrated to the pooled male and female catches, using a negative binomial error model and optimizing for μ, ξ, and ω. The model variant resulting in the lowest AIC was then also fitted using a Poisson error model. Finally, using the boundary conditions and error model of the model with the lowest AIC we compared models with and without relative loss rate. This was done for male and female beetles separately, in order to verify whether any of the parameters μ, ξ, or ω differed between the sexes. The lower and upper bounds of parameters were found as those values at which the difference in negative log-likelihood with the best fitting model was equal to
 $\chi _1^2 (0.95)/2 = 1.92$
(Hilborn & Mangel, Reference Hilborn and Mangel1997; Bolker, Reference Bolker2008).
$\chi _1^2 (0.95)/2 = 1.92$
(Hilborn & Mangel, Reference Hilborn and Mangel1997; Bolker, Reference Bolker2008).
Estimating population density
The relative recapture rate α x,y (Equation (5)) multiplied by the density of beetles and the time duration of trapping determines the number of beetles caught in a given amount of time. The relative recapture rate was estimated using data of the marked beetles. Its value may be used to estimate the density of unmarked beetles, assuming marked and unmarked beetles have the same relative capture rate. The population density of the natural population at a particular trapping station was therefore calculated as:
 $$N_{{\rm density}} = \displaystyle{{N_{{\rm captured}}} \over {\omega \mu \Delta t}}$$
Results
Meta-analysis on motility of carabids
The habitat in which movement was measured was selected as an explanatory variable in each of the 11 best models, representing together an overall model weight, or posterior probability, of 98.2 % (table 1), underscoring the importance of habitat conditions for movement. Species, on the contrary, had minimal explanatory importance in the model selection. It was selected in the eight worst models, with an aggregate posterior probability ≪0.001 (table 1). The first 11 models that contained habitat type as an explanatory factor further contained one or more of the factors observation method, analysis method, and habitat association as explanatory variables. The model selection does not allow identifying which of these latter factors matter most, because the difference in AICc between the models is smaller than two, indicating that they are not identifiably different (Bolker, Reference Bolker2008). The model with the strongest support from the data (model 1) included habitat type, habitat association of the species, and method of analysis as explanatory variables.
The model with the greatest support from the data (model 1 in table 1) had a degree of belief of 39.4%, substantially greater than the degree of belief of the second and third best models (15.2 and 13.1%, respectively), and much greater than lower ranking models. The best three models all had the habitat in which measurements were made, and the habitat association of the species as explanatory variables. Based on pairwise comparisons of parameters using Tukey's HSD, there was a significant difference in motility between measurements in arable land and woody habitat, with motility 5.6 times higher in arable than in woody (e.g. hedgerow or forest) habitat (z = −4.5; P < 0.001). A significant difference in motility was found between species associated with different habitat associations with motility 2.3 times higher in species associated with forested habitat than in species associated with arable land (z = 2.6; P = 0.01). Beetles associated with forest habitat moved faster than beetles associated with open habitat, both in arable land and in woody habitat (table 2).
Table 2. Average motility ± SE of beetles per habitat in which measurements were made and species’ habitat association according to the meta-analysis.

In the best model variant, there was a significant difference in motility between analysis method ‘one-day’ and ‘multiple-days’. Motility derived from measurements after one day was 3.4 times higher than motility derived from measurements obtained over multiple days, supporting the hypothesis that extending measurements over multiple days would lower estimates of motility based on measurements of linear displacement with Equation (3) (z = 2.8; P = 0.014). The result of analysis method ‘direct’ was intermediate between ‘one-day’ and ‘multiple-days’, and it did not differ significantly from either (z = 1.0; P = 0.64 for the comparison direct vs. multiple-days, and z = 1.6; P = 0.25 for the comparison direct vs. multiple-days).
Estimating model parameters from data using inverse modelling
In total 108 males were recaptured in the mark–release–recapture experiment, vs. 70 females, a significant difference in a binomial test at P = 0.002. Beetles did not disperse in a preferential direction according to the Rayleigh test from circular statistics (r = 0.0673; P > 0.3). A comparison of models with different boundary conditions on the combined dataset of males and females demonstrated no difference in explanatory power between models with reflective, absorbing or slow-release boundaries, or a model with Poisson errors (table S2, Appendix C, Supplementary materials). The model with reflective boundaries and a negative binomial error distribution (model 1, table S2, Appendix C, Supplementary materials) had the lowest AIC and was used for further model selection. A comparison of models with and without a loss term for removal due to recapture demonstrated a lower AIC for the model with a loss term for males and females (models 5 and model 7, respectively, table S2, Appendix C, Supplementary materials). The overall motility (and 95% confidence interval) of the best model (model 1, table S2, Appendix C, Supplementary materials) was 17.9 m2 d−1 (14.8–22.3 m2 d−1). The overall trapping efficiency was 0.253 (0.150–0.425) and the overall loss rate was 0.107 d−1 (0.068–0.144 d−1) (fig. S1, Appendix C, Supplementary materials). The associated motility estimates for male and females (models 5 and 7, table S2, Appendix C, Supplementary materials) were 19.3 m2 d−1 (15.1–25.7 m2 d−1) for males and 15.5 m2 d−1 (11.7–21.9 m2 d−1) for females. The overlapping confidence intervals for the sexes indicate that motility was not significantly different between male and female beetles.
The simulated result of the overall best model (model 1, table S2, Appendix C, Supplementary materials) overestimated cumulative recaptures at 10 m distance during the first week and at 20 m distance at days 5–7, but fell within the 95% confidence margin of the data during the rest of the days (fig. 2). At 30 m distance, model predictions were within the 95% confidence intervals of the data at all times. The spatial distribution of beetles over time is shown in fig. 3. By day 7, about 61% (N = 612) of beetles had been lost due to recapture (N = 120), or due to other factors such as mortality or mark wear (N = 492). The remaining 388 beetles were more or less homogeneously distributed, albeit still with a slightly higher density in the centre of the plot.

Fig. 2. Cumulative number of observed (○) and predicted (x) P. melanarius recaptured over time at 10, 20, and 30 m distance from the release site in the mark–release–recapture experiment. Predictions are made with model 1 (table S2, Appendix C, Supplementary materials). The error-bars indicate 95% confidence limits.

Fig. 3. Time evolution of the distribution of P. melanarius in the mark–release–recapture experiment, simulated by model 1 (table S2, Appendix C, Supplementary materials). Numbers above the figures are the number of beetles in the simulated space. The first panel (day 0) shows the location of trapping stations (x) and the release area (□). For days 1–13 the colour bar in the top right corner indicates beetle density per 1 × 1 m grid cell. *For day 14 the colour bar (bottom right corner) is adjusted to express density relative to the maximum density in the plot.
Densities of the background population of P. melanarius that were also caught in the pitfalls were calculated using Equation (8) with the values for motility and trapping efficiency of the best model (ω = 0.253, μ = 17.9 m2 d−1). During the 14 days timespan of the experiment population density varied between 1.8 ± 0.3 and 9.9 ± 0.6 m−2. To explain these large differences in estimated population size over a relative short period of time we explored a possible influence on the catch of night temperature. Indeed, a positive association between catch and temperature was found (fig. S2, Appendix C, Supplementary materials).
Calculating mean daily dispersal distance and motility from data
In this section, we show three frequency distributions for different measures of dispersal rate of beetles in the mark–recapture experiment. The first distribution shows the daily displacement distance as it is often presented in literature (fig. 4a). The second distribution represents the motility of recaptured beetles (fig. 4b). The last distribution represents a dispersal rate calculated as two times the square root of the motility of an individual (Equation (2); fig. 4c). The latter represents the square root of the mean-squared dispersal distance following a point release, i.e. the standard deviation of the distribution kernel after one day. While the unit of this variable is m d−1/2 and may not be interpreted as a linear rate, the numerical value nevertheless represents the distance an individual would cover in 1 day, while twice this distance would be covered in 4 days, and three times this distance in 9 days. The frequency distribution of the dispersal distance per square root of time is wider and more towards higher values than the frequency distribution in fig. 4a. The mean ± SE (N = 178) of the daily displacement distance in figs 4a and c are 3.4 ± 0.19 and 7.5 ± 0.3 m d−1/2, respectively. The mean ± SE motility calculated from the motility of individual beetles was 17.1 ± 1.3 m2 d−1 (N = 178), similar to the motility estimated from the Fokker–Planck model.

Fig. 4. Three histograms based on the mark–recapture data of the field experiment. (a) Linear distances of recaptured individuals divided by time (m d−1) are characterized by a distribution with a short tail and a high frequency of low daily displacement distances. (b) Motility of recaptured individuals (m2 d−1). (c) Twice the square root of motility (m d−1/2) indicating the root-mean-square displacement per unit of time1/2. See the text for further explanation.
The effect of the time interval between release and recapture on movement rate and motility is illustrated in fig. 5. There is a clear downward trend in the movement rate with increasing duration between release and recapture that approaches an asymptote after 2 weeks. For motility the same downward trend is visible, but it is shallower, and the peak is at day 2. The movement rate determined at the first sampling day was three times higher than the movement rate determined over all days suggesting an effect of the initial release.

Fig. 5. Movement rate (A) and motility (B) calculated from the field data for each recapture day (solid line and open circles) and as a moving average from day 0 till day x (dashed line, open diamond).
Discussion
Analysis of movement data should be consistent with random walk theory to enable scaling up. Calculation of motility satisfies this requirement. In the literature on carabids, movement of carabids has mostly been treated as a linear process in which the estimated movement rate is dependent on the time interval over which it is determined. While reviewing literature on dispersal of carabid beetles we found a large variety of terminology used to describe the dispersal rate, including daily distance covered, minimum distance travelled, mean distance covered, distances moved, distance travelled, and the rate of movement. Here we standardized the available information on movement of carabids by calculating motility and looked for patterns through meta-analysis.
In the meta-analysis, the habitat in which motility was measured and the habitat association of beetle species were the most important variables explaining differences in motility. Species associated with forested habitat moved faster than species associated with open habitat, both in arable land and in forest habitats. Species and size class had no explanatory value. Individual studies, however, show that within habitat types, the movement rate can differ between species (Wallin & Ekbom, Reference Wallin and Ekbom1988; Lys & Nentwig, Reference Lys and Nentwig1991, Reference Lys and Nentwig1992; Wallin & Ekbom, Reference Wallin and Ekbom1994; Holland et al., Reference Holland, Begbie, Birkett, Southway, Thomas, Alexander and Thomas2004). From the data available, we cannot confirm that those species effects in individual studies may be generalized across studies. It is possible that the species differences in individual studies are genuine and general, but the dataset for meta-analysis was too small, and the movement data too variable to identify species effects across studies. An alternative explanation is that differences in motility between species are not general because of a large variability in the movement rate within species. The two possibilities are related and both plausible. The database is limited, and the variability of motility is very large. It is very likely that one species may have different movement responses in different studies because, e.g., of interactions with habitat (Greenslade, Reference Greenslade1964), responses to differences in experimental manipulation (Bommarco & Fagan, Reference Bommarco and Fagan2002), or intrinsic motivation to move in relation to the feeding state, time of the year, or other factors affecting motivation to move (Mols, Reference Mols1993). Further work is needed to elucidate differences between species in their movement responses.
The meta-analysis showed that estimates of motility were biased by the observation method and the method of analysis. These factors were confounded and the bias cannot be exclusively attributed to either of these two factors. The observation method and the method of analysis are both related to the time length of study. The length of time of study was between 1 and 138 days for IMR and MMR but only 1 day for radio tracking and harmonic radar. We illustrated the effect of time length of study on the movement rate and motility for our own field data with P. melanarius. The movement rate and motility decreased with increasing time window over which these variables were estimated. This pattern may be explained from a selective capture of the faster moving individuals from the released population, as faster moving individuals are at greater risk of capture than slower moving individuals. As time increased, fewer and fewer fast moving individuals will be captured, lowering the average movement rate. In addition, data from mark–recapture studies are censored in space due to lack of pitfalls at very large distances. This is likely to result in some negative bias in estimated μ due to underrepresentation of far dispersal in the sample. Following individuals in the open field, i.e. with harmonic radar, should result in unbiased estimates of μ as the distances from all released individuals (slow and fast) are known.
We showed that motility can be calculated from squared displacement distance and the time duration between release and recapture (see Equation (2)) and that this estimate was equal to motility estimated from a Fokker–Planck diffusion model calibrated to the same data. In the first case, motility was calculated as an average over motility of individuals, in the second case motility was estimated from a population density distribution fitted to the recapture data. The similarity in motility between these two very different approaches strengthens the confidence in motility as a suitable concept for quantifying dispersal rate of carabid beetles, and in inverse modelling as a method to retrieve movement parameters from observed patterns. Inverse modelling can also be used in heterogeneous spatial settings in which estimation of μ by averaging of squared displacement across individuals as in Equation (2) is not possible.
From the motility of individual beetles we can calculate a measure for random displacement
 $2\sqrt {\mu t} $
which represents the standard deviation of the dispersal distribution at time t following a point release. Movement rate calculated as a linear process has the unit m d−1 but is inappropriate for scaling up over longer time frames because it is not consistent with the random movement theory. The standard deviation of the dispersal distribution
$2\sqrt {\mu t} $
which represents the standard deviation of the dispersal distribution at time t following a point release. Movement rate calculated as a linear process has the unit m d−1 but is inappropriate for scaling up over longer time frames because it is not consistent with the random movement theory. The standard deviation of the dispersal distribution
 $2\sqrt {\mu t} $
reflects the displacement process in an intuitive way to biologists because it is expressed in metres and the form of the formula, with the square root of time, signals the apparent decay in the rate of random displacement with time. This measure can be used for scaling up movement. In the current study, the standard deviation of the dispersal distribution was 7.5 m after 1 day. Scaling up movement of P. melanarius to cover a whole growing season of 14 weeks would result in a root-mean-squared dispersal distance of 74 m (
$2\sqrt {\mu t} $
reflects the displacement process in an intuitive way to biologists because it is expressed in metres and the form of the formula, with the square root of time, signals the apparent decay in the rate of random displacement with time. This measure can be used for scaling up movement. In the current study, the standard deviation of the dispersal distribution was 7.5 m after 1 day. Scaling up movement of P. melanarius to cover a whole growing season of 14 weeks would result in a root-mean-squared dispersal distance of 74 m (
 $7.5\sqrt {14 \times 7} $
), spanning an area of 1.7 ha if we take 74 m as the radius of a circle. This estimate of area covered is close to the lower limit of 2–7 ha predicted by Firle et al. (Reference Firle, Bommarco, Ekbom and Natiello1998) for this species over the same time period using an individual-based simulation model parameterized on tracking data of movement in the field collected at 15 min time intervals during one activity period. After 30 days the expected mean dispersal distance of P. melanarius is 41 m, which is in accordance with the observation of Thomas et al. (Reference Thomas, Parkinson and Marshall1998) in a large mark–recapture experiment that few individuals dispersed further than 50 m in 30 days. With motility and its associated true daily dispersal distance we thus can compare the results between studies beyond the scale at which the observations were taken.
$7.5\sqrt {14 \times 7} $
), spanning an area of 1.7 ha if we take 74 m as the radius of a circle. This estimate of area covered is close to the lower limit of 2–7 ha predicted by Firle et al. (Reference Firle, Bommarco, Ekbom and Natiello1998) for this species over the same time period using an individual-based simulation model parameterized on tracking data of movement in the field collected at 15 min time intervals during one activity period. After 30 days the expected mean dispersal distance of P. melanarius is 41 m, which is in accordance with the observation of Thomas et al. (Reference Thomas, Parkinson and Marshall1998) in a large mark–recapture experiment that few individuals dispersed further than 50 m in 30 days. With motility and its associated true daily dispersal distance we thus can compare the results between studies beyond the scale at which the observations were taken.
With information on motility and catch efficiency, it would be possible to estimate population densities from pitfall catch data. Usually, however, the motility will not be precisely known, and the results of the current meta-analysis are not consistent enough to predict motility for different species and environmental conditions and habitats, even if some trends on habitat effects and species traits are apparent. The positive exponential relationship between the pitfall catches and temperature during the night preceding the emptying of the pitfalls (fig. S2, Appendix C, Supplementary materials) indicates a strong and significant temperature effect, qualitatively and quantitatively consistent with results of a meta-analysis by Saska et al. (Reference Saska, van der Werf, Hemerik, Luff, Hatten and Honĕk2012). The results presented here indicate that in future model selection studies, inclusion of temperature effects on catch efficiency might be considered.
Another major challenge in the study of carabid movement is to incorporate habitat heterogeneity and to study the influence of habitat heterogeneity and habitat interfaces on movement (Allema et al., Reference Allema, van der Werf, van Lenteren, Hemerik and Rossing2014). The foundation for a methodology to analyse mark–recapture data from a heterogeneous environment is laid in this study with the evaluation of a Fokker–Planck diffusion model.
The supplementary material for this paper can be found at http://www.journals.cambridge.org/BER
Acknowledgements
We thank Dine Volker, Herman Berghuijs, and Juliette Marsan for contributions to data collection and spatial modelling. This project was financially supported by strategic research funds of the C.T. de Wit Graduate School for Production Ecology and Resource Conservation and was co-funded by the strategic research programme ‘Sustainable spatial development of ecosystems, landscapes, seas and regions’ (KB-01-008-024-ALT). The research leading to these results has received funding from the European Union Seventh Framework Programme (FP7/2007–2013) under the grant agreement no. 265865-PURE.


