


Introduction
Knowing where a pest species could potentially invade and knowledge of its taxonomy are related questions that are critical to effective management of biosecurity risks and pest populations. Knowing where invasive pests can, and cannot persist allows us to identify the natural and other assets at risk, and hence what biosecurity measures may be justified on economic or other grounds (Kriticos et al., Reference Kriticos, Leriche, Palmer, Cook, Brockerhoff, Stephens and Watt2013). In addition to the direct and obvious impacts on the management of pest quarantine, taxonomic uncertainty also impacts on our ability to apply pest risk modelling tools (Bourdôt et al., Reference Bourdôt, Lamoureaux, Watt and Kriticos2013; Kriticos et al., Reference Kriticos, Morin and Webber2014).
The Bactrocera dorsalis (Hendel) complex comprises more than 75 species, and is economically one of the most important pest complexes in global agriculture (Clarke et al., Reference Clarke, Armstrong, Carmichael, Milne, Raghu, Roderick and Yeates2005). Among them are highly polyphagous and highly invasive species (Clarke et al., Reference Clarke, Armstrong, Carmichael, Milne, Raghu, Roderick and Yeates2005), with B. dorsalis (Hendel) itself being regarded as a pest of major biosecurity concern (CABI, 2015; EPPO, 2015). There has been controversy for many years regarding some species of the B. dorsalis complex, in particular the status of Bactrocera papayae Drew & Hancock, Bactrocera philippinensis Drew & Hancock, Bactrocera invadens Drew, Tsuruta & White and B. dorsalis, with various authors suggesting that these species should be considered as one (Tan et al., Reference Tan, Tokushima, Ono and Nishida2011; Krosch et al., Reference Krosch, Schutze, Armstrong, Boontop, Boykin, Chapman, Englezou, Cameron and Clarke2013; San Jose et al., Reference San Jose, Leblanc, Geib and Rubinoff2013). In 2014, B. papayae, B. philippinensis and B. invadens were finally incorporated into B. dorsalis (Schutze et al., Reference Schutze, Aketarawong, Amornsak, Armstrong, Augustinos, Barr, Bo, Bourtzis, Boykin, Cáceres, Cameron, Chapman, Chinvinijkul, Chomič, De Meyer, Drosopoulou, Englezou, Ekesi, Gariou-Papalexiou, Geib, Hailstones, Hasanuzzaman, Haymer, Hee, Hendrichs, Jessup, Ji, Khamis, Krosch, Leblanc, Mahmood, Malacrida, Mavragani-Tsipidou, Mwatawala, Nishida, Ono, Reyes, Rubinoff, San Jose, Shelly, Srikachar, Tan, Thanaphum, Haq, Vijaysegaran, Wee, Yesmin, Zacharopoulou and Clarke2015a , Reference Schutze, Mahmood, Pavasovic, Bo, Newman, Clarke, Krosch and Cameron b ).
In 2003, B. dorsalis was recorded for the first time in Kenya and at that stage it was described as a new species, Bactrocera invadens (Lux et al., Reference Lux, Copeland, White, Manrakhan and Billah2003; Drew et al., Reference Drew, Tsuruta and White2005). The timing and pathway of the invasion of B. dorsalis into Africa remains unclear (Khamis et al., Reference Khamis, Karam, Ekesi, De Meyer, Bonomi, Gomulski, Scolari, Gabrieli, Siciliano, Masiga, Kenya, Gasperi, Malacrida and Guglielmino2009; Vayssières et al., Reference Vayssières, Korie and Ayegnon2009a , Reference Vayssières, Vannière, Gueye, Barry, Hanne, Korie, Niassy, Ndiaye and Delhove2011), but it possibly invaded Africa from the Indian subcontinent and was only discovered in Sri Lanka after its detection in Africa (Drew et al., Reference Drew, Tsuruta and White2005; Schutze et al., Reference Schutze, Mahmood, Pavasovic, Bo, Newman, Clarke, Krosch and Cameron2015b ). After its detection in Kenya, it spread rapidly throughout Africa and by 2005, it had been detected in Senegal, Ghana, Togo, Benin, Nigeria, Cameroon, Sudan, Uganda and Tanzania (Drew et al., Reference Drew, Tsuruta and White2005).
Bactrocera dorsalis is currently found in approximately 40 countries in Africa, including the islands of Madagascar, Cape Verde, Comoros and Mayotte, having spread as far north as Southern Mauritania, Southern Mali, Southern Niger, Southern Chad and Central Sudan, and as far south as Northern Namibia, Northern Botswana, Northern Zimbabwe and Mozambique (De Meyer et al., Reference De Meyer, Mohamed and White2012, with additional data from the fruit fly database held at the Royal Museum for Central Africa; Mguni, Reference Mguni2013; CABI, 2015; EPPO, 2015). In addition, it was recently declared present in the Vhembe district in the Limpopo province of South Africa (IPPC, 2013b ; Manrakhan et al., Reference Manrakhan, Venter and Hattingh2015), and it has been detected in Swaziland (IPPC, 2013a ; CABI, 2015).
Bactrocera dorsalis is of great economic importance to the fruit industry in Africa (Mwatawala et al., Reference Mwatawala, White, Maerere, Senkondo and De Meyer2004, Reference Mwatawala, De Meyer, Makundi and Maerere2006a ). Damage is caused when female flies oviposit under the skin of fruit; subsequently the larvae feed inside the fruit, leading to decay and extensive crop losses (Ekesi & Billah, Reference Ekesi and Billah2007; James & Schiffers, Reference James and Schiffers2007; Vayssières et al., Reference Vayssières, Korie, Coulibaly, Temple and Boueyi2008). The reported occurrence of B. dorsalis in parts of Africa has also resulted in major economic losses due to loss of market access (Ekesi et al., Reference Ekesi, Maniania and Mohamed2011).
It is likely that B. dorsalis will continue to expand its range in Africa given the fragmented agricultural landscape of the continent and the polyphagous and invasive nature of this species. It has been recorded in association with almost 80 host plant species (De Meyer et al., Reference De Meyer, Mohamed and White2012), with mango, Mangifera indica L., guava, Psidium guajava L., loquat, Eriobotrya japonica (Thunb.) Lindley, banana, Musa spp. L. and Citrus spp. L. being the major cultivated hosts in Africa (Ekesi et al., Reference Ekesi, Nderitu and Rwomushana2006; Mwatawala et al., Reference Mwatawala, De Meyer, Makundi and Maerere2006b , Reference Mwatawala, De Meyer, Makundi and Maerere2009; Rwomushana et al., Reference Rwomushana, Ekesi, Gordon and Ogol2008a ; Goergen et al., Reference Goergen, Vayssières, Gnanvossou and Tindo2011). However, Cugala et al. (Reference Cugala, Ekesi, Ambasse, Adamu and Mohamed2014) demonstrated that Cavendish dwarf bananas are not susceptible during the mature green stage at which they are harvested and only becomes susceptible during the later stages of ripening, indicating that bananas may not be one of the most favourable hosts. Being a strong flier (Vayssières et al., Reference Vayssières, Sinzogan, Korie, Ouagoussounon and Thomas-Odjo2009b ) with a high fecundity (Ekesi et al., Reference Ekesi, Nderitu and Rwomushana2006, Reference Ekesi, Billah, Nderitu, Lux and Rwomushana2009), it is highly competitive and has been reported to outcompete the native fruit fly Ceratitis cosyra (Walker) on mangoes in Kenya and elsewhere in Africa (Hala et al., Reference Hala, Quilici, Gnago, N'Depo, N'Da Adopo, Kouassi, Allou, Sugayam, Zucchi, Ovruski and Sivinski2006; Ndiaye et al., Reference Ndiaye, Dieng and Delhove2008; Ekesi et al., Reference Ekesi, Billah, Nderitu, Lux and Rwomushana2009; Rwomushana et al., Reference Rwomushana, Ekesi, Ogol and Gordon2009; Salum et al., Reference Salum, Mwatawala, Kusolwa and De Meyer2014). In Africa, it is generally considered a lowland pest, decreasing in abundance with an increase in altitude (Ekesi et al., Reference Ekesi, Nderitu and Rwomushana2006; Mwatawala et al., Reference Mwatawala, De Meyer, Makundi and Maerere2006a , Reference Mwatawala, De Meyer, Makundi and Maerere b ; Geurts et al., Reference Geurts, Mwatawala and De Meyer2012). In equatorial regions such as Tanzania and Kenya, it has been found to occur at altitudes of above 1600 m above sea level (Ekesi et al., Reference Ekesi, Nderitu and Rwomushana2006; Geurts et al., Reference Geurts, Mwatawala and De Meyer2012).
The potential geographical distribution of B. dorsalis has previously been modelled using two correlative species distribution models (GARP and MaxEnt) trained with known occurrence records in Africa and Asia (De Meyer et al., Reference De Meyer, Robertson, Mansell, Ekesi, Tsuruta, Mwaiko, Vayssières and Peterson2010). Results from the models suggest that B. dorsalis thrives under hot and humid conditions and it appears well suited to an equatorial climate. Although most of the known occurrences in Africa fell within the modelled potential range in the GARP model (De Meyer et al., Reference De Meyer, Robertson, Mansell, Ekesi, Tsuruta, Mwaiko, Vayssières and Peterson2010), the modelled potential range did not include the northern boundaries of the species’ actual distribution in Sahelian areas of countries such as Mali, Mauritania, Niger, Senegal and Sudan. The MaxEnt model showed a much narrower area of suitability, excluding many of the known occurrence records. For instance, large parts of Kenya and Tanzania, where the pest is present, were modelled as being climatically unsuitable for B. dorsalis. These models were based on distribution data for what was then known as B. invadens, including only a subset of the B. dorsalis records in its native region, namely certain records in Sri Lanka, Southern India and Bhutan, and being tested against the records from Africa. The models’ shortcomings were attributed to a lack of known distributional records of the pest in the above-mentioned region and a lack of continuous trapping data to indicate fly abundance in the areas in Africa where the pest does occur (De Meyer et al., Reference De Meyer, Robertson, Mansell, Ekesi, Tsuruta, Mwaiko, Vayssières and Peterson2010).
Hill & Terblanche (Reference Hill and Terblanche2014) used Ecological Niche Factor Analysis (ENFA) to address similar questions to the study reported here. Curiously, the model based on the combined distribution of three of the previously separated species in the B. dorsalis complex, namely B. dorsalis, B. philippinensis and B. papayae estimated a suitable climatic niche extending into implausibly cold and xeric continental climates in Northern and Western Asia, respectively. Hill & Terblanche (Reference Hill and Terblanche2014) also composed a single model for a combination of B. dorsalis, B. invadens, B. philippinensis and B. papayae. Their model for the four previously separated species combined shows some similarities to the GARP model of De Meyer et al. (Reference De Meyer, Robertson, Mansell, Ekesi, Tsuruta, Mwaiko, Vayssières and Peterson2010), but again underestimating the northern and southern limits of B. dorsalis, considering the current distribution within Africa. Unsurprisingly, a better fit to the current distribution of B. dorsalis in Africa was obtained when it was modelled using only distribution records of what was previously known as B. invadens. However, in both models by Hill & Terblanche (Reference Hill and Terblanche2014), Southern Zambia and Zimbabwe are modelled as unsuitable, whereas B. dorsalis does occur in these regions, indicating that the southern boundary of its distribution may be underestimated by these models.
These inconsistencies in the correlative modelling results reinforce the difficulties such models face when dealing with novel climate situations (Webber et al., Reference Webber, Yates, Le Maitre, Scott, Kriticos, Ota, McNeill, Le Roux and Midgley2011). They do not lend themselves to including information on relative abundance and seasonal phenology of the species when estimating species distributions. They rely exclusively on presence data, and are designed to work with temporally static covariates such as the Bioclim variables (Kriticos & Randall, Reference Kriticos, Randall, Groves, Panetta and Virtue2001; Venette et al., Reference Venette, Kriticos, Magarey, Koch, Baker, Worner, Gómez Raboteaux, McKenney, Dobesberger, Yemshanov, De Barro, Hutchison, Fowler, Kalaris and Pedlar2010). Their output is similarly static, so it is not possible to compare phenological observations with the model results. Because they rely on the Bioclim variables, even the diagnostic response curves provided in these models are difficult for an ecologist or biologist familiar with the species being modelled to interpret meaningfully. In contrast, CLIMEX (Hearne Scientific Software Pty Ltd., Australia) (Sutherst & Maywald, Reference Sutherst and Maywald1985; Sutherst et al., Reference Sutherst, Maywald and Kriticos2007) is a semi-mechanistic modelling package that was developed primarily to estimate the potential distribution of invasive species, and to explore the climatic factors that influence population growth or decline. CLIMEX models can be fitted using inductive or deductive methods. Inductive methods can be used to fit biologically relevant climatic stress functions to define the species range limits, adjusting parameter values until the model results agree with species distribution or phenological data. Deductive methods can be used to define parameter values based on direct experimental observations of species responses to experimentally determined climatic factors or to phenological observations.
Prior to undertaking this study, CLIMEX models were developed for B. dorsalis by Stephens et al. (Reference Stephens, Kriticos and Leriche2007) and EPPO (2010) (prepared by the authors Sarah Brunel and Darren Kriticos). The model of EPPO (2010) was based on the model of Stephens et al. (Reference Stephens, Kriticos and Leriche2007). There was a strong overlap between the modelled niches of the two models (Stephens et al., Reference Stephens, Kriticos and Leriche2007; EPPO, 2010). Each model accorded well with the known distribution of the populations being modelled. In both models, extensive areas were modelled as suitable, but had no corresponding location records. This result is to be expected for a species which is actively expanding its range. These areas of apparent model commission error were judged to be plausibly suitable.
The known distribution of B. dorsalis in Africa spans a wide range of climatic conditions, from central tropical Africa, to the arid regions bordering the Sahara desert at the northern boundary of its distribution and the warm temperate climates in the South forming its poleward and altitudinal boundaries. Seasonal phenology data generated across the different climatic regions in Africa in which it is known to occur, allows the CLIMEX growth indices (GI) to be fitted with more confidence, improving our ability to estimate the climatic niche of the species. In this paper, we collected year-round abundance data for B. dorsalis in Africa and combined this information with distribution data from the region to build a CLIMEX Compare Locations model. The CLIMEX model was then applied to all areas outside Africa, including both native and invasive ranges, where B. dorsalis is known to occur, to compare model fit with the independent distribution data in those regions. The validated model was then used to create a global climatic risk map.
Materials and methods
Trapping data
Twenty-three sampling sites across Benin, Ghana, Kenya, Niger, Senegal, Sudan, Tanzania and Zambia were used to measure the distribution and seasonal phenology of B. dorsalis (fig. 1). Sites were selected to span marginally suitable climatic regions based on Köppen-Geiger climate classes (Kriticos et al., Reference Kriticos, Webber, Leriche, Ota, Macadam, Bathols and Scott2012) and according to the availability of monitors to service the traps. Three yellow bucket traps (Chempac [Pty] Ltd., Paarl, South Africa), with the attractant methyl eugenol (Ran Chem Group Ltd., Shanghai, China) and the toxicant Dichlorvos (Acorn Products [Pty] Ltd., Roodepoort, South Africa) were deployed at each location. Where possible, traps were placed mainly in mango trees, in either home gardens or orchards, depending on the availability at the sites. Where mango trees were not available, traps were placed in citrus trees (at some sites in Kenya and Tanzania). In Makutupora village of Dodoma, Tanzania, one trap was placed in tropical almond, Terminalia catappa L., and one trap in lucky nut, Thevetia peruviana (Pers.) K. Schum. The fruit ripening periods of the hosts in which the traps were placed were recorded to be able to compare this with the phenology of the fly, to help interpret the CLIMEX output. Traps were placed at least 400 m apart (two instances), but in most cases the distance between traps was more than 1.5 km. Sampling was continued over a 2-year period, with traps being deployed for a period of 1 week only during each month, with the exception of Zambia, where sampling was only undertaken for 9 months. Only 1 year's data could be used for Wad Madani (Sudan), as Bactrocera zonata (Saunders) had entered the area (Salah et al., Reference Salah, Abdelgader and De Villiers2012), with monitors being unaware of this, and species differentiation took place only during the second year of monitoring. Fresh lures and toxicants were used for every week that sampling was performed.

Fig. 1. Sampling sites used to monitor the distribution and seasonal phenology of Bactrocera dorsalis across different climates in Africa.
At each site, seasonal abundance was estimated by calculating the average number of flies caught per trap for each month. Thus, the fly counts from the three traps per site were averaged for each month, and the data for 2 years (e.g., August 2011 and August 2012) were then again averaged, resulting in 12 monthly abundance values for each site.
Distribution data
Distribution data for B. dorsalis in Africa was obtained from the fruit fly database held at the Royal Museum for Central Africa, Mguni (Reference Mguni2013) and Manrakhan et al. (Reference Manrakhan, Venter and Hattingh2015). Distribution data from areas outside Africa were obtained from Stephens et al. (Reference Stephens, Kriticos and Leriche2007) and Hill & Terblanche (Reference Hill and Terblanche2014).
CLIMEX
The influence of climate on the distribution and abundance of poikilotherms has been well documented (Andrewartha & Birch, Reference Andrewartha and Birch1954, Reference Andrewartha and Birch1984; Woodward, Reference Woodward1987). Much of this understanding has been incorporated into CLIMEX. CLIMEX uses the Compare Locations model to mimic the mechanisms that influence a species’ population growth and survival responses to climate, in order to estimate its potential geographical distribution and seasonal abundance (Sutherst et al., Reference Sutherst, Maywald and Kriticos2007). CLIMEX assumes that a population may experience two types of season each year, those that are favourable for growth and those that are stressful, during which the population will decline (Sutherst & Maywald, Reference Sutherst and Maywald1985; Sutherst et al., Reference Sutherst, Maywald and Kriticos2007). The programme integrates a population's weekly responses to climate and uses these to calculate a number of weekly and annual indices, including annual and weekly growth indices (GIA and GIW, respectively), stress indices (SI) and the ecoclimatic index (EI), which indicates the overall climatic favourability (Sutherst et al., Reference Sutherst, Maywald and Kriticos2007).
CLIMEX includes the option of fitting stress functions for cold, dry, hot, wet, cold–dry, cold–wet, hot–dry and hot–wet SI. In addition to the temperature and moisture stresses, the potential distribution of a species may also be constrained by a minimum length of the growing season measured in degree-days. The annual growth index (GIA) represents the potential for population growth and development and combines the organism's response to temperature, soil moisture and, where relevant, day-lengths and diapause (Sutherst et al., Reference Sutherst, Maywald and Kriticos2007). CLIMEX combines the GI and SI into an overall EI, ranging from 0 to 100 (Sutherst et al., Reference Sutherst, Maywald and Kriticos2007). Assigning classes of suitability to EI values between 0 and 100 is usually an arbitrary process intended to reduce the perceived level of model precision compared with that implied by a percentile score.
CLIMEX provides the user with two distinct data product types: (i) maps of annual summary variables, such as the EI, the GIA or the SI; and (ii) weekly time-series graphs of state variables such as the GIW (Sutherst & Maywald, Reference Sutherst and Maywald1985). The CLIMEX model was constructed by manually, iteratively fitting the stress parameters until the geographical distribution simulated by CLIMEX (EI ≥ 1) coincided with the African distribution (fig. 2), and seasonal phenology as gauged by the trapping data accorded with graphs of GIW (table 1). Relevant biological information (e.g., developmental thresholds and the species’ reaction to different levels of relative humidity) informed the parameter value selection to ensure that they were biologically plausible. Parameters for the temperature and soil moisture GI were mostly informed by reported experimental observations, theoretical knowledge and the phenological observations, aiming to get the start and finish dates, and peak climate suitability at each site to agree with the corresponding patterns of abundance.

Fig. 2. The current distribution of Bactrocera dorsalis (in South Africa, only one location, representative of the Vhembe district, is shown). Native ranges: grey circles; invasive ranges (including the trap sites used for sampling): crosses.
Table 1. CLIMEX parameters used to model the distribution of Bactrocera dorsalis, based on its distribution and seasonal phenology in Africa. Parameters for CLIMEX models by Stephens et al. (Reference Stephens, Kriticos and Leriche2007) and EPPO (2010) are also given as a means of comparison.
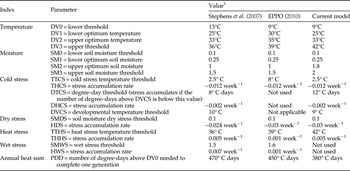
1 Values without units are dimensionless indices of a 100 mm single bucket soil moisture model (0 = oven dry, 1 = field capacity).
The 10′ CliMond climate dataset was used within CLIMEX to represent current climate (Kriticos et al., Reference Kriticos, Webber, Leriche, Ota, Macadam, Bathols and Scott2012). The CM10_1975H_V1.2 dataset of historical long-term monthly climate averages for minimum and maximum temperatures, precipitation and relativity humidity at 09h00 and 15h00 is centred on 1975.
Parameter fitting
The parameter set of the CLIMEX model of B. dorsalis composed by Stephens et al. (Reference Stephens, Kriticos and Leriche2007) was taken as a starting point while building the new model. The model of Stephens et al. (Reference Stephens, Kriticos and Leriche2007) was run with the CM10_1975H_V1.2 dataset, which differs from the original TYN SC2.0 dataset used by Stephens et al. (Reference Stephens, Kriticos and Leriche2007) to fit the B. dorsalis model. Errors in the gridded precipitation data in TYN SC2.0 and the temperature layers in the Worldclim dataset drove the development of the CliMond dataset (Kriticos et al., Reference Kriticos, Webber, Leriche, Ota, Macadam, Bathols and Scott2012). Despite idiosyncratic differences between the CM10_1975H_V1.2 and TYN SC2.0 climatologies (Kriticos et al., Reference Kriticos, Webber, Leriche, Ota, Macadam, Bathols and Scott2012), the new dataset gave a similar output to that published in Stephens et al. (Reference Stephens, Kriticos and Leriche2007), fitting well with the distribution data of B. dorsalis (fig. 2). The B. dorsalis distribution data for Africa were mapped along with the climatically suitable range modelled by Stephens et al. (Reference Stephens, Kriticos and Leriche2007), where EI > 0 (fig. 3), to investigate whether or not the model of Stephens et al. (Reference Stephens, Kriticos and Leriche2007), which was constructed while B. invadens, B. papayae and B. philippinensis were still considered separate species and distribution data for these species were not included, could be used as a departure point for development of a new model for the potential distribution of B. dorsalis. Distribution points for B. dorsalis in the northern boundaries in Africa fell out of the modelled range for B. dorsalis. While climate is the primary range-limiting factor for poikilotherms (Andrewartha & Birch, Reference Andrewartha and Birch1954; Woodward, Reference Woodward1987), climate-modifying factors such as irrigation can also play an important role in extending a species range beyond the limits afforded by climate. Therefore, we hypothesized that the persistence of B. dorsalis in these xeric regions may be predicated on irrigation practices. Hence, we explored Google Earth, looking for spatial patterns that indicated the likely presence of irrigation, and also whether including irrigation provided a better model fit. Further adjustments were made to the B. dorsalis model of Stephens et al. (Reference Stephens, Kriticos and Leriche2007) according to the published information on the temperature thresholds for B. dorsalis, as well as phenological observations made through year-round trapping in Africa (table 1). The parameter set by EPPO (2010) is also given in table 1 as a means of comparison between previous CLIMEX models and the current model.

Fig. 3. The projected climate suitability for Bactrocera dorsalis in Africa, as modelled by Stephens et al. (Reference Stephens, Kriticos and Leriche2007) using the CLIMEX EI and the CM10_1975H_V1.2 dataset. Open circles indicate all occurrence records of B. dorsalis, including the trap sites used for sampling. Unsuitable: EI = 0; marginal: EI = 1–4; suitable: EI = 5–9; highly suitable: EI = 10–29; optimal: EI = 30–100.
Temperature index
The minimum temperature for development (DV0) was set to 9° C, which was in line with results from Rwomushana et al. (Reference Rwomushana, Ekesi, Ogol and Gordon2008b ), who reported lower developmental thresholds of 8.8, 9.4 and 8.7° C for eggs, larvae and pupae, respectively, for B. dorsalis in Africa. The lower optimum temperature (DV1) was set to 25° C, with the optimum temperature (DV2) set to 33° C, being the same as in the B. dorsalis model of Stephens et al. (Reference Stephens, Kriticos and Leriche2007). The maximum temperature for development (DV3) was set to 42° C to model Wad Madani and Singa, Sudan, as suitable during the hot summer months of April and May, when maximum monthly average temperatures rise above 40° C and large numbers of B. dorsalis were trapped. With the lower DV3 values of Stephens et al. (Reference Stephens, Kriticos and Leriche2007) and EPPO (2010) (36 and 39° C, respectively), the Temperature index during these months was zero, which did not allow a positive GIW, even under an irrigation scenario, hence not corresponding with the seasonal phenology data. The number of degree-days per generation (PDD) was set to 380, which was in line with the value of 376 determined by Rwomushana et al. (Reference Rwomushana, Ekesi, Ogol and Gordon2008b ) for B. dorsalis in Africa.
Moisture index
The lower moisture threshold (SM0) was set to 0.1 to indicate the permanent wilting point, which is normally about 10% of soil moisture. The lower optimal soil moisture threshold was set to 0.25 (Stephens et al., Reference Stephens, Kriticos and Leriche2007). The upper optimal soil moisture threshold (SM2) and limiting high soil moisture threshold (SM3) was set to 1.8 and 2, respectively. This improved the modelled GIW in Ziguinchor, Senegal, during August when modelled soil moisture levels reached a maximum value of 1.97, and better fitted observed patterns of high abundance in the trapping data, while with the lower SM2 and SM3 values of the B. dorsalis models of Stephens et al. (Reference Stephens, Kriticos and Leriche2007) and EPPO (2010), the GIW would have been zero during this period.
Cold stress
In Africa, the areas where B. dorsalis does occur do not experience extreme levels of cold. Therefore, the cold stress model of Stephens et al. (Reference Stephens, Kriticos and Leriche2007) was used. Since the DV0 value in the current model was set to 9° C, as opposed to 13° C in the model of Stephens et al. (Reference Stephens, Kriticos and Leriche2007), the degree-day threshold (DTCS) value had to be adjusted from 8 to 12° C days to produce a similar cold stress scenario.
Dry stress
A dry stress scenario similar to that in Stephens et al. (Reference Stephens, Kriticos and Leriche2007) was used with the soil moisture dry stress threshold (SMDS) set to 0.1, and increasing the stress accumulation rate (HDS) from −0.024 to −0.03 week−1 (EPPO, 2010). This resulted in the drier regions of the North African boundary being modelled as unsuitable (e.g., Senegal, Sudan and Niger, where persistence of B. dorsalis is more logically a result of irrigation).
Heat stress
The heat stress scenario was similar to the scenario used by Stephens et al. (Reference Stephens, Kriticos and Leriche2007). However, the heat stress temperature threshold (TTHS) had to be increased from 36 to 42° C to accommodate the higher DV3 value in the current model. The heat accumulation rate (THHS) was kept the same at 0.005 week−1.
Wet stress
Wet stress was not included in the model, as it had minimal impact on the modelled potential distribution and B. dorsalis in Africa reportedly prefers high levels of rainfall and relative humidity (Wih, Reference Wih2008; Vayssières et al., Reference Vayssières, Korie and Ayegnon2009a , Reference Vayssières, Sinzogan, Korie, Ouagoussounon and Thomas-Odjo b ; De Meyer et al., Reference De Meyer, Robertson, Mansell, Ekesi, Tsuruta, Mwaiko, Vayssières and Peterson2010).
Irrigation
The only monitoring sites that were irrigated were those in Senegal, Niger, Sudan and Nguruman in Kenya. The following irrigation scenarios were used according to the timing and frequency of irrigation at the different sites: 2.5 mm irrigation applied as a top-up to natural rainfall during the months of March to July for the Senegal and Niger sites, as well as for El Obeid in Sudan. For Singa and Wad Madani (Sudan), the same scenario was used, but 1.5 mm top-up irrigation was added for the rest of the year. For Nguruman, 2.5 mm top-up irrigation all year round was used. These different scenarios for the different sites were used, as different irrigation practices were followed in the different regions and it provided the best fit with the data. The GIW values were extracted for all sites for comparison with the recorded seasonal phenology data. However, a 2.5 mm year-round top-up irrigation scenario was also applied to the world to produce a risk map contingent on irrigation being practiced in the 10′ cell according to the global irrigation map (Siebert et al., Reference Siebert, Doll, Hoogeveen, Faures, Frenken and Feick2005), producing a composite risk map. In areas where more than zero hectares were under irrigation according to Siebert et al. (Reference Siebert, Doll, Hoogeveen, Faures, Frenken and Feick2005), the EI of the irrigation scenario was mapped, while in areas where zero irrigation is applied, the EI of the non-irrigation scenario was mapped.
Seasonal phenology data
For each of the trapping sites, the seasonal phenology was compared graphically with the GIW values from the model output, and where necessary, the values for the moisture and temperature GI were adjusted to gain concordance between the threshold values (SM0 and DV0) and the seasonal onset of trap catches, the optimal ranges (SM1, SM2, DV1 and DV2) and the period of maximum trap catches.
Results
The potential distribution of B. dorsalis in Africa, in the absence of irrigation, is shown in fig. 4. As with the B. dorsalis model of Stephens et al. (Reference Stephens, Kriticos and Leriche2007), the northern boundaries of the species’ distribution do not fall within the modelled suitable range. This is due to dry stress (fig. 5a), with these areas falling into the arid desert (BWh) and arid steppe (BSh) climates of the Köppen-Geiger climate classification system (Kriticos et al., Reference Kriticos, Webber, Leriche, Ota, Macadam, Bathols and Scott2012). In non-irrigated areas, the seasonal phenology data generally fitted well with the GIW from the model (see figs 6a–c, for examples). In some areas the GIW stayed high for a longer period than the peak in the fly population. An example of this is in Parakou, Benin, where the GIW stayed high until November, but fly numbers peaked during May and declined towards October (fig. 6d). In most sites where irrigation was applied, the fit between GIW and seasonal phenology of the flies was improved compared with a natural rainfall scenario (see, e.g. figs 6e–g). However, at some irrigated sites, e.g., Thiès and St Louis, Senegal, a better fit was obtained using the natural rainfall scenario (figs 6h, i). For the remaining sampling sites, the graphs of seasonal phenology data and GIW are shown as Supplementary material (Supplementary Figure S1).

Fig. 4. The projected climate suitability for Bactrocera dorsalis in Africa in the absence of irrigation using the CLIMEX EI. Open circles indicate all occurrence records of B. dorsalis, including the trap sites used for sampling. Unsuitable: EI = 0; marginal: EI = 1–4; suitable: EI = 5–9; highly suitable: EI = 10–29; optimal: EI = 30–100.

Fig. 5. Annual (a) dry stress (DS) and (b) cold stress (CS) indices for Bactrocera dorsalis. Open circles indicate all occurrence records of B. dorsalis, including the trap sites used for sampling.

Fig. 6. Seasonal phenology, as the average number of Bactrocera dorsalis caught per trap per month over the 2-year sampling period, and CLIMEX weekly growth indices (GIW), as projected by the CLIMEX model. White columns: flies per trap; solid black line: GIW without irrigation; dotted black line: GIW with top-up irrigation (2.5 mm year-round for Nguruman; 2.5 mm from March to July for El Obeid, Thiès and St Louis; 2.5 mm from March to July, as well as 1.5 mm for the rest of the year for Wad Madani); red arrows: period during which main fruit hosts were in a stage of ripeness susceptible to damage by B. dorsalis (other hosts may also have been present, without the susceptible period being recorded).
The potential global distribution in the absence of irrigation is shown in fig. 7a (see fig. 2 for differentiation between native and invasive ranges for B. dorsalis). The main limiting factors in their distributions are dry and cold stresses (figs 5a, b). The potential global distribution when 2.5 mm irrigation is added as a top-up to natural rainfall is shown in fig. 7b. All the data points in the northern boundary of the distribution of B. dorsalis in Africa accord with the modelled suitable range of the species. Fig. 7c gives a composite risk map, based on areas across the globe considered to be under irrigation according to Siebert et al. (Reference Siebert, Doll, Hoogeveen, Faures, Frenken and Feick2005). Here, some of the occurrence points in the northern boundary of the distribution of B. dorsalis in Africa fall out of the modelled range. In all three scenarios (figs 7a–c), all data points for B. dorsalis outside Africa also fall into the climatically suitable zone, with the exception of one location point in California, and one location point in Bhutan, where modelled cold stress prevents persistence (fig. 5b). However, there are a few sites in China in the Hubei, Jiangsu, Chongqing, Guizhou and Hunan provinces, from which B. dorsalis has been recorded (Wu et al., Reference Wu, Li, Bin, Shen, He, Luo, Ma and Lin2011; Shi et al., Reference Shi, Kerdelhué and Ye2012; Wan et al., Reference Wan, Liu and Zhang2012) and which do not fall into this climatically suitable zone. These records were not included in the model validation and omitted from the figures, as the georeferencing of some of the records in these datasets was estimated, as opposed to being exact recordings, while others were erroneous. In addition, the majority of the records in these provinces lie along riverbeds, where (i) the climate may possibly not be represented by the courser resolution of the climatic dataset; and (ii) the records possibly represent ephemeral populations, suitable for B. dorsalis only during favourable seasons. The natural rainfall and composite risk maps (figs 7a, c) indicate the tropical climates (Af, Am and Aw) to be most suitable, while with an all year-round irrigation scenario across the globe (fig. 7b), high suitability is indicated in most areas where cold stress is not experienced.

Fig. 7. The projected global climate suitability for Bactrocera dorsalis, (a) without irrigation, (b) with 2.5 mm top-up irrigation all year round and (c) with a composite risk irrigation scenario (where areas are not under irrigation, the EI of the natural rainfall scenario is mapped, while with areas under irrigation the EI of the irrigation scenario is mapped), using the CLIMEX EI. Open circles indicate all occurrence records of B. dorsalis, including the trap sites used for sampling. Unsuitable: EI = 0; marginal: EI = 1–4; suitable: EI = 5–9; highly suitable: EI = 10–29; optimal: EI = 30–100.
Discussion
It is clear that B. dorsalis is adapted to a wide range of climates. As long as irrigation is applied to alleviate the detrimental effects of dry stress, the main limiting factor appears to be cold stress, which makes a large part of the northern hemisphere unsuitable. Host availability also appears to play an important role in seasonal phenology. This possibly explains the reason why anomalies were observed between the GIW and fly counts in Parakou, Benin, and other sites, where the GIW was high for extended periods, which was not reflected by the pattern of fly counts. In Parakou, for instance, the period during which mangoes persisted on the trees in a stage of ripeness that makes it susceptible to fruit fly damage was from April to June (also see Vayssières et al., Reference Vayssières, Korie, Coulibaly, Temple and Boueyi2008), which may explain why the numbers started to decline in the later stages of a climatically suitable period stretching from April to November. Host availability can also explain the better fit that was obtained in some of the irrigated sites between seasonal phenology and GIW of a natural rainfall scenario versus the GIW of an irrigation scenario. For instance, in Thiès, Senegal, the period with susceptible mangoes on the trees was from June to October, which matched the phenology of the fly. Irrigation applied during March–May did not influence the phenology of the fly, due to a lack of hosts, and the high GIW during this period will not match the phenology of the fly populations.
The known occurrence records for B. dorsalis in Africa that fall out of the modelled range in the composite risk map may be a result of an incomplete dataset, with inadequate information on which areas are irrigated globally and not including all areas bordering the Sahara. It may also be that some of the occurrence records in this region represent reported occurrences of the species during favourable seasons only, and do not indicate year-round persistence. However, in El Obeid, Sudan, which falls out of the modelled suitable range in the composite risk map, flies were active almost all year round, indicating that this region is climatically suitable and that the dataset by Siebert et al. (Reference Siebert, Doll, Hoogeveen, Faures, Frenken and Feick2005) used for the composite risk map, which does not show this site to be irrigated, is incomplete, at least for this region.
In the current model, only two B. dorsalis occurrence records that were used for model validation fell out of the modelled climatically suitable range (in southern California and Bhutan). The distribution data for B. dorsalis presented in Stephens et al. (Reference Stephens, Kriticos and Leriche2007) indicated a presence site in California. However, this site is possibly miscoded geographically, as it falls in a desert area, which would be unsuitable for fruit flies. In addition, there is controversy surrounding the status of B. dorsalis in California. EPPO (2015) reports the species to be eradicated from California. However, Papadopoulos et al. (Reference Papadopoulos, Plant and Carey2013) presented evidence that B. dorsalis may well be established in California, mapping recurrent detections of B. dorsalis over the last five decades in three regions in California (the Bay Area, Los Angeles Basin and San Diego). Whilst both the California Department of Food and Agriculture (CDFA) and the US Department of Agriculture (USDA) declared complete success for all eradication programmes against fruit flies in California (Papadopoulos et al., Reference Papadopoulos, Plant and Carey2013), USDA considers large areas of California as being climatically suitable for population growth (Margosian et al., Reference Margosian, Bertone, Borchert and Takeuchi2007). Papadopoulos et al. (Reference Papadopoulos, Plant and Carey2013) reported that both USDA and CDFA consider California to be suitable for establishment by B. dorsalis, though a careful reading of Margosian et al. (Reference Margosian, Bertone, Borchert and Takeuchi2007) revealed that the modelling estimated the potential to complete generations, but did not address the potential for population persistence during inclement seasons. Therefore, it remains unclear whether or not the climate in California is suitable to sustain year-long populations of B. dorsalis. However, the epicentres of all three Californian regions with recurrent B. dorsalis detections, presented by Papadopoulos et al. (Reference Papadopoulos, Plant and Carey2013), do fall into the modelled climatically suitable range of all three scenarios presented here. The record in Bhutan occurs in an area with large topographic relief, where the reported location fell in high elevation sites that were modelled as being excessively cold. Whilst the model may be wrong, it is plausible that this record may represent specimens trapped during a favourable season, or more likely that the gridded climate at this point may not be indicative of the area actually occupied by the flies (Kriticos & Leriche, Reference Kriticos and Leriche2009). The distribution records in central and Northern China that were not included in the model validation process and that fell out of the climatically suitable range in the current model also fell out of the climatically suitable range in the final models by Hill & Terblanche (Reference Hill and Terblanche2014), despite these authors including these records when constructing their models. These areas were also predicted to be climatically unsuitable by the MaxEnt model of De Meyer et al. (Reference De Meyer, Robertson, Mansell, Ekesi, Tsuruta, Mwaiko, Vayssières and Peterson2010) and the CLIMEX models of Stephens et al. (Reference Stephens, Kriticos and Leriche2007) and EPPO (2010). However, the GARP model of De Meyer et al. (Reference De Meyer, Robertson, Mansell, Ekesi, Tsuruta, Mwaiko, Vayssières and Peterson2010) indicated these areas to be climatically suitable. It is therefore unclear if the current model is underestimating the suitable range in the species’ northern boundary in China. However, these areas did have a positive GIA, which supports the hypothesis that these records may represent ephemeral populations.
The potential distribution as modelled using the natural rainfall and composite risk scenarios showed similarities to the overall potential distribution for B. dorsalis modelled using GARP (De Meyer et al., Reference De Meyer, Robertson, Mansell, Ekesi, Tsuruta, Mwaiko, Vayssières and Peterson2010) and CLIMEX (Stephens et al., Reference Stephens, Kriticos and Leriche2007; EPPO, 2010), especially in the tropical regions where high suitability is modelled in all these models. The main difference lies in the North African boundary of distribution, where the increase of the upper temperature threshold in the current model allowed larger parts of the warmer desert areas to be suitable. In the final models by Hill & Terblanche (Reference Hill and Terblanche2014), suitability was only indicated in terms of presence and absence, and differentiation was not made between the different levels of suitability. The modelled ranges also showed similarities with the current model. However, their models showed a much more restricted potential distribution in the southern boundaries of distribution in Africa, which does not correspond with the actual distribution.
The important effect of irrigation in the distribution of B. dorsalis, has been demonstrated. Since dry stress is an important limiting factor, applying irrigation naïvely (ignoring whether it is practiced or whether the infrastructure is available) extends the possible range of the species dramatically, making almost the entire African and Australian continents suitable (fig. 7b). This demonstrates that, as long as irrigation is applied, which is a requirement for hosts to be grown in these areas, almost all warm, dry climates could be at risk. Such risks should be borne in mind when considering large-scale irrigation projects such as extending agriculture into Northwestern Australia. Our findings regarding the sensitivity of some species distributions to the effects of irrigation resonate with those of Vera et al. (Reference Vera, Rodriguez, Segura, Cladera and Sutherst2002) who modelled the potential range of the Mediterranean fruit fly, Ceratitis capitata Wiedemann, and underlines the need for cautious interpretation of the meaning of species distribution data points when using them for bioclimatic modelling. While using CLIMEX, the modeller is confronted with such issues when the parameters required to fit distribution data do not accord with biologically reasonable values. With dry and cold stresses being the main limiting factors, almost all areas where irrigation is applied and where cold stress is not experienced, will be suitable for persistence of the species, highlighting the great risk posed by this pest.
The areas of greatest climatic suitability for B. dorsalis are large parts of Africa, South America, Central America, Mexico, the southernmost part of the USA, patches in the coastal regions of the Mediterranean, the southern and southeastern countries in Asia, as well as parts of Southern and Eastern Australia and the North Island of New Zealand.
Supplementary Material
The supplementary material for this article can be found at www.journals.cambridge.org/BER
Acknowledgements
We would like to thank Citrus Research International (CRI), the West African Fruit Fly Initiative (WAFFI) and the International Atomic Energy Agency (IAEA) for funding, Ousmane Zakari (Niger), Jean-Yves Rey, Kemo Badji, Aliou Seydi Itef (Senegal), Appolinaire Adandonon, Issa Ouagoussounon, Moudjibou Soumanou Moussa, Jean-Claude Tossou (Benin), Onesmo Ngao, John Kusolwa, Wayda Sulle, Richard Masanza, Martin Kihiyo, Nuru Mgale (Tanzania), Hatim Jomma, Rihab Alkamil Hassan, Rania Elaraky, Elnour Elawad Elnour (Sudan), Peterson Wachira Nderitu (Kenya), Jerry Nboyine, Henry Himans, Raymond Atutonu (Ghana) and Chiluba Mwape (Zambia) for trap servicing and technical assistance, and Matt Hill and Andrea Stephens for providing distribution data for B. dorsalis.


