


Introduction
Helicoverpa armigera is one of several polyphagous moths classified within the so-called ‘mega pest’ lineage of heliothine moths which also includes Chloridea virescens, H elicoverpa zea and H elicoverpa punctigera. It causes billions of dollars of crop damage annually. The genus Helicoverpa most probably evolved within Australasia, as the most basal lineage within it (H. punctigera) is only found in Australia, and the closest sister genus, Australothis is also found there (Matthews, Reference Matthews1999; Cho et al., Reference Cho, Mitchell, Mitter, Regier, Matthews and Robertson2008). Five (H. armigera, H. assulta, H. hardwicki, H. prepodes, and H. punctigera) of the approximately 20 Helicoverpa species described are found in Australia (Gordon et al., Reference Gordon, Tay, Collinge, Williams, Batterham, Goldsmith and Marec2010; Mitchell & Gopurenko, Reference Mitchell and Gopurenko2016). It is less clear where the species H. armigera arose. A typical way of inferring origins, the center of nucleotide diversity, does not provide a clear answer in the literature published thus far (Nibouche et al., Reference Nibouche, Bues, Toubon and Poitout1998; Zhou et al., Reference Zhou, Faktor, Applebaum and Coll2000; Behere et al., Reference Behere, Tay, Russell, Heckel, Appleton, Kranthi and Batterham2007). The age of the H. armigera diaspora is also somewhat clouded, although mounting evidence suggests that it arose after the divergence from the New World sibling species, H. zea, which has been estimated as 1.5–2 mya (Mallet et al., Reference Mallet, Korman, Heckel and King1993; Behere et al., Reference Behere, Tay, Russell, Heckel, Appleton, Kranthi and Batterham2007; Pearce et al., Reference Pearce, Clarke, East, Elfekih, Gordon, Jermiin, McGaughran, Oakeshott, Papanikolaou, Perera, Rane, Richards, Tay, Walsh, Anderson, Anderson, Asgari, Board, Bretschneider, Campbell, Chertemps, Christeller, Coppin, Downes, Duan, Farnsworth, Good, Han, Han, Hatje, Horne, Huang, Hughes, Jacquin-Joly, James, Jhangiani, Kollmar, Kuwar, Li, Liu, Maibeche, Miller, Montagne, Perry, Qu, Song, Sutton, Vogel, Walenz, Xu, Zhang, Zou, Batterham, Edwards, Feyereisen, Gibbs, Heckel, McGrath, Robin, Scherer, Worley and Wu2017).
Until recently, the distribution of H. armigera was limited to Europe, Asia, Africa, and Australia. However, the species was detected in South America around 2012 and is currently spreading through the Americas, causing significant damage (Czepak et al., Reference Czepak, Albernaz, Vivan, Guimarães and Carvalhais2013; Tay et al., Reference Tay, Soria, Walsh, Thomazoni, Silvie, Behere, Anderson and Downes2013; Murúa et al., Reference Murúa, Scalora, Navarro, Cazado, Casmuz, Villagrán, Lobos and Gastaminza2014; Arnemann et al., Reference Arnemann, James, Walsh, Guedes, Smagghe, Castiglioni and Tay2016; Sosa-Gómez et al., Reference Sosa-Gómez, Specht, Paula-Moraes, Lopes-Lima, Yano, Micheli, Morais, Gallo, Pereira, Sal-vadori, Botton, Zenker and Azevedo-Filho2016). Many countries currently control this pest with strategies that combine crops genetically modified to produce Bacillus thuringiensis insecticidal proteins with practices such as the planting of ‘refuges’ aimed to slow the spread of recessive resistance alleles (Tabashnik et al., Reference Tabashnik, Gould and Carrière2004). The recent range expansion of H. armigera into areas likely to have heterogeneous insecticide exposures and control strategies may increase the likelihood of insecticide resistance alleles proliferating. Resistant alleles may then flow back to populations in the ancestral range. Thus, tracking gene flow of insecticide resistance alleles is important to control this damaging species throughout its range (Daly, Reference Daly1993; Fitt, Reference Fitt1994).
Population genomics offers a new way to identify insecticide resistance alleles because they may be associated with selective sweeps. Under the scenario where a resistance allele reaches high frequency (or fixation) in a population, the polymorphisms in neighboring gene regions will exhibit atypical patterns such as reduced within-species variation, elevated levels of differentiation among populations, extended haplotypes, and a skewed frequency spectrum such that a greater fraction of the variants are rare (Nielsen, Reference Nielsen2005). Studies in Drosophila melanogaster underscore the potential of this approach, with genome-wide scans for positive selection successfully recovering strong signals at known resistance loci (Garud et al., Reference Garud, Messer, Buzbas and Petrov2015; Battlay et al., Reference Battlay, Schmidt, Fournier-Level and Robin2016) despite the fact that D. melanogaster is not itself a direct target of insecticides. Thus, these findings hold much promise for organisms such as H. armigera, which would be expected to face much stronger selective pressures as targeted pest species.
As high-throughput sequencing technologies continue to be refined, increasingly sophisticated approaches are available to reduce the complexities in genomic data yet capture the inherent architectures that are unique to each species. These reduced-representation sequencing technologies include RAD-Seq (Baird et al., Reference Baird, Etter, Atwood, Currey, Shiver, Lewis, Selker, Cresko and Johnson2008; Rašić et al., Reference Rašić, Filipović, Weeks and Hoffmann2014) and genotyping-by-sequencing (GBS; Elshire et al., Reference Elshire, Glaubitz, Sun, Poland, Kawamoto, Buckler and Mitchell2011). Recently, Anderson et al. (Reference Anderson, Tay, McGaughran, Gordon and Walsh2016) investigated worldwide population genomic variation in H. armigera with two different ways of sampling alleles from portions of the genome. In one, they examined 21,043 SNPs located across the genome among 216 individuals using a GBS approach. In the other, they examined the variation among 50 individuals in specific fully sequenced regions aligning to 2.3 Mb of 20 BAC clones. They found clear evidence for inter-continental population structure in their full mitochondrial sequence dataset and in their GBS and BAC-aligned sequence datasets. This prompted them to resurrect an idea that H. armigera from Australia had its own subspecies, named H. armigera conferta, that differs from H. armigera armigera in Africa, Europe, and Asia (Common, Reference Common1953; Matthews, Reference Matthews1999). Several groups have used mtDNA to examine population structure, but these earlier datasets show a shallow star phylogeny and little structure (Behere et al., Reference Behere, Tay, Russell, Heckel, Appleton, Kranthi and Batterham2007; Tay et al., Reference Tay, Soria, Walsh, Thomazoni, Silvie, Behere, Anderson and Downes2013; Leite et al., Reference Leite, Alves-Pereira, Corrêa, Zucchi and Omoto2014; Mastrangelo et al., Reference Mastrangelo, Paulo, Bergamo, Morais, Silva, Bezerra-Silva and Azeredo-Espin2014). Microsatellite studies have also been used to examine this issue but interpretations are confounded by non-Mendelian patterns of the markers attributable to a high frequency of null alleles and to associations with transposable elements (Zhang, Reference Zhang2004; Tay et al., Reference Tay, Behere, Batterham and Heckel2010). Behere et al. (Reference Behere, Tay, Russell, Kranthi and Batterham2013) primarily used autosomal exon-primed intron-crossing (EPIC) markers to address population structure issues between crops in India, and they too showed little compelling evidence for population structure.
Our previous study of the Z-chromosome of Australian H. armigera indicated that the amount of variation observed within populations was very high relative to other organisms (nucleotide diversity, π ~ 0.02) and that recombination between sites must also be high as linkage disequilibrium (LD) decayed rapidly, with E(r 2) approaching 0.2 within 200 bps (Song et al., Reference Song, Downes, Parker, Oakeshott and Robin2015). Given that these metrics will differ due to the varying degrees of influence that neutral and non-neutral processes have on a finite population, we wanted to explore the robustness of the estimated parameters and examine if these observations could be extended to non-Australian populations. H. armigera follows a ZZ/ZW sex determination system with females being the heterogametic sex. As in Song et al. (Reference Song, Downes, Parker, Oakeshott and Robin2015), a crucial aspect of the design we follow here is the focus on Z-linked loci because sequencing females provides empirical observations of haplotypes and overcomes the limitations of imputation solutions to the gametic-phase problem (in an individual heterozygous at two loci, the gametic phase is either AB/ab or Ab/aB and which one it is affects LD calculations), which are particularly inaccurate when LD decays rapidly (Slatkin, Reference Slatkin2008).
Here, we use a Z-linked EPIC dataset and a Z-chromosome-wide scan to identify candidate loci that are informative for inter-continental population structure and to assess the conferta sub-species hypothesis. The first dataset employs targeted resequencing to examine nucleotide diversity and LD at 40 EPIC markers in female samples from two collection sites in China. The use of 454 pyrosequencing of PCR amplicons provides us with relatively long reads (~600 bp), and by analyzing only female moths which contain only a single Z-chromosome, we cleanly sample a single allele per individual. The 40 markers include eight loci characterized in Australian samples from our previous study (Song et al., Reference Song, Downes, Parker, Oakeshott and Robin2015), which allows us to explore the question of differentiation between inter-continental populations of H. armigera. The second dataset uses previously reported whole-genome sequencing from Anderson et al. (Reference Anderson, Tay, McGaughran, Gordon and Walsh2016) to scan the Z-chromosome for regions that show high levels of differentiation between Australian and Chinese individuals. This dataset provides us with an independent sample of moths from the two countries to investigate how patterns of differentiation are distributed across the chromosome while further exploring the question of inter-continental population structure.
Materials and methods
DNA samples
Our analysis of polymorphic sites in the 40 Z-linked EPIC markers in the Chinese samples was based on 41 female adults from Nanpi (Hebei Province, Yellow River Valley) (38°2′N, 116°42′E) and 54 female adults from Yancheng (Jiangsu Province, Changjiang River Valley) (33°20′N, 120°9′E) collected in 2011. DNA was isolated by column purification. The provenance of the Australian samples has been reported in Song et al. (Reference Song, Downes, Parker, Oakeshott and Robin2015). Briefly, they consist of eggs collected from MacIntyre Valley (Queensland) which were reared to adults in the laboratory, after which only female samples were used.
Samples used in the Z-chromosome-wide analysis comprised 19 Australian and four Chinese individuals used in Anderson et al. (Reference Anderson, Tay, McGaughran, Gordon and Walsh2016). In this case, H. armigera were collected as adults using emergence traps placed among cotton plants in New South Wales, Australia, and as caterpillars from cotton in Shandong, China. DNA was isolated by column purification.
Library preparation
For the EPIC markers, Z-linked loci were identified in the silkworm Bombyx mori using the published GLEAN cDNA dataset for this species and coding sequences were extracted based on the Z-chromosome (chromosome 1) scaffold numbers (nscaf1690, nscaf2210, nscaf2734, nscaf3040, and nscaf3068 from http://silkworm.genomics.org.cn/). The H. armigera orthologues of these B. mori loci were identified though BLAST searches against a repository containing contigs from an H. armigera reference strain (Pearce et al., Reference Pearce, Clarke, East, Elfekih, Gordon, Jermiin, McGaughran, Oakeshott, Papanikolaou, Perera, Rane, Richards, Tay, Walsh, Anderson, Anderson, Asgari, Board, Bretschneider, Campbell, Chertemps, Christeller, Coppin, Downes, Duan, Farnsworth, Good, Han, Han, Hatje, Horne, Huang, Hughes, Jacquin-Joly, James, Jhangiani, Kollmar, Kuwar, Li, Liu, Maibeche, Miller, Montagne, Perry, Qu, Song, Sutton, Vogel, Walenz, Xu, Zhang, Zou, Batterham, Edwards, Feyereisen, Gibbs, Heckel, McGrath, Robin, Scherer, Worley and Wu2017). Ultimately an independent assembly of the Helicoverpa genome confirmed that these 40 loci were indeed on the Z-chromosome of H. armigera. Intron–exon boundaries on the H. armigera contig sequences were identified with EXONERATE under the cdna2genome model using the silkworm cDNA as input queries. Loci were selected to include different regions of the Z-chromosome and to incorporate clusters of loci, where the distance separating two loci was <50 kb (fig. 1) to allow for the possibility of detecting long-range LD.

Fig. 1. Map of EPIC amplicons used in this study. Positions of contigs are based on the five Z-chromosome scaffolds of B ombyx mori. Numbers in brackets after the scaffold names refer to the lengths of the scaffolds in megabases. Amplicons are named according to the gene they are based on; those with the suffix BGIBMGA refer to B. mori orthologs using the names assigned by the silkworm sequencing consortium (http://silkworm.genomics.org.cn). Inset: Amplicon design for the Cyp303a1 locus showing the location of a 200bp insertion/deletion (indel) polymorphism.
The 454 Universal Tailed Amplicon (Roche) sequencing design was used where sequences from each individual were given unique barcodes. Briefly, the strategy utilizes two successive rounds of PCR to produce amplicons appropriate for the sequencing platform. The first round of PCR employs fusion primers consisting of the universal tail sequence and a gene-specific primer. The second round of PCR is carried out with fusion primers comprising the 454 sequencing primers, a custom 5-bp MID (multiplex identifier) sequence, and a sequence which targets the tail sequences introduced in the first round. Primer sequences are provided in Supplementary table S1 and loci have been named according to the B. mori gene they are based on; those with the suffix BGIBMGA refer to B. mori orthologs using the names assigned by the silkworm sequencing consortium (http://silkworm.genomics.org.cn).
First-round amplification with locus-specific primers was carried out in a reaction volume of 20 µl. Cycling conditions were typically 35 cycles of 94°C for 20 s, 58°C for 20 s, 68°C for 1 min. To estimate the size and intensity of bands, 3 µl of each product was visualized on agarose gels with 5 µl of DNA markers. Each amplicon was assigned a score of intensity ranging from 2 (strongest) to 10 (weakest) prior to pooling by sample barcodes (MIDs) for library preparation and sequencing. To compensate for different yields (to avoid oversampling of particular amplicons during sequencing), pooling was carried out in the following manner: 2 µl of an amplicon was included if it had a score of 2, and up to 10 µl was included for weaker products.
Bead purification was carried out with MagNA buffer (Rohland & Reich, Reference Rohland and Reich2012) and 1 µl of each pool was used as a template for second-round amplification in individual reaction volumes of 50 µl. Second-round amplification was carried out in duplicate with ten cycles of 94°C for 30 s, 68°C for 1.5 min to incorporate the MID barcodes and adapter sequences. The barcoded pools were combined into a single library then purified and concentrated by bead purification, gel excision, and column purification prior to quantification. Sequencing was performed by the Ramaciotti Centre for Genomics (University of New South Wales, Australia) using Roche 454 GS FLX Titanium chemistry for amplicon sequencing (XLR70).
For the Z-chromosome-wide dataset, library preparation has been described in Anderson et al. (Reference Anderson, Tay, McGaughran, Gordon and Walsh2016). Briefly, Nextera libraries were produced following the manufacturer's instructions, and sequence was generated as 100-bp PE reads (Illumina HiSeq 2000, Biological Resources Facility, Australian National University, Australia).
Sequence diversity and LD
For the EPIC dataset, sequence reads were first sorted by MIDs (individual barcodes) and assembled de novo in GENEIOUS R7 (Biomatters, Auckland, New Zealand) using a threshold of 10% for maximum mismatches per read. Contigs from all individuals were then mapped to the reference H. armigera amplicon sequences using BLASTN. Mapped contigs comprised 116,069 reads, representing 83% of the total number of reads. Multiple sequence alignments for each locus were performed using SEAVIEW 4.0 (Gouy et al., Reference Gouy, Guindon and Gascuel2010) and CLUSTALX (Larkin et al., Reference Larkin, Blackshields, Brown, Chenna, McGettigan, McWilliam, Valentin, Wallace, Wilm, Lopez, Thompson, Gibson and Higgins2007). Sequences were assessed at two levels in the process of error correction: at the individual (MID) level and at the population (aligned to reference) level. Where low coverage at the individual level resulted in base ambiguities, this was resolved by comparing to other sequences in the population, i.e. if all other individuals were monomorphic at that site, the ambiguity was manually edited to match the population. Base ambiguities observed at segregating sites were edited to match the majority (>50%) of individuals in the population. This approach was adopted to counteract the possible inflation of rare SNPs in the population which could result in deviations from the expected site frequency spectrum under neutrality. The filtered dataset contained a total of 40 amplicons distributed across 29 H. armigera contigs that map to five B. mori Z-linked scaffolds (fig. 1) with an average of 58 individuals per locus.
Analyses of polymorphism and LD were carried out using DNASP 5.10.01 (Rozas et al., Reference Rozas, Sanchez-DelBarrio, Messeguer and Rozas2003) with alignment files indicated as haploid Z-chromosome. Nucleotide diversity (π) and Tajima's D were estimated using a total of 2351 sites. A second estimate of π and θ was also made using only the first 100 bases from the 5′ ends of the sequence alignments (with indels excluded) to explore the possibility that diversity could be inflated by sequencing errors toward the 3′ ends of longer reads (Gilles et al., Reference Gilles, Meglécz, Pech, Ferreira, Malausa and Martin2011). LD was estimated as the square of the correlation coefficient, r 2, using only parsimony-informative sites, with the decay of LD over physical distance modeled on the expectations of Hill & Weir (Reference Hill and Weir1988) and implemented using the non-linear least-squares (nls) function in R (R Core Team, 2014).
The data analyzed in the frequency spectrum tests above included eight haplotypes (spanning four loci) that were highly diverged from other alleles at those loci. Notably, three of the haplotypes came from a single individual collected from Yancheng, MID-95. At two loci where we had sequences from H. assulta, the divergent haplotype of MID-95 resembled the H. assulta sequences. We thus excluded MID-95 from all analyses on the likely basis that it was an assulta specimen.
For the Z-chromosome-wide dataset, data handling has been described in Anderson et al. (Reference Anderson, Tay, McGaughran, Gordon and Walsh2016). Briefly, raw sequence reads were aligned to the Z-chromosome of the H. armigera genome using BBMAP v.33.43 (http://sourceforge.net/projects/bbmap/). Quality trimming of reads was carried out when at least two consecutive bases fell below Q10, and only uniquely aligning reads were included in the analysis. UnifiedGenotyper in GATK v. 3.3-0 (McKenna et al., Reference McKenna, Hanna, Banks, Sivachenko, Cibulskis, Kernytsky, Garimella, Altshuler, Gabriel, Daly and DePristo2010) was used to estimate genotypes, implementing a heterozygosity value of 0.01.
Analyses of population structure
Analysis of molecular variance, F ST, and STRUCTURE analyses
Analysis of molecular variance (AMOVA) and F ST calculations were performed on the EPIC dataset using functions implemented in the R packages adegenet v2.0.0, hierfstat v0.04-22, and Poppr v2.2.0 (Goudet, Reference Goudet2005; Jombart & Ahmed, Reference Jombart and Ahmed2011; Kamvar et al., Reference Kamvar, Tabima and Grünwald2014). We used STRUCTURE version 2.3.4 (Pritchard et al., Reference Pritchard, Stephens and Donnelly2000) to assess the degree of population stratification between Nanpi and Yancheng, and between MacIntyre Valley (Australia) and China. Two approaches were initially considered in the definition of a locus: haplotypes, for which the dataset is well suited due to the phased (hemizygous) nature of the sequences; and sites, which increase the number of loci available for analysis. A haplotype is made up of many polymorphic sites within the same amplicon. Using this ‘haplotype approach’, our dataset thus contains only 40 loci for analysis. The ‘site approach’ treats each polymorphic site as a locus, and there were 2351 such sites in our dataset. Singleton sites (where only a single instance of a variant allele was observed) were then excluded as they are uninformative with respect to distinguishing between populations, reducing the number of loci to 1352 in the final analysis. In cases where sequences were not available for all individuals, a value of −9 was assigned to denote missing data.
The haplotype approach avoids any possible issues with non-independence between sites due to LD, but has the disadvantage of collapsing multiple polymorphic sites into a single haplotype, thus reducing the number of loci for analysis and consequently the power to assign individuals to a specific cluster. A second limitation was the high levels of diversity in all populations, leading to an increase in the uncertainty surrounding the clustering of singleton and low-frequency haplotypes. We attempted to reduce the number of singleton haplotypes by grouping together individuals that differed from a ‘core haplotype’ at polymorphic sites not represented elsewhere (singleton sites) but even so, overall haplotype diversity remained high, and this motivated the site approach. While a STRUCTURE analysis would not typically consider sites within the same amplicon to be independent markers, the rapid decay of LD in H. armigera suggested that a valid analysis could be performed without violating the assumptions of independence between loci (Falush et al., Reference Falush, Wirth, Linz, Pritchard, Stephens, Kidd, Blaser, Graham, Vacher, Perez-Perez, Yamaoka, Mégraud, Otto, Reichard, Katzowitsch, Wang, Achtman and Suerbaum2003). To assess the robustness of the site approach, a series of ‘thinned’ datasets were generated by randomly selecting 50% of the 1352 sites available, and subjected to the same STRUCTURE analyses as the full dataset (described below). Ten such datasets were generated, all of which showed a similar outcome to the full dataset, indicating that linked SNPs are not over-represented despite the short distances separating each locus (site). Only the results of the ‘site’ analysis are presented here as they proved to be more informative than the haplotype analysis.
All STRUCTURE analyses were carried out under the model incorporating admixture and independent allele frequencies between populations, without using prior population information. A series of analyses was run using values of K (the number of genetically defined populations, which may be unknown) from 1 to 5 using the same parameters. Ten replicates were run for each K value with 10,000 iterations for the burn-in period followed by an additional 10,000 iterations after the burn-in. In cases where a choice lay between K = 2 and K > 2 to explain most of the structure in the data, the Evanno method (Evanno et al., Reference Evanno, Regnaut and Goudet2005) was used to formally evaluate the most likely K value via STRUCTURE HARVESTER (Earl & vonHoldt, Reference Earl and vonHoldt2011) by choosing the value of K that corresponds to the largest value of ΔK. For the Nanpi–Yancheng comparison where the choice lay between K = 1 and K = 2, no formal evaluation was applied as it is not possible to obtain a value of ΔK between K = 0 and K = 1; the most likely value of K was inferred from the graphical results.
The output of a STRUCTURE analysis is typically presented in the form of a bar chart illustrating the number of distinct populations as well as assignments of individuals to populations (such as those depicted in fig. 2). However, these visualizations represent the output of only a single run. We performed an analysis to explore the correlation between a single STRUCTURE run vs. the results of 100 runs (Supplementary fig. S1). The results show that there is a moderate to high level of reproducibility in the assignment of individuals to a population across multiple runs. We therefore conclude that in most cases, the graphical output of a single, randomly selected run is a reasonable representation of the results of multiple runs.
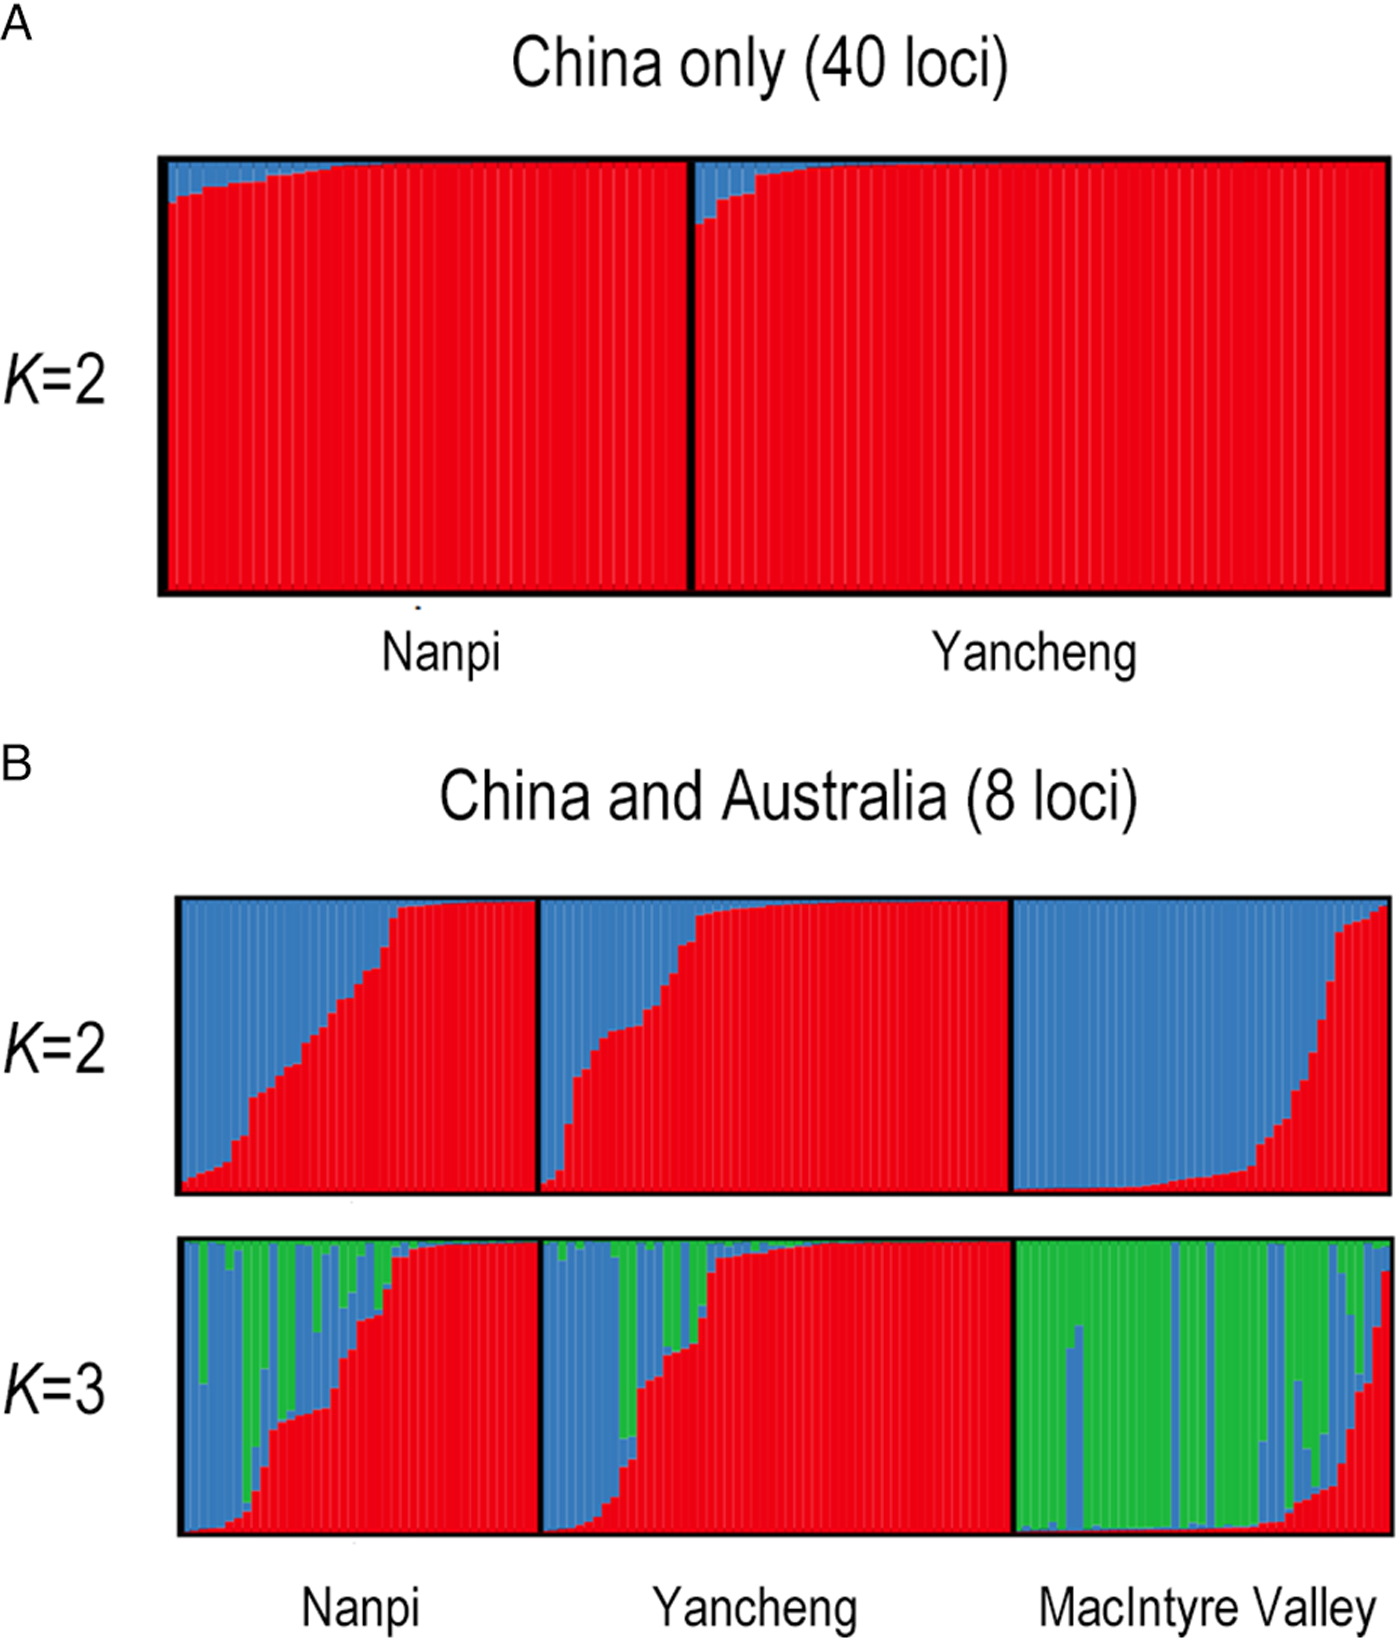
Fig. 2. (A) STRUCTURE plots using 40 loci for the Nanpi and Yancheng populations, with K = 2. Each bar (column) represents an individual. Colors and bar heights represent the inferred ancestries of an individual. (B) STRUCTURE plots using eight loci for the Nanpi, Yancheng, and MacIntyre Valley populations. Each bar (column) represents an individual. Colors and bar heights represent the inferred ancestries of an individual, so admixed individuals that have a heritage derived from mixed sources are represented by columns with more than one color. Only K = 2 and K = 3 are shown as they represent the values most likely to explain the major structure in the dataset. In the K = 2 visualization, MacIntyre Valley has more ‘blue’ individuals while China has more ‘red’. In the K = 3 visualization, MacIntyre Valley has more ‘green’ individuals compared with the primarily red and blue landscape of the Chinese individuals, suggesting that some alleles observed in Australia are rare (or not found) in China. Similarly, the higher incidence of ‘red-only’ individuals in China suggests that some alleles that are common here are rare in Australia.
Z-chromosome-wide sliding window analysis of weighted F ST
Imputation of missing bases in the Z-chromosome-wide dataset was performed using default parameters in Beagle (Browning & Browning, Reference Browning and Browning2007). LD-based pruning was conducted using Plink v.1.07 (Purcell et al., Reference Purcell, Neale, Todd-Brown, Thomas, Ferreira, Bender, Maller, Sklar, De Bakker, Daly and Sham2007) with the command ’--indep 50 5 2’. Non-negative weighted F ST and Tajima's D were calculated across sliding windows using vcftools v.0.1.14 (Danecek et al., Reference Danecek, Auton, Abecasis, Albers, Banks, DePristo, Handsaker, Lunter, Marth, Sherry and McVean2011) where each window contained 500 SNPs. Sliding window analyses were plotted using R and ggplot2 (Wickham, Reference Wickham2009). A series of 1000 permutations was carried out on the empirical dataset by randomly partitioning the samples into two groups, each containing 19 and four individuals. The same weighted F ST analysis was then carried out on these permuted datasets whereby the 95th percentile of the F ST values obtained in each window and plotted. The aim of this exercise was to assess the extent to which the empirical observations deviated from the expected distribution of F ST values, given the small sample sizes and the disparity between the number of individuals in each group. Outlier loci were defined as those with an F ST value above the 95th percentile of all F ST values in the empirical dataset.
Results
Sequence and haplotype diversity in China
Measures of nucleotide diversity within the Nanpi population and the Yancheng population were similar. Values of π ranged from 0.003 to 0.130 nucleotide differences per site (Supplementary table S2), averaging 0.028 across 40 loci, while haplotype diversity ranged from 0.5 to 1 (within amplicon lengths of 120–660 bp), similar to that observed in Australian populations (Song et al., Reference Song, Downes, Parker, Oakeshott and Robin2015). LD decayed in a manner similar to that of the Australian populations, with the average r 2 (the square of the correlation coefficient between pairs of polymorphic sites) falling below 0.2 for sites separated by 200 bp or more (Supplementary fig. S2).
There was little population structure between Nanpi and Yancheng. F ST, a traditional measure of population structure, was very low (0.03) and an AMOVA indicated that <1% of the variation in the samples discriminated between the two Chinese populations, despite them being 700 km apart. Likewise, analyses using the STRUCTURE program provided little support for population differentiation (fig. 2A, Supplementary table S3). We performed two separate analyses on the combined Nanpi and Yancheng datasets; the ‘haplotype’ and the ‘site’ analysis. In the former, haplotypes were determined for each of the 40 loci; many haplotypes were found and all were at low frequencies (many haplotypes occur only once in a population). This approach therefore reduces the power to assign individual moths to a particular genetically defined cluster. By contrast, the ‘site’ analysis treats sites as independent (i.e. assumes no LD). As each site is limited to a maximum of four states (we have not considered gaps) with most sites being bi-allelic, the estimated allele frequencies resulting from this treatment are substantially higher, increasing the ability of the STRUCTURE algorithm to strongly assign an individual to one cluster or another. Additionally, the use of polymorphic sites rather than haplotypes increases the number of loci available for analysis by 30-fold (40 loci vs. 1352 sites). The STRUCTURE plot shows that Nanpi and Yancheng are both dominated by a single ‘genetically defined population’ (red in fig. 2A). These results indicate that the geographical separation of the two moth collections is not manifest in the genetic data surveyed here.
Given the lack of evidence for population differentiation, the following analyses in this section were performed by treating Nanpi and Yancheng as a single population. Initially, to address the possibility that diversity could be inflated due to sequencing errors, π and θ (measures of genetic diversity estimated from the average number of pairwise differences and the number of segregating sites, respectively) were estimated using the first 100 bases (hereafter referred to as π100 and θ100) from the 5′ end (excluding indels) where sequence quality is expected to be superior (Table 1). These values were compared to values obtained from the full-length datasets. While there was considerable variance between the two estimates at individual loci, the values averaged across all loci were similar, suggesting increased polymorphism in longer sequences due to sequencing error does not inflate estimates substantially.
Table 1. Nucleotide diversity and Tajima's D for all sites, and for the first 100 bases.

Figures in brackets after the locus name represent the total number of sequences surveyed.
*p < 0.05, **p < 0.01, ***p < 0.001.
As the differences between θ and θ100 (and π and π100) were small, Tajima's D was estimated using all sites. A negative value was observed at every locus, indicating an excess of rare variants in the combined population. At ten of the 40 loci, these values were significantly different from neutral expectations. Five of the ten are located around the Cyp303a1 locus, which we have deliberately chosen to sample at a higher density here compared with other loci, as this is a region previously reported to harbor signatures of a selective sweep. Of the remaining five loci with a significantly negative Tajima's D, two (BGIBMGA012230 and BGIBMGA012230F2) are located in the same protein-coding gene (BGIBMGA012230) separated by a distance of 4 kb. This gene is predicted to code for a subunit of the CCR4-Not protein complex, a global regulator of gene expression (Collart & Panasenko, Reference Collart and Panasenko2012). The third locus is in the Kettin gene, which codes for a highly conserved protein involved in insect flight muscle development (Lakey et al., Reference Lakey, Labeit, Gautel, Ferguson, Barlow, Leonard and Bullard1993). The fourth, BGIBMGA000615 shares some sequence similarity with CG32030 in D. melanogaster (http://flybase.org/) which contains a formin domain. Members of the formin family of proteins have been characterized as playing a role in cytokinesis and cytoskeletal control (Wallar & Alberts, Reference Wallar and Alberts2003). The fifth, BGIBMGA013328 is a TUDOR-SN protein containing staphylococcal nuclease-like (SN) and Tudor domains. The silkworm TUDOR-SN is thought to be involved in the formation of stress granules (RNA-protein complexes that form when translation initiation is impaired during a stress response) and interacts with the components of the RNAi pathway (Zhu et al., Reference Zhu, Tatsuke, Li, Mon, Xu, Lee and Kusakabe2012, Reference Zhu, Tatsuke, Mon, Li, Xu, Lee and Kusakabe2013).
Analysis of intercontinental population structure
To investigate the extent of population structure between H. armigera from different continents, eight loci that had been Sanger-sequenced in Australian populations previously (Song et al., Reference Song, Downes, Parker, Oakeshott and Robin2015) were included among the markers sequenced in the Nanpi and Yancheng populations: Cyp303down1, Cyp303down3, Cyp305b1, Period, Phc, SCAP, Tc, and Tpi. An analysis was performed to assess two competing hypotheses, namely, whether the samples from Nanpi, Yancheng, and MacIntyre Valley clustered into two or three groups. Replicate runs of the STRUCTURE analysis favored models involving two genetically defined groups, K = 2 (fig. 2B, Supplementary table S4). This result is consistent with the lack of differentiation between the two Chinese populations as seen in the data above. The differences between the Australian and Chinese samples are subtle with the two genetically defined groups being reciprocally more abundant in the two countries (fig. 2B) and admixed individuals being present in all three populations. If the number of genetic groups is increased to three, then one class (green) is more abundant in Australia. Omitting the Cyp303a1-associated loci produced a similar pattern. These patterns should not be overinterpreted however as the lack of distinct clustering could also arise due to a lack of power from an insufficient number of markers and/or missing data (Pritchard et al., Reference Pritchard, Stephens and Donnelly2000).
F ST between the Australian and Chinese samples was generally low (0.09), and an AMOVA indicated that 88% of the variation in the samples could be explained by the variation within samples from the same country. The Cyp303a1-associated loci exhibited the highest F ST values, with 0.24 and 0.69 at Cyp303down1 and Cyp303down3, respectively. F ST at the remaining six loci did not exceed 0.2.
The Cyp303a1 locus
At seven of the eight loci, diversity in the MacIntyre Valley population did not markedly differ from the Chinese populations, although haplotype diversity appeared slightly elevated in the Australian samples (Table 2). Notably, Cyp303down1 was an exception (the Australian population had about tenfold lower nucleotide diversity than the Chinese populations), consistent with other lines of evidence (extended LD, reduced nucleotide diversity, and a skewed frequency spectrum) that support the occurrence of a sweep at or around this locus in Australian populations (Song et al., Reference Song, Downes, Parker, Oakeshott and Robin2015). We explored the patterns around the Cyp303a1 locus in the Chinese populations, in particular the frequency of the Del200 haplotype (the swept allele in Australia which is characterized by an intronic 200 bp deletion) and the molecular signatures downstream of the indel polymorphism. Analysis of the amplicon lengths revealed that only 1/94 individuals carried the deletion, and sequencing confirmed the presence of the Del200 haplotype in this individual, YC-39 (fig. 3). Downstream 1 kb of the indel, the most abundant haplotype was one that was shared between Australia and China but approximately 27% of the Chinese individuals had a second haplotype that was not observed in MacIntyre Valley (although the small sample size does not preclude the possibility that this second haplotype is present at a low-to-intermediate frequency in Australia). This locus, Cyp303down1 also exhibited a pattern of extended LD (r 2 > 0.2 beyond 400 bps) that differed from that of other loci where r 2 typically declines to below 0.2 within 200 bps (Supplementary fig. S3).

Fig. 3. Major haplotypes observed in the sequenced regions of the Cyp303a1 locus in Australia. At the Cyp303indel locus, the Del200 haplotype occurs at approximately 30% frequency in Australia but only appears in one individual, YC-39 from China. Downstream 1 kb of the indel, two major haplotypes are observed in China. At the down3 locus, a different haplotype dominates in the two countries, and individual YC-39 carries a haplotype that is commonly found in Australia. The haplotype at the down3 locus is primarily defined by two sites, from a total of 14 polymorphic sites at this locus (Supplementary fig. S4).
Table 2. Haplotype diversity and nucleotide diversity for Nanpi, Yancheng, and MacIntyre Valley at eight loci.

A similar pattern of differentiation was observed between the Australian (n = 22) and Chinese (n = 69) populations in the region 3 kb downstream of the Cyp303 coding sequence (fig. 4). The major haplotype in Australia (haplotype 2) was seen in two individuals from China, one of which was YC-39. As YC-39 was also the sole carrier of the Del200 allele among the 94 Chinese samples in this dataset, we infer that YC-39 carries a haplotype that originated from Australia, and conclude that this locus is highly informative for determining whether an H. armigera individual originated from Australia or China. The Cyp303down3 haplotype is characterized by 14 polymorphic sites, three of which show a distinct difference in allele frequencies between Australia and China (Supplementary fig. S4).

Fig. 4. Sliding window analysis of weighted F ST across the Helicoverpa armigera Z-chromosome for Australian (n = 19) and Chinese individuals (n = 4). Gray dots represent the 95th percentile of F ST values in each window for 1000 random permutations of the dataset while black dots represent the values from the empirical dataset. The gray dashed line indicates the 95th percentile of the F ST values for the permuted datasets while the black dashed line indicates the 95th percentile of the F ST values for the empirical dataset. Seven broad visually defined regions showing high population structure are numbered and indicated by gray shading. The loci that were studied in the initial dataset are shown and their values in this dataset are shown as triangles.
Are there other Z-loci that show strong differentiation between Australian and Chinese populations?
The strong discordance between the inter-continental population structure observed at Cyp303a1 and the other loci surveyed motivated us to extend the study to more loci. We wished to know whether the Cyp303a1 region was unique – perhaps because of its selective sweep, and whether there were other loci that showed strong inter-continental structure. We therefore turned our attention to the whole-genome sequence dataset generated by Anderson et al. (Reference Anderson, Tay, McGaughran, Gordon and Walsh2016), and examined the Z-chromosome sequences from 19 Australian and four Chinese samples in that dataset. In particular, we measured the weighted F ST (fig. 4) across the H. armigera Z using sliding windows of 500 SNPs (see Materials and methods). The plot has two striking features relative to such analyses from other species (e.g. Reinhardt et al., Reference Reinhardt, Kolaczkowski, Jones, Begun and Kern2014): firstly, the F ST values are distributed over a surprisingly large range (as high as F ST = 0.6), and secondly, the extremely high F ST values are clustered along the chromosome so that distinct peaks are observed in the plot. This completely independent analysis is concordant with the EPIC dataset to the extent that the Cyp303a1 locus is highly differentiated between Australia and China and only one of the six loci (the period gene) that showed minimal population differentiation in the EPIC dataset, shows any Australia–China differentiation in the re-sequencing dataset.
As the whole Z-chromosome dataset had an unbalanced sampling design with four moths sampled from China and 19 from Australia, we used a permutation approach to evaluate the extent to which the empirical dataset deviated from the distribution of F ST values that could be expected given the small sample sizes. Four chromosomes were sampled at random from the combined set of 23 and F ST was calculated. This was repeated 1000 times to give 1000 datasets. Regions in the empirical dataset (represented by black dots in fig. 3) that fall outside of a distribution generated by 1000 permutations (gray dots) cannot be attributed to population sampling biases. It is noteworthy that the 95th percentile of the empirical dataset is substantially higher than that of the permuted datasets (represented by black and gray dashed lines in the figure, respectively) supporting the contention of population differentiation between Australia and China.
There are 302 windows that cross a threshold defined by the top 95% most differentiated windows. These loci are therefore of interest as they provide useful markers of population differentiation. The 302 sliding windows can be grouped into 32 contiguous regions (ranging in size from 9 to 268 kb) and further simplified into seven broad arbitrarily-defined regions based on visual inspection. We used the recently available H. armigera genome sequence (Pearce et al., Reference Pearce, Clarke, East, Elfekih, Gordon, Jermiin, McGaughran, Oakeshott, Papanikolaou, Perera, Rane, Richards, Tay, Walsh, Anderson, Anderson, Asgari, Board, Bretschneider, Campbell, Chertemps, Christeller, Coppin, Downes, Duan, Farnsworth, Good, Han, Han, Hatje, Horne, Huang, Hughes, Jacquin-Joly, James, Jhangiani, Kollmar, Kuwar, Li, Liu, Maibeche, Miller, Montagne, Perry, Qu, Song, Sutton, Vogel, Walenz, Xu, Zhang, Zou, Batterham, Edwards, Feyereisen, Gibbs, Heckel, McGrath, Robin, Scherer, Worley and Wu2017) to identify the loci in these differentiated regions – these genes are listed in Table 3 along with credible homology-based functional annotations we can assign to them. Notably, the list includes members of the ABC transporter gene family which have been implicated in insecticide resistance (Srinivas et al., Reference Srinivas, Udikeri, Jayalakshmi and Sreeramulu2004; Buss & Callaghan, Reference Buss and Callaghan2008). The list also includes period (used as an EPIC marker in this study) and CCR4-Not which shows a significantly negative Tajima's D value in the Chinese populations.
Table 3. Functional annotations for F ST outlier loci identified from the sliding window analysis across the Helicoverpa armigera Z-chromosome. HAOG numbers refer to the H. armigera official gene set annotated in Pearce et al. (Reference Pearce, Clarke, East, Elfekih, Gordon, Jermiin, McGaughran, Oakeshott, Papanikolaou, Perera, Rane, Richards, Tay, Walsh, Anderson, Anderson, Asgari, Board, Bretschneider, Campbell, Chertemps, Christeller, Coppin, Downes, Duan, Farnsworth, Good, Han, Han, Hatje, Horne, Huang, Hughes, Jacquin-Joly, James, Jhangiani, Kollmar, Kuwar, Li, Liu, Maibeche, Miller, Montagne, Perry, Qu, Song, Sutton, Vogel, Walenz, Xu, Zhang, Zou, Batterham, Edwards, Feyereisen, Gibbs, Heckel, McGrath, Robin, Scherer, Worley and Wu2017). Region numbers correspond to those shown in fig. 3.

Discussion
Our analysis of the EPIC data found that Australian and Chinese populations of H. armigera harbored similar levels of nucleotide diversity. Furthermore, the average pairwise nucleotide divergence between the populations in the EPIC dataset is the same as that calculated in the independent dataset of Anderson et al. (Reference Anderson, Tay, McGaughran, Gordon and Walsh2016) where π = 0.028. Haplotype diversity generally appears to be slightly elevated in the Australian samples (excluding Cyp303a1 from the comparison), although there are instances where nucleotide diversity of the Nanpi population exceeds that of MacIntyre Valley. The elevated Australian diversity motivated us to examine all the datasets in the literature to consider whether nucleotide diversity could provide a clue as to where the ancestral H. armigera populations arose. Revisiting the mtDNA data in Behere et al. (Reference Behere, Tay, Russell, Heckel, Appleton, Kranthi and Batterham2007) reveals that a Ugandan population of H. armigera has higher nucleotide diversity than the Australian population, although haplotype diversity of Australia still exceeds that of Uganda. Anderson et al. (Reference Anderson, Tay, McGaughran, Gordon and Walsh2016) found more mitochondrial diversity in Australia but the larger number of Australian samples distorts the interpretation slightly. More data would be required to determine whether there is a geographic region that harbors more diversity than all others.
Another result from our EPIC analyses is the consistent signal of a negative Tajima's D, indicating an excess of rare variants in the Chinese populations. This result contrasts with that of Anderson et al. (Reference Anderson, Tay, McGaughran, Gordon and Walsh2016) who report that Tajima's D was positive in eight of the nine populations they examined, the exception being the Australian population. Even when singleton sites are removed from our analysis, Tajima's D remains negative for 29 of the 40 loci, suggesting that our data are robust and sequencing errors do not overly inflate the overall negative pattern. We have two hypotheses to explain the discordance between the datasets. Firstly, all our loci are on the Z-chromosome, whereas the data from Anderson et al. (Reference Anderson, Tay, McGaughran, Gordon and Walsh2016) come from across the genome (which consists of 31 chromosomes of roughly similar size). Sex chromosomes are subjected to more efficient selection than autosomes because recessive mutations are exposed in the heterogametic sex (Charlesworth et al., Reference Charlesworth, Coyne and Barton1987). Furthermore, female heterogamety means that Z-linked loci are subjected to higher mutation rates than autosomal loci because the Z-chromosome spends two-thirds of its time in males where spermatogenesis is more mutagenic than oogenesis (Vicoso & Charlesworth, Reference Vicoso and Charlesworth2006; Sackton et al., Reference Sackton, Corbett-Detig, Nagaraju, Vaishna, Arunkumar and Hartl2014). Consequently, the combination of increased efficacy of selection and the increase in mutation rate could produce a relatively greater excess of rare variants on the Z-chromosome relative to the autosomes.
The second explanation is that the Tajima's D analysis of Anderson et al. (Reference Anderson, Tay, McGaughran, Gordon and Walsh2016) is affected by the small sample size of populations (most are between three and five samples per population). Since Tajima's D test is an allele frequency spectrum test, power is much lower with small sample sizes. If we exclude these populations on the basis of small sample size, we are left with the one sample where Anderson et al. (Reference Anderson, Tay, McGaughran, Gordon and Walsh2016) have a moderate depth for their Tajima's D test, the Australian population (n = 17) which has a negative Tajima's D value. This set of individuals is in fact a subset of the 19 examined here, but is genome-wide rather than limited to the Z-chromosome, as our analysis is. Thus, we interpret the negative Tajima's D as an evidence of a population expansion in the evolutionary history of H. armigera. It should be noted that such an expansion would be a much older event and not the recent incursion into the Americas (where insufficient time has passed to leave behind such molecular signatures). It is not clear if this expansion relates to the spread of agriculture or to an even older event such as the availability of new niches during favorable climatic conditions in the Pleistocene (the estimated period of divergence with H. zea). More data and sophisticated population models would be required to date the expansion.
Our data also speak to the question of whether H. armigera from Australia belong to a separate subspecies (Common, Reference Common1953). Most of the eight loci where we have EPIC data from China and Australia show no population differentiation between the two countries; the exceptions are the Cyp303a1-associated markers. Our previous study (Song et al., Reference Song, Downes, Parker, Oakeshott and Robin2015) which characterized the Cyp303a1 Ins200 and Del200 haplotypes revealed extremely diverged alleles – so diverged that they may be considered ‘comet alleles’ (Staubach et al., Reference Staubach, Lorenc, Messer, Tang, Petrov and Tautz2012) which may have arisen from introgression with some other unknown species. This suggests two contrasting models to explain the results of the genome-wide STRUCTURE analysis reported by Anderson et al. (Reference Anderson, Tay, McGaughran, Gordon and Walsh2016). In one model, the signal for population differentiation comes from a smallish number of highly diverged loci (like Cyp303a1) that are distributed patchily across Australian genomes. These may derive from an introgression event in a way analogous to the ‘Neanderthal’ introgression footprints in non-African modern humans (Green et al., Reference Green, Krause, Briggs, Maricic, Stenzel, Kircher, Patterson, Li, Zhai, Fritz, Hansen, Durand, Malaspinas, Jensen, Marques-Bonet, Alkan, Prüfer, Meyer, Burbano, Good, Schultz, Aximu-Petri, Butthof, Höber, Höffner, Siegemund, Weihmann, Nusbaum, Lander, Russ, Novod, Affourtit, Egholm, Verna, Rudan, Brajkovic, Kucan, Gušic, Doronichev, Golovanova, Lalueza-Fox, de la Rasilla, Fortea, Rosas, Schmitz, Johnson, Eichler, Falush, Birney, Mullikin, Slatkin, Nielsen, Kelso, Lachmann, Reich and Pääbo2010). In the other model, the Australian H. armigera differ by small amounts diffused throughout the genome, reflecting variants that accumulated in Australian moths when gene flow to other parts of the world was less than it appears to be now; in other words, a more conventional isolation-by-distance model. The gene flow that established such a difference would have to be less than what is observed currently based on reports such as the repeated incursions of H. armigera into South America in recent years.
The F ST scan across the Z-chromosome offers some support for the ‘Neanderthal’ model. There appear to be distinct clusters of elevated F ST arising from a substantially lower baseline. Under an isolation-by-distance model, we may have seen more intermediate values of F ST. These inter-population divergence patterns will be influenced by many factors including recombination rate heterogeneity and the timing and abundance of local selective sweeps. Future studies should test other global populations for Z-linked population structure and should contrast these within-species data to between-species divergence with closely related species.
At a pragmatic level, we have identified multiple loci including Cyp303a1 as useful markers to identify gene flow from Australia. We believe that the Chinese YC-39 individual, which shows a distinctly Australian haplotype at regions close to Cyp303a1, tells us that inter-continental gene flow can occur. Such gene flow would contribute to a general lack of population structure in worldwide populations of H. armigera, and the most informative loci to track moth movements will be those that have recently increased in frequency due to strong positive selection locally. Most likely among those will be insecticide resistance genes, which currently include cadherin, ABC transporters, Cyp337b3, and kdr genes (Martinez-Torres et al., Reference Martinez-Torres, Devonshire and Williamson1997; Head et al., Reference Head, McCaffery and Callaghan1998; Gahan et al., Reference Gahan, Gould and Heckel2001, Reference Gahan, Pauchet, Vogel and Heckel2010; Joußen et al., Reference Joußen, Agnolet, Lorenz, Schöne, Ellinger, Schneider and Heckel2012). In fact, Cyp303a1, which Song et al. (Reference Song, Downes, Parker, Oakeshott and Robin2015) found to show the hallmarks of a selective sweep, and which belongs to the cytochrome P450 multigene family that includes classic detoxifying enzymes, may actually be a resistance allele itself. We note that Daly & Fisk (Reference Daly and Fisk1998) report a Z-linked endosulfan resistance in Australian populations, so Cyp303a1 may be a candidate gene worth testing for this trait. Similarly, the ABCB subfamily of ABC transporters is of particular interest as they encompass a class of proteins known as P-glycoproteins which have been shown to be involved in transporting xenobiotics out of the cell (reviewed in Buss & Callaghan, Reference Buss and Callaghan2008).
Conclusions
Our study has led us to the following four conclusions. Firstly, specific Z-linked loci (such as Cyp303a1) provide useful markers for inter-continental population structure in H. armigera. Secondly, an Australian haplotype at the Cyp303a1 gene is found in China and the length of this haplotype indicates that there has been recent gene flow from Australia to China. Thirdly, our deep sampling of Chinese allelic diversity reveals that low frequency, diverse haplotypes exist at multiple Z-loci within Chinese populations, and even when highly diverged haplotypes are excluded from the analyses, there is a skew toward rare variants in the dataset generally that we interpret as an evidence of population expansion. Fourthly, remarkable localized clusters of high F ST values occur across the H. armigera Z-chromosome, perhaps supporting the proposition that the H. armigera conferta subspecies may originate from an introgression event from an unknown species.
Supplementary material
The supplementary material for this article can be found at https://doi.org/10.1017/S0007485318000081


