Introduction
The family Dermestidae is a group of mostly xerophilic, necrophagic beetles that scavenge for dried, proteinaceous materials, such as dried fish, meat and hides (Peacock, Reference Peacock1993; Kiselyova & McHugh, Reference Kiselyova and McHugh2006; Zhantiev, Reference Zhantiev2009). This type of material is consumed mainly during the larval stages, whereas the majority of adults feed on plant material, generally nectar and pollen, to help with egg maturation (Kiselyova & McHugh, Reference Kiselyova and McHugh2006; Zhantiev, Reference Zhantiev2009). Exceptions do occur; for example, some species of Trogoderma can complete their entire lifecycle on plant material, making them pests of stored products (Hinton, Reference Hinton1945; Mroczkowski, Reference Mroczkowski1968).
Of particular interest to this study is the subfamily Anthreninae and, within it, the tribe Megatomini. This tribe is widespread, with most of the 27 extant genera occurring in the Palaearctic (11), Australian (9) and Oriental regions (4: Mroczkowski, Reference Mroczkowski1968; Peacock, Reference Peacock1993). One of the largest genera within the Megatomini tribe is the Trogoderma genus, containing approximately 130 described species (Hava, Reference Hava2003). Trogoderma species are geographically widely distributed and found in most zoogeographical regions defined by Mroczkowski (Reference Mroczkowski1968), excluding Antarctica and Ethiopian regions. The majority of species inhabit Australia (52 species not taking into account the proposed synonymies: A. Szito, personal communications) and the Neotropics (30 species: Mroczkowski, Reference Mroczkowski1968). Dispersal routes for Trogoderma have been proposed to have followed a similar path to mammals, migrating from North America to South America and into Australia at about 30 to 65 million years ago (MA) (Kiselyova & McHugh, Reference Kiselyova and McHugh2006). This scenario does not explain how several Trogoderma species come to exist in the Indian and Palaearctic regions, of which Trogoderma granarium Everts and Trogoderma variabile Ballion are major pests of stored grains (Hinton, Reference Hinton1945; Lowe et al., Reference Lowe, Browne, Boudjelas and De Poorter2000). Interestingly, the native Australian Trogoderma species are not pests of stored products, yet some species belonging to other Megatomini tribes, such as Anthrenocerus australis Hope and Orphinus fulvipes Guérin-Méneville, have been reported as minor pests to stored products other than grain (Hinton, Reference Hinton1945).
The latest phylogenetic study on the dermestid family, using larval morphological characteristics, was conducted by Kiselyova & McHugh (Reference Kiselyova and McHugh2006). The authors observed different Trogoderma species scattered throughout the crown of the tree and concluded that the genus Trogoderma was polyphyletic, but were unable to ascertain whether this was a result of inadequate larval data or the incomplete state of dermestid taxonomy (Kiselyova & McHugh, Reference Kiselyova and McHugh2006). Furthermore, in three instances, the relationship between Trogoderma and closely related genera was unable to be resolved, leading to multifurication at a number of nodes (referred to as polytomy). Multifurication can occur when there is insufficient data (referred to as ‘soft’ polytomy) or when real biological events, such as rapid radiation, occur (‘hard’ or true polytomy: Maddison, Reference Maddison1989; Humphries & Winker, Reference Humphries and Winker2010). If a group of species resulted from a rapid radiation event, then polytomy may not be resolved no matter how much data is included in the study.
As the dermestid fossil record is poor (Mroczkowski, Reference Mroczkowski1968; Kiselyova & McHugh, Reference Kiselyova and McHugh2006), a molecular clock in conjunction with the biogeographical distribution of several dermestid genera was used to investigate the origins of a few genera within Dermestidae. Since few molecular studies have been performed on this family, molecular clock data generated by Hunt et al. (Reference Hunt, Bergsten, Levkanicova, Papadopoulou, John, Wild, Hammond, Ahrens, Balke, Caterino, Gómez-Zurita, Ribera, Barraclough, Bocakova, Bocak and Volger2007) was used as a basis for this study. Dermestids belong to the series Bostrichiformia (Crowson, Reference Crowson1981), whose origins have been estimated at 219 MA (Hunt et al., Reference Hunt, Bergsten, Levkanicova, Papadopoulou, John, Wild, Hammond, Ahrens, Balke, Caterino, Gómez-Zurita, Ribera, Barraclough, Bocakova, Bocak and Volger2007). Assuming the Dermestid ancestors fed on angiosperm pollen, it is plausible to suggest that their origins are later than the oldest angiosperm pollen fossils which have been dated at 130 MA (Brenner, Reference Brenner1996). However, molecular data suggests that the radiation of angiosperms was somewhat earlier, 190 MA (Sanderson & Doyle, Reference Sanderson and Doyle2001). Beal & Zhantiev (Reference Beal and Zhantiev2001) did suggest that the Dermestidae origins were Pangean when a new species of Egidyella, only thought to occur in the deserts of central Asia, was found inhabiting the sand dunes of California. Therefore, on the balance of current available evidence, it is possible that the Dermestidae origins are Pangean (>175 MA), and thus that the Megatomini tribe is later than this period.
The objective of this study was to evaluate the existing morphologically based polyphyletic positioning of Trogoderma (in species both exotic and endemic to Australia) using a molecular phylogenetic approach. The second objective was elucidation of the molecular relationships between six related genera: Anthrenocerus Arrow, Anthrenus Müller, Attagenus Latreille, Dermestes Linnaeus, Orphinus Motschulsky and Trogoderma Dejean, in order to better understand evolutionary processes that may have led to their current biogeographical distributions, specifically, to investigate the relationship between the pest Trogoderma species and the Australian native Trogoderma. To study these relationships, three genes were selected. Cytochrome Oxidase I (COI), is frequently used for species identification (DNA barcoding), phylogeographical and phylogeny studies of closely related species (Hebert et al., Reference Hebert, Cywinska, Ball and deWaard2003; Foottit et al., Reference Foottit, Maw, Von Dohlen and Herbert2008; deWaard et al., Reference deWaard, Landry, Schmidt, Derhousoff, McLean and Humble2009; Castalanelli et al., Reference Castalanelli, Mikac, Baker, Grimm, Munyard and Groth2011), thus being well-suited for examining intra- and inter-specific variation at both the species and genus level. We also included mitochondrial Cytochrome b (CYT b), which evolves more slowly than COI (Castresana, Reference Castresana2001) to inform intermediate tree nodes. The entire 18S nuclear gene, a slowly evolving gene normally used in higher classification studies (Hwang et al., Reference Hwang, Ree and Won2000), was selected, as it might be needed to resolve deep polyphyletic structuring inferred in the earlier morphology based study by Kiselyova & McHugh (Reference Kiselyova and McHugh2006). The 18S gene included the expansion segments (also known as variable domains) that have been shown to help resolve genera within insects (Hwang et al., Reference Hwang, Ree and Won2000; Gillespie et al., Reference Gillespie, Tallamy, Riley and Cognato2008). Highly conserved and expansion segments within the nuclear gene, as well as faster evolving mitochondrial genes, were included in order to resolve the structure across the tree.
Materials and methods
Samples
More than 3000 dermestid specimens were collected during the Australian spring and summer (September to February) for three seasons from 2007 to 2010. Specimens were collected by either sweep netting or using a pheromone based trap. The traps were a Gypsy Moth bell trap (APTIV Inc) baited with a Khapra beetle kairomone attractant lure (Trécé Inc). The traps were hung from low-lying tree branches (<1 m from the ground) then filled with 20% propylene glycol. Every two months, the propylene glycol was transferred into plastic bottles and a new pheromone lure was added to the trap. A sieve with a 1 mm gauge was used to remove the specimens from the propylene glycol. The specimens were then rinsed with sterile water, followed by a 70% ethanol rinse and, finally, stored in 95% ethanol at −20°C. One specimen each of T. variabile, T. granarium, Anthrenocerus, Attagenus and A. verbasci were obtained from the Department of Agriculture and Food Western Australian insect collection.
Morphological identification
Due to the large number of specimens, the first step towards identification was to separate specimens into morphospecies, groups that shared similar morphological features. These features included club size and number, setae colour, body shape and the antenna cavity, or ‘fossa’, either open or closed at the posterior end (fig. 1). One to four specimens were taken from each group and used in the subsequent study (table 1). Due to the absence of morphological keys for most of the Australian native Megatomini, all the specimens were identified to genus level only, using descriptors outlined by Peacock (Reference Peacock1993) and Booth et al. (Reference Booth, Cox and Madge1990). Specimens of exotic T. granarium, T. variabile and A. verbasci were identified to species level using the morphological keys of Peacock (Reference Peacock1993).
Table 1. Specimens used in the phylogenetic study, including collection method, location and genetic loci analysed.

* Note: Quarantine intercepts are made at the border in Australia and exact origins overseas is uncertain.

Fig. 1. Photographs of (a) Anthrenocerus, (b) Trogoderma (sample 107) and (c) Orphinus (sample 116), highlighting the open and closed fossa, and antenna clubs. These morphological features are used to differentiate these genera. The Anthrenocerus photograph is courtesy of the Pest and Disease Image Library (PaDIL; http://www.padil.gov.au/).
DNA extraction
A non-destructive DNA extraction method, ANDE (Castalanelli et al., Reference Castalanelli, Severtson, Brumley, Szito, Grimm, Munyard and Groth2010) (www.ande.com.au) was used to extract DNA from all the specimens used in this study. These samples have been stored in the Department of Agriculture and Food's Insect Collection.
Amplification
Amplification of the COI, CYT b and 18S genes was performed using primer pairs C1-J-2183 and TL2-N-3014, CB-J-10933 and CB-N-11367 (Simon et al., Reference Simon, Frati, Beckenbach, Crespi, Liu and Flook1994), four pairs of 18S primers, and the T. granarium primers Tg-J-Cytb and Tg-N-Cytb (table 2). PCR volume was 25 μl, including 2.5 μl of ANDE extracted DNA (1:10 dilution DNA:water), which was the equivalent of 20 to 25 ng μl–1. The reaction mix comprised of 1×polymerase buffer (Roche), 1.8 mM MgCl2, 0.2 μM of each primer, 200 μM of each dNTP and 0.5 U of Faststart Hi Fidelity Taq polymerase (Roche). Due to the size of the 18S fragment (∼1850 bp) it was amplified in four sections. The four sections were amplified using primers that were designed using Primer 3 (http://frodo.wi.mit.edu/primer3/) to target conserved regions of previously published beetle 18S sequences (GENBANK accession numbers: AY748111, AY748105, AY748103, EF213875, EF213892, EF362981). Annealing temperatures and extension times varied as shown in table 2. The thermocycler conditions were: 95°C for 10 min; 40 cycles of: 95°C for 30 s, annealing for 30 s and 72°C for extension, with a single final extension period of 72°C for 5 min. Quality and quantity of the amplified PCR products was determined by agarose gel. The concentration of agarose gel was 1.5% w/v and was made up with 1×TAE buffer. Electrophoresis of the agarose gel was carried out for 1 h at 60 volts, then stained with ethidium bromide and examined under UV light. PCR products were purified by the addition of 10 U of Exonuclease I (NEB) and 2.5 U of Antarctic Phosphatase (NEB) and incubation for 30 min at 37°C followed by inactivation by heating the reaction to 80°C for 20 min. Purified DNA was stored at −20°C until required.
Table 2. PCR primers used to amplify the mitochondrial and nuclear genes.

Sequencing
Sequencing of the amplified genes was carried out by Macrogen Inc (Seoul, Korea) using an Applied Biosystems ABI 3730 48-capillary DNA analyser using Big Dye Terminator Technology according to the manufacturer's protocols (Applied Biosystems).
Data analyses
All sequences were edited using CodonCode Aligner 3.0.3 (CodonCode Corporation), and the sequences associated with each locus were aligned using the built-in version of MUSCLE (Edgar, Reference Edgar2004). MEGA 4 (Tamura et al., Reference Tamura, Dudley, Nei and Kumar2007) was used to calculate the Maximum Likelihood (ML) distances between individuals. The model used was Tamura-Nei, as it takes into account different substitution rates between nucleotides and corrects for multiple hits. The ML distance values were plotted against the number of transition and transversion to examine the levels of saturation at each codon position. The phylogenetic signal of each mitochondrial gene and the 18S were evaluated in PAUP 4.0 (Swofford, Reference Swofford2003) using the Partition Homogeneity Test (PHT). The parameters include hsearch, randomseed=0 and nrep=1000.
To examine the polyphyletic positioning of Trogoderma, the sequences from all three genes were concatenated to create an all-gene dataset. The Dermestidae lineage was rooted with Tribolium castaneum Herbst, of the series Cucujiformia, for both Parsimony and Bayesian analysis. Bayesian trees were generated using Mr Bayes 3.1.2 (Ronquist & Huelsenbeck, Reference Ronquist and Huelsenbeck2003) following the evolution model of GTR+I+Γ which was determined by jModelTester using both AIC and BIC (Posada, Reference Posada2008). The mitochondrial protein-coding genes (COI and CYT b) were divided into six partitions, each partition corresponding to the first, second and third codon positions, and the 18S was not partitioned. The program was run for gen=40,000,000, sample freq=1000, sump burnin=25,000 and sumt burnin=25,000. PAUP 4.0 was also used to generate Parsimony trees to compare against the Bayesian trees. Due to saturation at the third codon position, several approaches were adopted to generate the best tree. First, for each gene, the first, second and third codon positions were analysed separately; then, each tree was compared with majority rule to determine which position was forcing particular tree topologies. Second, total evidence trees were generated whereby we either weighted the first position at two or weighted the transition and transversions (1:2). The Parsimony trees were calculated under the following conditions: hsearch, addseq= random, nrep=10,000, swap=TBR, MaxTrees=Auto, with the additional parameters nchuck=5 and chuckscore=1 added for the bootstrapping analysis.
To estimate time to most recent common ancestor (TMRCA), Bayesian evolutionary analysis by sampling trees (BEAST: Drummond & Rambaut, Reference Drummond and Rambaut2007) was used. This allows for the nodes within the phylogenetic tree to be dated, which may help determine origins. The same concatenated dataset that was used to generate the Parsimony and Bayesian trees was used. The Dermestidae lineage was rooted with Tribolium castaneum Herbst, of the series Cucujiformia. The root height parameters were set to the following: prior distribution normal, mean 235 MA (std dev 10 MA). These dates correspond to origins of the series Cucujiformia, with the low boundary incorporating the origins of Bostrichiformia (series of Dermestidae: Hunt et al., Reference Hunt, Bergsten, Levkanicova, Papadopoulou, John, Wild, Hammond, Ahrens, Balke, Caterino, Gómez-Zurita, Ribera, Barraclough, Bocakova, Bocak and Volger2007). The Dermestes and Trinodies samples were clustered and the root height parameters were set to the following: prior distribution lognormal mean=2, SD=0.5, and offset lower bounds of 65 MA, which corresponds to the earliest fossil record (Cockerell, Reference Cockerell1917). Using the strict clock, both GTR and HKY evolution models were evaluated, gen=50,000,000 and log=500. Tree Annotator v1.5.4 was used to generate the consensus tree, using the following parameters: burnin at 10,000, posterior probability 0.95 and mean heights (Drummond & Rambaut, Reference Drummond and Rambaut2007).
Results
Mitochondrial sequence variation
The 743 bp of the mitochondrial COI was highly polymorphic, with 323 parsimony-informative nucleotide sites from 23 individuals. The average sequence divergence, calculated using ML distance, was 0.26 and the highest level of variation between Dermestid sequences was 0.35 (table 3). Cytochrome b (430 bp) was similarly polymorphic with 188 parsimony-informative sites from 17 individuals. Despite both genes having variation occurring at 43% of their sites, CYTb was considerably more variable with a divergence range of 0.25 to 0.46, the highest between two Trogoderma species collected in Australia (T96 and T134). The polymorphisms observed, within the mitochondrial genes, resulted in 63 (25%) and 34 (23%) non-synonymous changes in the amino acid sequence. No insertions or deletions were observed in the mitochondrial gene fragments. In addition, no stop codons were observed when the sequences were translated, suggesting that there were no NUMTs sequence within the dataset.
Table 3. Loci information including variable sites, pairwise divergence (%) values and transition/transversion ratios.

Saturation curves
The number of transitions and transversions for each codon position and mtDNA gene were plotted against ML distances to examine sequence saturation (fig. 2). For both genes, transition saturation was evident at the third position, illustrated by the plateauing of the polynomial curve. No transition saturation was observed at the first and second positions, but rather an upward directional curve. Similarly, transversion saturation was not observed at the first and second positions, only at the third positions.

Fig. 2. Saturation Plots for the three codon positions.
Analyses of 18S
The 18S ranged from 1839 to 1855 bp in length in which there were 78 parsimony-informative sites (table 3) from 26 individuals. These polymorphisms included 134 single nucleotide polymorphisms and 39 indels. As expected, 18S showed evidence of much slower evolution than COI and CYT b, with average sequence divergence of only 0.019, in comparison to 0.26 and 0.3, respectively. Limited variation was observed between the variable domains of the 18S, with only 21 polymorphic sites, of which five were parsimony-informative. Variation within the seven variable domains ranged from two to 46 polymorphic sites. Three variable domains were highly variable (V2, V4 and V7) containing 40, 46 and 44 polymorphic sites, respectively. Sequence length variation was only observed within the V2, V4, V7 and V9 domains and was the result of increased sequence length of the Attagenus sample and Australian Trogoderma sample 96.
Partition homogeneity test
The different number of polymorphic sites observed within all of the variable domains indicated that each domain was under varying evolutionary constraints (Weider et al., Reference Weider, Elser, Crease, Mateos, Cotner and Markow2005). To determine if this may lead to incongruence between the nuclear and mitochondrial genomes, a PHT was performed to compare the variable domains to each other as well as the mitochondrial genes. The PHT revealed that there was no significant incongruence between any of the gene fragments. Therefore, the gene fragments were concatenated and used to generate a total evidence tree.
Bayesian and parsimony trees
The primer pairs did not successfully amplify all specimens; therefore, there are differing numbers of total COI, CYT b and 18S sequences available in this dataset. The high levels of variation within the mitochondrial genes suggested possible mismatch in the priming sites as a cause for failure to amplify. Seven pairs of alternative primers were trialled but amplification was refractory. Samples with missing sequences were included in the analysis, but the sequence data was treated as missing. Maximum likelihood distances (Tamura-Nei) were calculated for the combined COI and CYT b, and 18S for the 23 individuals (table 4).
Table 4. Maximum Likelihood distances between the 23 individuals that were used to construct the phylogenetic trees; below the diagonal is COI and CYT b combined, and above the diagonal is the 18S.

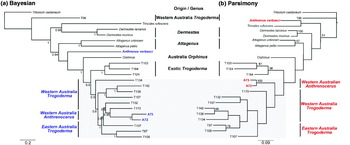
The Bayesian phylogenetic tree identified Trogoderma as paraphyletic with respect to Dermestes, Trinodes, Attagenus, Anthrenus, Orphinus and Anthrenocerus (fig. 3a). The majority of the Trogoderma and Anthrenocerus species form a well-supported sister group to the Orphinus sample (posterior probability 1). The only exception was the Australian Trogoderma sample 96 that was sister to the rest of the ingroup. This sample was morphologically re-examined and confirmed to be part of the Trogoderma genus. The exotic Trogoderma species, originally from the Palaearctic and Indian regions, were strongly supported sister taxa (posterior probability 1.00; fig. 3a). This exotic Trogoderma clade was sister to the Australian Trogoderma clade and the Anthrenocerus samples. The two Anthrenocerus samples were nested deep within the Australian Trogoderma clade and sister to T170. While the Bayesian analysis was able to resolve all but the deepest internal node, the majority of internal branches within the discordant zone (grey box; fig. 3) were short.

Fig. 3. (a) Bayesian and (b) Parsimony trees based on the combined 18S, COI and CYT b datasets. The value below the branch of the Bayesian tree represents the Bayesian posterior probably. The values below the line represent of the Parsimony tree represents bootstrapping values. Nodes with <50% bootstrapping support were not shown on the tree. The outgroup for both trees was T. castaneum.
Due to saturation at the third position, each codon position was concatenated with the 18S and analysed separately using Parsimony (data not shown). All parsimony trees supported the same deep nodes as the Bayesian analysis, but major structural change was observed below the Attagenus clade and within the discordant zone. The first codon position supported the placement of the exotic Trogoderma but positioned Anthrenocerus as sister to the Australian Trogoderma and clustered A. verbasci with T. rufescens. The second position nested the exotic Trogoderma and Orphinus deep within the Australian Trogoderma clade. Interestingly, only three polymorphisms between T. granarium (T124), T107 and T134 were observed. The placement of Anthrenocerus mirrored that of the Bayesian analysis. The third position also placed the exotic Trogoderma and Anthrenocerus deep within the Australian Trogoderma clade. This placement of the exotic Trogoderma was rejected as it was neither biologically or biogeographically sensible nor phylogenetically robust.
Each position was reanalysed with the transversions/transititions weighted 2:1. This made minimal difference and the same Parsimony trees were returned. Finally, the first position was weighted twice that of the other positions (2:1). Parsimony trees generated under these parameters generated four equally parsimonious trees, each with a score of 3857 (fig. 3b), which was the closest match to the Bayesian tree (fig. 3a). The main differences were A. verbasci, forming a clade with T. rufescens, and Anthrenocerus clade, which was sister to the Australian Trogoderma. Minimal bootstrapping support was generated on each node. Apart from the clades that had bootstrapping support >50%, all samples within the discordant zone shared different common ancestors.
BEAST analysis
Estimates of TMRCA were generated using BEAST (Drummond & Rambaut, Reference Drummond and Rambaut2007). Both GTR and HKY substitution models predicted effective sample sizes (ESS) >200, indicating a moderate degree of support for each node. GTR ESS values were slightly higher and, subsequently, this model was used to estimate TMRCA. The split between the series Bostrichiformia and Cucujiformia was estimated at 237 MA, with the ingroup estimated at 209 MA (fig. 4, table 5). The TMRCA for Attagenus was calculated at 194 MA, while the common ancestor for A. verbasci was 181 MA. The mean estimate for the Orphinus common ancestor was 157 MA. The proposed common ancestor for exotic Trogoderma was 102 MA, while the split from the Australian Trogoderma and Anthrenocerus was 141 MA. The common ancestors for the Australian Trogoderma samples, excluding sample 96, ranged from 128 to 66 MA.
Table 5. Time to most recent common ancestor using BEAST.

Fig. 4. Phylogenetic history of the Dermestidae genera Attagenus, Anthrenus, Anthrenocerus, Dermestes, Trogoderma and Orphinus. (a) Timeline of the continental breakup and drift from 250 MA to present (based on Li & Powell, Reference Li and Powell2001). (b) Bayesian tree with estimations of time to most recent common ancestor (MA). Mean time estimates are shown after the node. Scale bars are located above and below the phylogenetic tree and represent millions of years. The outgroup Tribolium castaneum is from the superfamily Curcjiformia. (c) The geologic timeline from the Triassic to the present.
Discussion
Despite discordance between Bayesian and Parsimony approaches, the genus Trogoderma, according to this study and excluding Trogoderma sample 96, is paraphyletic with respect to Anthrenocerus. The current taxonomic nomenclature of the Megatomini tribe, as described by Peacock (Reference Peacock1993) and Booth et al. (Reference Booth, Cox and Madge1990), uses two main morphological characteristics to differentiate Anthrenocerus and Trogoderma. The main morphological characteristics used are the number of antenna segments that form the club and the open or closed fossa. The Anthrenocerus genus is identified by the three segmented clubs joined eccentrically. In comparison, Trogoderma have three to eight segmented clubs, joined more or less symmetrically along the central axis. However, several species of Trogoderma, held in the Department of Agriculture and Food Western Australian insect collection, have well-defined three-segmented clubs that are eccentrically joined. The only definitive difference between these two genera is the closed antennal fossa found in Anthrenocerus species. Our study, similar to the morphological study conducted by Kiselyova & McHugh (Reference Kiselyova and McHugh2006), suggests that Anthrenocerus is possibly an Australian Trogoderma variant.
The morphological characteristics used to delineate Trogoderma, as well as the results presented here, suggest that the body plan of Trogoderma has been retained throughout history (parallelism) rather than arising independently (convergent evolution: Wiens et al., Reference Wiens, Chippindale and Hillis2003). This may give the impression that morphologically similar species are more closely related than they are genetically, a common phenomenon (Bossuyt & Milinkovitch, Reference Bossuyt and Milinkovitch2000). The number of morphological characteristics used to delineate between the three Trogoderma groups (sample 96, the exotic Trogoderma and the Australian native Trogoderma; fig. 3b) are minimal. One of the main external differences between the exotic and Australian native Trogoderma are the lighter-coloured patterns in the integument of the elytra of the exotic Trogoderma and setae colour. Interestingly, morphological comparisons between the Australian native Trogoderma and Trogoderma sample 96 were negligible, yet the phylogenetic trees grouped these individuals at opposite ends of the tree and a ML distance >0.29. The conservation of morphological characters is not uncommon and has been observed in frogs (Bossuyt & Milinkovitch, Reference Bossuyt and Milinkovitch2000; Chiari et al., Reference Chiari, Vences, Vieites, Rabemananjara, Bora, Ramilijaona Ravoahangimalala and Meyer2004), bacteria (Degnan et al., Reference Degnan, Lazarus and Wernegreen2005) and other insects (Buckley et al., Reference Buckley, Attanayake and Bradler2009). This suggests parallelism of the Trogoderma characteristics and that, even with major morphological taxonomic revision, the paraphyly in Trogoderma may not be easily resolved.
A high degree of branch swapping was observed when the Parsimony and Bayesian approaches were compared, despite Bayesian generating trees with high levels of posterior probability support on all nodes. This lack of agreement between Bayesian and Parsimony trees is not uncommon and is a phenomena previously observed (Shoup & Lewis, Reference Shoup and Lewis2003; Khan et al., Reference Khan, Arif, Bahkali, Farhan and Homeidan2008). To explain this lack of congruence between the two phylogenetic approaches, three commonly attributed causes were investigated: homoplasy, gene divergence rates and lineage sorting (O'Huigin et al., Reference O'Huigin, Satta, Takahata and Klein2002; Cantarel et al., Reference Cantarel, Morrison and Pearson2006; Rasmussen & Kellis, Reference Rasmussen and Kellis2007; McCormack et al., Reference McCormack, Huang and Knowles2009).
The saturation plots illustrated that transitions and transversion saturation had been reached at the third position, suggesting that homoplasy is present within our dataset. The presence of homoplasy at the third position may make it difficult for Parsimony to generate accurate trees as no nucleotide substitution models are employed and the tree with least number of steps is preferred (Page & Holmes, Reference Page and Holmes1998). Furthermore, at the second position, only three polymorphisms between T. granarium (T124), T107 and T134 were observed, making these species look more closely related than they are at other base sites. In this study, both the presence of homoplasy and invariable sites may have contributed to inaccuracies between trees.
The ML distances for COI and CYTb were considerably high, with the Trogoderma distance only 0.21 (between T170 and T107; table 4). Cytochrome b, which has previously been reported as a slower evolving gene (Castresana, Reference Castresana2001), in our study, mutated at a greater rate than COI. In comparison, minimal divergence was observed within the 18S. Previous studies examining the effect that divergence has on tree accuracy concluded that accuracy and divergence are proportional (Cantarel et al., Reference Cantarel, Morrison and Pearson2006; Rasmussen & Kellis, Reference Rasmussen and Kellis2007). Rapidly evolving genes can write over the phylogenetic signals, whereas slowly evolving genes may have insufficient informative sites. In our case, either increasing the number of closely related Trogoderma species or a gene evolving slower than COI and CYT b would likely help increase support within the discordant zone.
Alternatively, the polytomy observed in the Parsimony trees and the short internal branch lengths within the Bayesian trees may represent hard polytomy or lineage sorting. Lineage sorting is a process whereby three or more species radiate rapidly such that an ancient polymorphism is retained in all descendents and by chance each species may share a set of alleles at different loci (McCracken & Sorenson, Reference McCracken and Sorenson2005). Therefore, the Parsimony polytomy and short internal nodes from the Bayesian analysis may signify rapid radiation (hard polytomy) and lineage sorting, not in inaccuracies in the phylogenetic models or selected genes.
The interpretation of the biogeographical distributions and TMRCA (BEAST) for Anthrenus, Anthrenocerus, Attagenus, Dermestes, Orphinus and Trogoderma allows postulations about the origins of the Dermestidae family. Current biogeographical distribution of Attagenus species includes: the southern Palaearctic (45%), Ethiopian (35%), Oriental (7%) and Nearctic (5%) regions (Mroczkowski, Reference Mroczkowski1968), which were all connected as part of the supercontinent Pangaea (Li & Powell, Reference Li and Powell2001). For Dermestes, the majority of the 73 species are found in the Palaearctic (50%) and Nearctic (26%) (Mroczkowski, Reference Mroczkowski1968). Approximately 175 MA, Pangaea began to break-up and a rift formed between North America and Africa, resulting in the continents Laurasia and Gondwana (Li & Powell, Reference Li and Powell2001). With a high proportion of Attagenus and Dermetes found on both Laurasia and Gondwana, the origins must be earlier than this vicariant event. Estimation of date of origin by BEAST placed the Attagenus and Dermestes samples near the base of the tree (fig. 4), a similar position to that in the morphological study by Kiselyova & McHugh (Reference Kiselyova and McHugh2006), with a value of 209 MA (±33 MA). Furthermore, molecular data suggests angiosperms evolved at, or after, 190 MA (Sanderson & Doyle, Reference Sanderson and Doyle2001), which together suggests that the origin of the Dermestidae family is the mid-early Jurassic (>175 MA) on the Pangean supercontinent.
Orphinus appear to have a Gondwanan distribution, with the majority of species found in the Australian, Oriental and Ethiopian regions (Mroczkowski, Reference Mroczkowski1968). Based on biogeographical data, it seems reasonable to suggest that the origins of Orphinus are Ethiopian and prior to the west Gondwana (Africa, Arabia and South America) and east Gondwana (Australia, Antarctica, Madagascar and India) split, approximately 160 MA (Li & Powell, Reference Li and Powell2001). This placement of origin was supported by BEAST, which estimated the common ancestor of Orphinus at 157 MA. Future studies will need to include Orphinus from multiple biogeographical locations to determine if this group is monophyletic.
The origins of the Trogoderma and Anthrenocerus clade, excluding sample T96, were estimated at 141 MA. Using this date, the scenario, proposed by Kiselyova & McHugh (Reference Kiselyova and McHugh2006), that Trogoderma followed the dispersal of marsupial mammals (carcasses of which are a likely food source for larvae) from North America to South America and in to Australia around 30 to 65 MA is doubtful. Rather, it is plausible to suggest that Trogoderma's origins are East Gondwanan, whereby they inhabited both the Indian and Australian continents. The exotic Trogoderma, inhabited the Indian continent which collided with Asia approximately 55 MA (Klootwijk et al., Reference Klootwijk, Gee, Peirce, Smith and McFadden1992), allowing this genus to spread east into the Palaearctic. Rather than Trogoderma migrating from North America to South America and then to Australia, it is more likely that migration was in the opposite direction. We base this scenario on a number of factors. First, the number of Trogoderma species decreases as we move away from Australia. Second, the lack of species present within the Ethiopian region and the date estimated by BEAST suggest that Trogoderma were not present prior to the Gondwana split. Third, several nodes within the Trogoderma clade are greater than 100 MA. Finally, this scenario provides a link between the Australian and Exotic Trogoderma. To further confirm this scenario, North and South American samples are required, and this could be a potential avenue of future work.
The phylogenetic analysis provided an interesting insight into the evolution of the Trogoderma genus, as well as several Dermestidae genera. While this study was unable to resolve the polyphyly reported using the current taxonomic nomenclature, this study did highlight three interesting Trogoderma groups. The species within these groups need to be further scrutinised to determine if they have unique characteristics which have been overlooked, thus resulting in the clumping of the species. However, it seems possible that Trogoderma is a common ancestor to a proportion of the Dermestidae genera, especially given the limited morphological characteristics that differ between Anthrenocerus, Orphinus and Trogoderma and the minimal dietary differences between Trogoderma and all other dermestids. This study also showed the importance of a well-sampled dataset, especially if polytomy is caused by a lack of closely related samples, as the addition of new species may alter the topology of the phylogenetic trees and lead to inaccurate assumptions.
Acknowledgements
This work was supported by the CRC for National Plant Biosecurity. The authors would like to thank Andras Szito for sharing his knowledge on the Australian Trogoderma species, it is second to none. We would like to thank the two anonymous reviewers for their comments that improved the quality of the manuscript.