Introduction
The Mediterranean fruit fly (Medfly), Ceratitis capitata (Wiedemann) is one of the world's most destructive agriculture and horticulture pests (White and Elson-Harris, Reference White and Elson-Harris1992). Its wide host range and tolerance of cooler climates make it highly invasive as a world-wide biosecurity threat (Malacrida et al., Reference Malacrida, Gomulski, Bonizzoni, Bertin, Gasperi and Guglielmino2007). Every year, Medfly causes considerable damage to fruits, vegetables and international trade in horticultural products (White and Elson-Harris, Reference White and Elson-Harris1992). Governments have taken strict approaches and created policies aiming to minimize Medfly risks and damages. Pre-harvest actions including biological control, pesticides, monitoring as well as inspections, and post-harvest control methods such as cold storage, heat treatment, fumigation and irradiation have been widely applied in fruit fly management. While much more attention has been paid to deploying pre-harvest treatments, post-harvest treatments are essential and often legally mandated for market access. In post-harvest treatment technologies, chemical methods (e.g., fumigation) bring in serious public concerns on chemical residues, insecticide resistance and health hazards for packhouse workers and consumers. Therefore, non-chemical treatments including heat, cold, low-oxygen and irradiation are becoming increasingly preferred (Broughton and De Lima, Reference Broughton and De Lima2002; Dohino et al., Reference Dohino, Hallman, Grout, Clarke, Follett, Cugala, Tu, Murdita, Hernandez, Pereira and Myers2017; Al-Behadili et al., Reference Al-Behadili, Bilgi, Li, Wang, Taniguchi, Agarwal, Ren and Xu2019; Al-Behadili et al., Reference Al-Behadili, Agarwal, Xu and Ren2020a).
Currently, a fundamental understanding of the biological responses of fruit flies to post-harvest stressors such as heat and cold is missing. Genome sequencing has been completed on C. capitata, providing an invaluable data resource to explore the molecular mechanism of this species (Papanicolaou et al., Reference Papanicolaou, Schetelig, Arensburger, Atkinson, Benoit, Bourtzis, Castanera, Cavanaugh, Chao, Childers, Curril, Dinh, Doddapaneni, Dolan, Dugan, Friedrich, Gasperi, Geib, Georgakilas, Gibbs, Giers, Gomulski, Gonzalez-Guzman, Guillem-Amat, Han, Hatzigeorgiou, Hernandez-Crespo, Hughes, Jones, Karagkouni, Koskinioti, Lee, Malacrida, Manni, Mathiopoulos, Meccariello, Munoz-Torres, Murali, Murphy, Muzny, Oberhofer, Ortego, Paraskevopoulou, Poelchau, Qu, Reczko, Robertson, Rosendale, Rosselot, Saccone, Salvemini, Savini, Schreiner, Scolari, Siciliano, Sim, Tsiamis, Urena, Vlachos, Werren, Wimmer, Worley, Zacharopoulou, Richards and Handler2016). Uncovering the molecular basis of Medfly responses to cold and heat using cost-effective next-generation sequencing and bioinformatics technologies become important for refining current post-harvest treatments. This knowledge could also guide new control strategies that can combine various lower-dose stresses to achieve higher fruit fly mortality but minimize the impact on fruit qualities.
Previously, a heat treatment on Medfly was conducted and 31 candidate genes which showed significant changes in gene expression was identified (Anantanawat et al., Reference Anantanawat, Papanicolaou, Hill and Xu2020), including four heat shock proteins (HSPs): HSP60, HSP70, HSP23-like and HSP83-like. These genes have been reported with functions in autophagy cell death, cellular response to heat, immunity, protein folding and apoptosis in many other animal species. It was the first study identifying Medfly genes involved in the responses to heat treatment. A further high-resolution exploration involving the identified candidate genes at 11 different timepoints was conducted based on their variability to the heat stress response and recovery (Anantanawat et al., Reference Anantanawat, Papanicolaou, Hill and Xu2020). However, are these genes also involved in C. capitata responses to cold? It has been reported that in Liriomyza sativa and Liriomyza huidobrensis, HSP40, HSP20, HSP70 and HSP90 were induced by both heat and cold stresses (Huang et al., Reference Huang, Chen and Kang2007, Reference Huang, Wang and Kang2009). Furthermore, Hsp70 expression was up-regulated with cold-acclimation and cold exposure in Drosophila melanogaster (Štětina et al., Reference Štětina, Koštál and Korbelová2015). Therefore, it is likely that the genes we previously identified from Medfly responses to heat, especially those HSPs, may also respond to cold stressors. To answer this question, a cold bioassay was performed in this study and those candidate genes were examined from the same 11 timepoints as previously described (Anantanawat et al., Reference Anantanawat, Papanicolaou, Hill and Xu2020). This study aimed to compare the expression levels of the candidate genes between heat and cold treatments to investigate whether Medfly demonstrate the same molecular response to both heat and cold treatments.
Materials and methods
Medfly culture
The Medfly colony used in this study is originated from a laboratory colony established at the Department of Primary Industries and Regional Development in Western Australia (Al-Behadili et al., Reference Al-Behadili, Agarwal, Xu and Ren2020b), which was periodically supplemented with wild flies. The Medfly colony was maintained in a quarantined laboratory at the South Australian Research Development Institute, where the bioassays were conducted as well. After female flies laid eggs through a mesh, the eggs were collected and transferred into the liquid diet prepared as described (Chang et al., Reference Chang, Vargas, Caceres, Jang and Cho2006). Medfly colony was reared at 24 °C, 70% humidity and 12 h light:12 h dark. Medfly pupae were collected and kept at 24 °C, 70% humidity and emerged adults were bred on the yeast hydrolysate (MP Biomedical), crystalline sugar and water.
Cold bioassays
The cold bioassays were carried out in a freezer (−17.0 ± 1.0°C) on C. capitata early non-feeding third instar larvae (L3). To ensure a consistent starting temperature, the freezer door was kept shut for at least 30 min prior to the experiment to ensure the temperature was stable. A thermometer was precisely calibrated and utilized to monitor the temperature inside the freezer. Individual L3 were placed in individual cells of a 96-well plate without any diet and each plate represents one cold treatment.
To determine the timepoint that delivers Medfly L3 mortality under −17.0 °C, various time periods including 0 (the control), 5, 10, 15, 20, 25 and 30 min were used. Treated L3 from different timepoints were collected and transferred to the rearing incubator (24 °C and 70% humidity) for calculating the mortalities. If a treated Medfly L3 successfully pupated, it was defined as a ‘survivor’, otherwise ‘dead’. Each cold stress experiment was repeated four times on different dates. The log proportion of dead larvae [log(P)] in response to the cold treatment at −17 °C was the dependent variable and the exposure time (0, 5, 10, 15, 20, 25 and 30 min) was the independent variable. A non-linear regression model was constructed to estimate the dosage resulting in 75% mortality. The sub-lethal cold-stress dose that can cause 75% mortality of tested Medfly L3 from a mortality trajectory was calculated, just the same as the previous study (Anantanawat et al., Reference Anantanawat, Papanicolaou, Hill and Xu2020).
RNA purification and cDNA library construction
The treated and control C. capitata L3 were individually collected to extract RNA at 11 different timepoints including: before the cold treatment (T0), right after the cold treatment (T1) and 7.5, 15, 30, 45, 60, 75, 90, 105 and 120 min after the treatment, which are exactly the same timepoints as described in the heat treatment study (Anantanawat et al., Reference Anantanawat, Papanicolaou, Hill and Xu2020). Each individual L3 represents one RNAseq library replicate. Two to five individual (replicates) C. capitata L3 were collected per timepoint (Supplementary Table 1) and the RNAseq library preparation was performed as described before (Anantanawat et al., Reference Anantanawat, Papanicolaou, Hill and Xu2020).
Library sequencing
A bioanalyzer (Agilent, USA) was used to evaluate the sizes of the DNA fragments in barcoded libraries. Qubit High Sensitivity DNA kit (Thermo Fisher Scientific, Australia) and NEBNext Library Quant Kit (New England Biolabs, USA) were utilized to measure the quantities of the constructed libraries. Each individual library was pooled together with an equal amount, and the mixture was concentrated using Illustra GFX PCR DNA and Gel Band Purification Kit (GE Life Science, USA) (Anantanawat et al., Reference Anantanawat, Papanicolaou, Hill and Xu2020). All the established cDNA libraries were sent to the Ramaciotti Centre for Genomics in University of New South Wales (Sydney, NSW) for sequencing on a Nextseq 500 system with read lengths up to 2 × 150 bp.
Gene expression profiles
The sequencing data were quality controlled and processed by using the same pipeline as described previously (Anantanawat et al., Reference Anantanawat, Papanicolaou, Hill and Xu2020). The gene expression profiles of candidate genes were generated as per RNASeq experiment: (1) Bowtie2 (http://bowtie-bio.sourceforge.net/bowtie2/index.shtml) was used here to align the reads from each individual library against a sequence file comprised of the identified genes; (2) eXpress was utilized to post-process the alignments to account for isoforms and paralogues; (3) trimmed mean normalization (TMM) was performed by using edgeR (Robinson et al., Reference Robinson, McCarthy and Smyth2010) and (4) data were finally visualized as described before (Anantanawat et al., Reference Anantanawat, Papanicolaou, Hill and Xu2020). The relative gene expression levels at each timepoint were analyzed using Excel 2016. The results were given as means ± standard error (SE). The statistical significance of the gene expressions in different timepoints was calculated using Student's t-test to compare between heat-treated and cold-treated flies while p < 0.05 was considered statistically different.
Results
Cold treatment bioassays
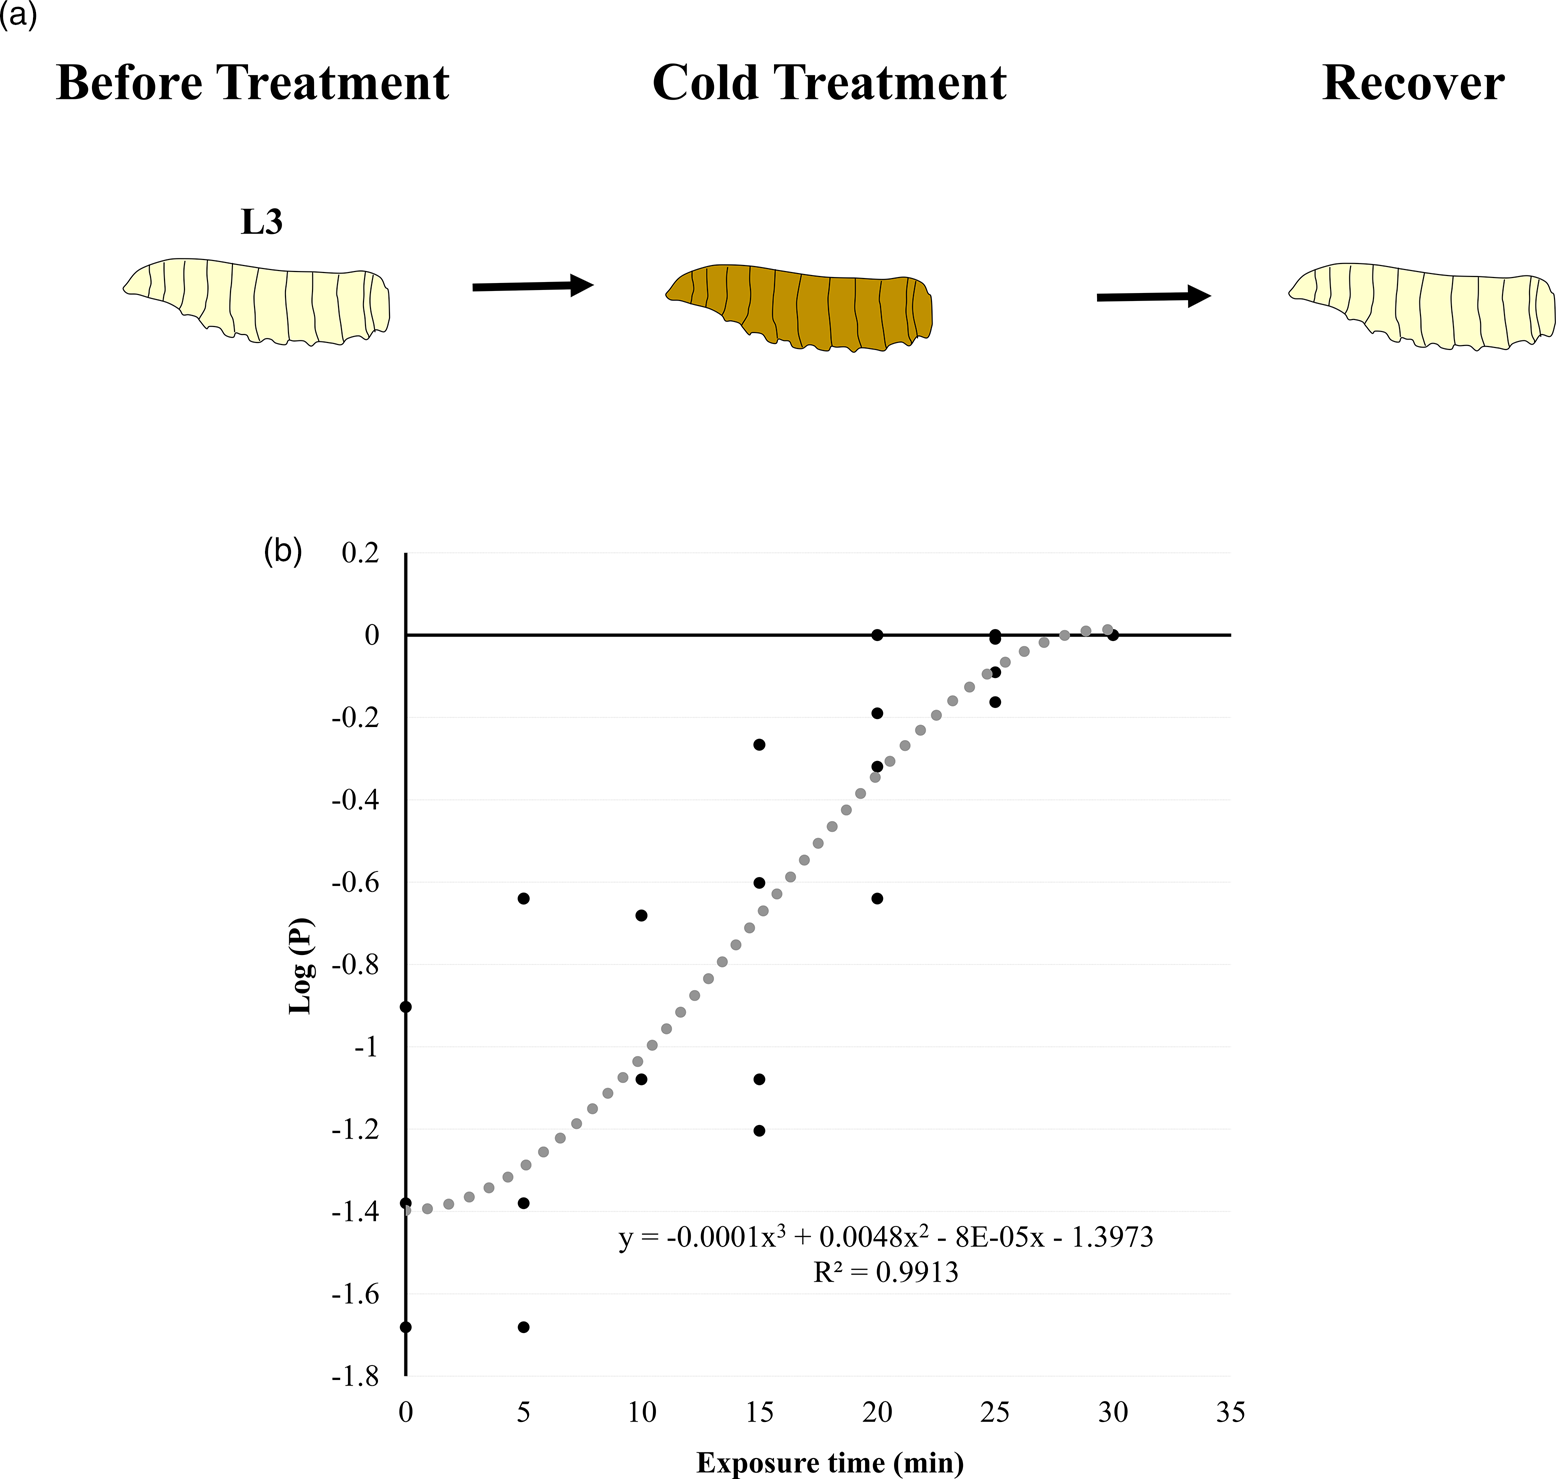
The bioassay experiment set up is shown in fig. 1. Under −17.0 °C, Medfly L3 mortalities were examined at different exposure times based on the pupation ratios. The log proportion of dead larvae (y) on the treated time (x) at −17.0 °C is y = −0.0001x 3 + 0.0048x 2 − 8 × 10⁻⁵x − 1.3973, R 2 = 0.9913. Exposure over 30 min resulted in 100% mortality (no pupae). The exposure time to kill 75% Medfly L3 was estimated 22 min and 24 s (fig. 1B), which was the treatment time (T1) used to deliver 75% mortality in this study.

Figure 1. Experiment for the cold treatment on C. capitata 3rd instar larvae (L3). (A) The schematic process for the cold treatment on C. capitata L3. (B) The proportion of dead C. capitata L3 in response to the cold stress at −17 °C. The black dash-line represents the best fit curve. The Y axis represents the log proportion of dead larvae in response to the cold treatment at −17 °C. The results showed that under −17 °C heat treatment, exposure time to kill 75% C. capitata L3 is 22 min 24 s. T0 means before the treatment and T1 means immediately after the treatment.
Expression profiles
The expression profile was investigated on the candidate genes which have been identified in heat treatment (Anantanawat et al., Reference Anantanawat, Papanicolaou, Hill and Xu2020) (fig. 2).

Figure 2. Normalized expression profiles of interested genes in C. capitata L3 before treatment, immediately after treatment, 7.5, 15, 30, 45, 60, 75, 90, 105 and 120 min after cold treatment. Two to five replicates for each timepoint (Supplementary Table 1). The expression level of each individual target gene before the treatment was used as a standard (100%) to normalize the expression levels at other timepoints. A color key including 50, 100, 200, 500 and 3000% expression was provided.
The expression level of each individual target gene before the treatment was used as a standard (100%) to normalize the expression levels at other timepoints. All the studied genes presented expression changes after the cold treatment (fig. 2). Most of these candidate genes started to show an expression increase immediately after the treatment except heat shock protein 70 (hsp70) and hsp23-like, which showed a decrease (fig. 2). Hsp70 exhibited the highest gene expression increase (~27-fold) at 45 min after the cold treatment. Hsp83-like exhibited the second highest expression increasing at 45 min (~10-fold) after the cold treatment. Various candidate genes exhibited extra gene expression peaks after the treatment (fig. 3) and decrease the expression from 90 to 105 min post-treatment (fig. 2), for example, putative uncharacterized protein and dual oxidase.

Figure 3. Comparative expression profiles of selected genes in C. capitata L3 at T0, T1, 7.5, 15, 30, 45, 60, 75, 90, 105 and 120 min after heat treatment (Anantanawat et al., Reference Anantanawat, Papanicolaou, Hill and Xu2020) and cold treatment. Values are means ± SE. The statistical significance of the gene expressions in different timepoints was calculated using Student's t-test. * means p < 0.05.
Comparison of candidate genes’ expression levels between heat and cold treatment
To study individual gene expression profile, the expression levels of individual genes were analyzed at 11 different timepoints between heat and cold treatment (fig. 3). The results revealed that most of the interesting genes’ expression profiles were significantly different between heat and cold treatments.
Firstly, all the genes’ expression levels increase higher in cold treatment than those in heat treatment although the highest expression timepoints may be different. For example, hsp70 exhibited the highest expression increase (~26-fold) at 45 min after the cold treatment while 30 min after the heat treatment (~15-fold). Hsp83-like exhibited highest expression level (~10-fold) at 45 min after the cold treatment while 7.5 min after the heat treatment (~5-fold) (fig. 3).
Second, most of the studied genes showed extra expression peaks in their expression levels after the cold treatment comparing to the heat treatment, which include putative uncharacterized protein DDB, la-related protein 1, max-like protein X, hsp60, teneurin-a isoform X2, myosin-IB, C-myc promoter-binding protein, protein espinas, dnaJ homolog subfamily A member 4, protein patched, myc protein and neuropathy target esterase sws. For example, hsp60 only showed two peaks in expression increase at 15 and 75 min, respectively, after the heat treatment while three peaks after the cold treatment, with one extra peak (~2-fold) at 45 min after the cold treatment. The same extra peak at 45 min after the cold treatment was observed in nearly all genes described above, but was not observed in the heat treatment. However, succinyl CoA ligase [ADP forming] subunit beta showed very similar expression profiles between heat and cold treatment.
Moreover, certain genes showed the same numbers of peaks in their expression profiles but at different timepoints. For example, hsp70 exhibited a peak (~26-fold) at 45 min after the cold treatment while 30 min after the heat treatment (~15-fold). Hsp83-like and hsp23-like genes presented their first peaks at 7.5 min or 15 min after the heat treatment respectively but at 45 min after the cold treatment.
Last but not least, except for succinyl-CoA ligase [ADP-forming] subunit beta, all other genes exhibited significantly different expression levels (p < 0.05) on at least one timepoint between heat and cold treatments (fig. 3). For example, hsp70, hsp23-like and hsp83-like only showed significant different expression level between heat and cold treatments at 45 min after treatments. However, ‘protein patched’ showed significantly different expression levels at 15, 30, 45, 60, 90 and 105 min after treatments (fig. 3). All these differences suggest the molecular responses of Medfly are different between heat and cold treatments.
Discussion
In this study, a laboratory-based bioassay was successfully established to study Medfly larval responses to cold. Moreover, a model was generated based on this cold bioassay to investigate the mortality of Medfly L3 to cold treatment. The L3 was selected because a higher quality and amount of RNA sample could be extracted from one individual L3 than L1, L2 or egg. To define the treatment dose (time), 75% mortality was utilized because this dose can provide considerable lethal stress to Medfly, but not cause 100% mortality, which may lead to RNA degradation. In total, 75% mortality was also used in the previous heat treatment, so it was believed as a good dose for treatment and comparative analysis between heat and cold in this study. Industry cold treatments directly target fruit flies in various fruits, for example, grape, cherry, apply and blueberry, but not ‘naked’ flies. Different fruits are quite different in cold transfer due to their different sizes, compositions, nutrients and chemicals (Wang et al., Reference Wang, Tang and Cavalieri2001). Fly development and infestation methods for different fruits also vary significantly (Hallman, Reference Hallman2014). Cold treatment of flies inside fruits and then collecting fly RNA samples may result in significant time-consuming, sample degradation and RNA contamination. Therefore, to reduce these risks, naked flies were chosen rather than the flies inside fruits. Moreover, the industrial cold treatment generally uses 1, 2 or 3 °C to kill flies. These temperatures were not selected in this study because it will take too long (over 1 week) to achieve 75% mortality (Al-Behadili et al., Reference Al-Behadili, Agarwal, Xu and Ren2020a). Treated L3 may develop to pupae during such a long treatment, so it is difficult to compare the gene expressions between treated and control flies. The gene expression changes may not be caused by the selected stressor (heat or cold) itself, but by Medfly development stages. Therefore, an acute cold treatment (−17.0 ± 1.0 °C) was chosen because it can kill flies quickly (less than 30 min). A number of questions need to be considered. For example, are the fly molecular responses to the sharp cold (−17.0 ± 1.0 °C) in this study the same as those in industry cold treatment? Are fly molecular responses to cold inside fruits the same as those ‘naked’ in this study? Are Medfly L3 molecular responses to cold the same as those in L2, L1 or eggs? This experiment is a first trial into this field and further studies need to be conducted to answer all these questions in future.
In the previous study, 31 genes were identified from the heat treatment on Medfly L3. They belong to five Gene Ontology (GO) groups including autophagy cellular response to heat, cell death, protein folding, defense response and apoptotic process (Anantanawat et al., Reference Anantanawat, Papanicolaou, Hill and Xu2020). Four HSPs were identified and they are HSP23-like, HSP60, HSP70 and HSP83-like. It has been widely reported that HSPs are involved in responses to heat, cold crowding and anoxia (King and MacRae, Reference King and MacRae2015). They play crucial roles as molecular chaperones to help new proteins correctly fold or refold proteins that were damaged by the stress (King and MacRae, Reference King and MacRae2015). These four HSPs may play critical roles in Medfly responses to cold and heat treatments as well.
The comparison of these genes between heat and cold was demonstrated (fig. 3) and the results revealed that there are significant differences. First, the expression levels of candidate genes increased more significantly in cold treatment than in heat treatment. Second, the expression profiles on the 11 timepoints showed differences on the peak numbers and peak times. All these differences suggest the molecular pathway and mechanisms on Medfly larval responses to heat and cold may be different. However, another factor which should be considered is the treatment doses. Although in both heat and cold treatment, 75% mortality was selected as the treatment dose to determine the treatment times, they are very different. In the heat treatment, only 8 min and 30 s (510 s) were applied. However, in this cold treatment, 22 min and 24 s (1344 s) were utilized, nearly 2.6 times longer. This longer treatment time may result in the differences in the expression levels of the studied genes, leading to higher expression levels, peaks at different times and more peaks.
This study focused on the comparison of the expression levels of 31 genes of interest between heat and cold treatments, which were identified in the previous heat study. This study was not planned to identify the candidate genes that showed significant differences in the expression profiles in cold treatment itself, as what have been done in the previous heat treatment study (Anantanawat et al., Reference Anantanawat, Papanicolaou, Hill and Xu2020). Therefore, it is likely the candidate genes that show significant expression changes in cold may be very different from those in heat (Anantanawat et al., Reference Anantanawat, Papanicolaou, Hill and Xu2020) and not included here. However, several genes exhibited significant expression changes here, for example, hsp70 and hsp83-like. In D. melanogaster, the up-regulation of Hsp70 is tightly associated with cold-acclimation and cold exposure. Genetic elimination of Hsp70 up-regulation response does not affect the survival of chronic exposures to 0 °C or mild acute cold shocks. However, it does negatively affect survival after severe acute cold shocks at temperatures below −8 °C (Štětina et al., Reference Štětina, Koštál and Korbelová2015). The exact functions of these Medfly genes in the molecular responses to cold or heat stressors is unknown yet. These candidate genes can be further functionally characterized by using CRISPR (Sim et al., Reference Sim, Kauwe, Ruano, Rendon and Geib2019) or RNAi (Wang et al., Reference Wang, Lu, Smagghe, Meng and Wang2017) technologies in C. capitata. After knocking-out or knocking-down the candidate genes through CRISPR or RNAi, Medfly larvae may change their tolerance to the cold and heat stress.
In summary, this study achieved the original aims to compare candidate genes’ expression regulation in response to cold and heat in C. capitata. The results showed that Medfly genes’ expression profiles are vary between heat and cold treatments, suggesting fly molecular responses may be different between heat and cold. This information helps us better understand molecular mechanisms of Medfly larvae responses to heat and cold, which will aid in the optimization of stresses that can lead to lower application doses.
Supplementary material
The supplementary material for this article can be found at https://doi.org/10.1017/S000748532100078X.
Acknowledgements
We thank Dr Peter Crisp (South Australian Research and Development Institute) for providing quarantine facility and Mediterranean fruit flies colony. This project was funded by Plant Biosecurity Cooperative Research Centre (PBCRC) Project 3149 ‘Molecular responses to sub(lethal) stresses’. Dr Wei Xu is the recipient of an Australian Research Council Discovery Early Career Researcher Award (DECRA) (DE160100382).
Conflict of interest
The authors declare that they have no competing interests.