


Introduction
The spring emergence of insects can be controlled by many different factors, but photoperiod and temperature are generally considered the most important (Tauber & Tauber, Reference Tauber and Tauber1976; Beck, Reference Beck1983; Takeda & Skopik, Reference Takeda and Skopik1997). Studies on the spring emergence of species give indirect information regarding diapause and post-diapause development of the insect. Photoperiods are often linked with corresponding thermoperiods, and insects are very well adapted to this system (Danilevsky et al., Reference Danilevsky, Goryshin and Tyshchenko1970; Beck, Reference Beck1983; Axelsen et al., Reference Axelsen, Fink and Kjær1997). In many insect species, the critical photoperiod for insect diapause and post-diapause development is controlled by temperature. This effect is interpreted as a kind of clock function in the insect (Beck, Reference Beck1983; Leather et al., Reference Leather, Walters and Bale1993; Son et al., Reference Son, Lee and Chung2007). For many insects, however, little is known about the regulation of insect development via the interrelationship of factors like photoperiod and temperature. This hampers complete elucidation of the environmental control and, thus, prediction of the spring emergence of insects (Leather et al., Reference Leather, Walters and Bale1993; Kostal et al., Reference Kostal, Shimada and Hayakawa2000; Xue et al., Reference Xue, Zhu and Shao2001; Son et al., Reference Son, Lee and Chung2007).
An intricate relationship between spring emergence and the temperature and light regime may influence the pea moth Cydia nigricana Fabricius (Lepidoptera: Tortricidae), a key pest in pea Pisum sativum L. (Fabaceae) (Pittorf & Matthes, Reference Pittorf and Matthes2004; Jostock, Reference Jostock2006; Huusela-Veistola & Jauhiainen, Reference Huusela-Veistola and Jauhiainen2006). However, previous studies that have addressed field emergence of pea moths have focussed almost exclusively on temperature relationships (Wheatly & Dunn, Reference Wheatly and Dunn1962; Lewis & Sturgeon, Reference Lewis and Sturgeon1978; Macaulay et al., Reference Macaulay, Etheridge, Garthwaite, Greenway, Wall and Goodchild1985).
According to Nicolaisen, (Reference Nicolaisen1928), Langenbuch (Reference Langenbuch1941), Wright & Geering (Reference Wright and Geering1948) and Sarwar (Reference Sarwar1973), the final instar (L5) of the pea moth overwinters in a cocoon in the soil. In spring, the larva leaves this cocoon and pupates in a secondary cocoon in the upper soil layer. Adults eclose from mid-May onwards with a flight peak around midsummer, ceasing about the end of July. The females lay eggs five to nine days after mating on the leaves of the pea plants, often close to flowers and pods. First instars (L1) hatch after ca. seven days (at 21°C). Directly after hatching, the young larvae (L1) migrate to the emerging pea pods and penetrate them. Further larval development (L1–L5) occurs inside pea pods, where the larvae feed on the seeds. The last instars (L5) leave the pods and drop to the soil where they migrate into the soil and spin a compact waterproof cocoon coated with soil particles to overwinter. Larval development lasts approximately 21 days (at 21°C) and diapause takes four to six weeks; this is followed by post-diapause until pupation in spring.
The first studies that provided information regarding the effects of temperature on the spring emergence of the pea moth were conducted by Wheatly & Dunn (Reference Wheatly and Dunn1962) . Their calculation of cumulative day-degrees during overwintering of C. nigricana until their emergence in spring resulted in wide variation (277–660 day-degrees). Thus, additional but unknown environmental factors were postulated to be involved in the control of the emergence of the pea moth in spring (Wheatly & Dunn, Reference Wheatly and Dunn1962). In spite of highly variable spring temperatures, the annual appearance of pea moths remains relatively constant and occurs from mid-May until the end of July (Nicolaisen, Reference Nicolaisen1928; Langenbuch, Reference Langenbuch1941; Wright & Geering, Reference Wright and Geering1948; Sarwar, Reference Sarwar1973). Therefore, we suggest that photoperiod could be another fundamental factor for the development of C. nigricana. So far, data on environmental factors affecting the spring emergence or diapause and post-diapause development of the pea moth are rare. It is not known whether photoperiod and temperature act together on the pea moth life cycle.
Thus, the objective of this study was to clarify the potential interaction of different environmental factors in the spring emergence of C. nigricana, with the main focus on photoperiod and temperature effects. A field study conducted in two pea-growing regions over three years (2006–2008) produced long-term data on the effects of air and soil temperatures, photoperiod and solar radiation on pea moth emergence in spring and, thus, indirect data regarding pea moth post-diapause development. In laboratory experiments, the effects of temperature and photoperiod on the emergence of C. nigricana were studied under controlled conditions. To conclude, the relevance of the outcomes for the development of a predictive model or decision support system for pea moth control are discussed.
Materials and methods
Study areas
Data collection was carried out over three years (2006–2008) in two pea-growing areas in Hesse and Saxony, Germany. The recording of data was restricted to organically managed fields to avoid potential bias due to insecticide treatments. In the North of Hesse in Neu-Eichenberg/Hebenshausen (51°38′N, 9°91′E), a small-scale field study with four, three and three pea fields in the years 2006, 2007 and 2008, respectively, was conducted in a total study area of 150 ha. The green pea cultivars Avola, Deltafon and Ambassador as well as the grain pea cultivar Santana were grown in the small-scale study area.
In Saxony in Lommatzsch (51°19′N, 13°31′E), a large-scale study was carried out in a commercial pea-growing region where all organic pea fields within a sampling area of about 90,000 ha were monitored (2006–2008: 9, 14, 9 pea fields, respectively). The green pea cultivar Avola was used in all studied fields.
From August 2005 until July 2008, the meteorological data (air and soil temperatures, solar radiation) of the two pea-growing regions were obtained from meteorological stations within the respective study regions: (i) Agro-Climatic Data Station of the University of Kassel, Department of Grassland Science and Renewable Plant Resources, Neu-Eichenberg/Hebenshausen; and (ii) Lommatzsch Meteorological Station of the FRoSTA AG Production facility ELBTAL (Lommatzsch).
Pea moth monitoring in the field
The emergence in spring and the flight phenology of C. nigricana was assessed in each studied pea field in both pea-growing areas, using commercial pheromone monitoring traps (Trifolio-M GmbH, Lahnau, Germany). The traps were placed 3 m in from the field edge. In the small-scale field study in Hesse, four traps were used for each field, one trap at each corner of the field. In the large-scale study area in Saxony, one trap was set per field. The trap was placed in the corner of the field which was close by a pea field of the previous year, i.e. the corner with the highest infestation risk. All male moths caught in the traps were counted twice a week during the flight period of C. nigricana. In the commercial green pea-growing area in Saxony the pea moth study was terminated by the pea harvest in June and trapped moths were counted only until the pea harvest. The first pea moth emergence in spring and the peak of the pea moth flight were recorded in all studied fields in both pea-growing areas. The first pea moth in the pheromone trap and the peak in pea moth flight were chosen as representative dates for pea moth emergence and pea moth flight phenology in an agricultural environment.
Laboratory experiment
To verify the findings of the field study and to separate photoperiod effects from temperature effects on insect emergence, studies on pea moth emergence were conducted under controlled conditions in the laboratory. Pea moth cocoons used in the laboratory study were collected from infested pea pods that had been gathered in pea fields in July of the previous year. Wooden boxes (72×45×12 cm) filled with dry sand (8 cm in depth) were used to store the pods. The upper side of the boxes was covered with chicken mesh (1.2 cm mesh size), and the infested pods were placed on the top of the chicken mesh. This enabled the late instar (L5) to leave the pods, drop to the sand and spin a cocoon to overwinter. To ensure unrestricted diapause development, the boxes were stored until the end of November under outdoor conditions, but protected against rainfall in an open greenhouse. At the beginning of December, the sand was sieved to extract the cocoons. After this, the cocoons were placed in plastic boxes (15×15×5 cm, 25 cocoons per box) with a 2-cm layer of slightly moist sand above and below the cocoons. The removable lid and the lower side of the box were given ventilation openings that were covered with gauze (300 μm mesh size; Heidland, Gütersloh, Germany). The plastic boxes were stored for eight weeks in a climate chamber (2±2°C, 50–60% RH, 6:18 h L:D) until the start of the experiment, according to the studies of Sarwar (Reference Sarwar1973) .
The effects of photoperiod and temperature on the eclosion of adult pea moths was examined at temperatures of 20 and 24°C and photoperiods of 18:6, 6:18, 0:24 h L:D, respectively. During the experiments, the lids of the plastic boxes were removed. To maintain optimal moisture levels in the sand substrate and, thus, avoid the dehydration of the cocoons or growth of mould on the cocoons, the plastic boxes were placed in slightly larger plastic boxes containing a film of water. The ventilation hole in the lower side of the upper box facilitated the regulation of humidity and air in the sand substrate. These assemblies were placed in eclosion boxes (Plexiglas; 30×30×30 cm; four ventilation holes closed with 300 μm gaze; one removable lid) in climate chambers under different photoperiod-temperature regimes. The eclosion of adults was recorded daily. Six photoperiod-temperature treatments were used comprising all combinations of the two temperatures and three photoperiods described above. For each treatment, four cocoon boxes containing 25 cocoons, respectively, were used (i.e. 100 cocoons per treatment in total). The experiment was repeated twice. The light intensity measured in the eclosion boxes was 11,490 lux in the light variants (18:6, 6:18 h L:D) and 0 lux in the dark variant (0:24 h L:D). As a control, cocoons of C. nigricana were kept under semi field conditions. In the field, four plastic tubes (30 cm length, 15 cm diameter) were embedded in the ground and filled with sand. In each tube, 25 cocoons were kept covered with a sand layer of 2 cm depth (i.e. altogether 100 cocoons in control treatment). The top of the cylinders was sealed with gauze (300 μm mesh size) to prevent pea moth escape after eclosion. Adult emergence was recorded daily.
Data analysis
For the small-scale field study, the cumulative number of pea moth adults (% of pheromone trap catches) was calculated for each week during the total flight period of C. nigricana. Similarly, data on cumulated air temperatures (sum of daily mean air temperature, °C, at 2 m), cumulated soil temperatures (sum of daily mean soil temperature, °C, at 5 cm), cumulated day lengths (sum of day length, h) and cumulated solar radiation (sum of daily mean solar radiation, W m−2) were computed. During the three study years, the first pea moth emergence in the field and the peak of the pea moth flight showed the closest correlation with air temperature, soil temperature, day length and solar radiation using 14:10 h L:D as the approximate critical value. Thus, a fourteen-hour day length (14:10 h L:D, corresponding to the 1st of April in Neu-Eichenberg/Hebenshausen (51°38′N, 9°91′E)) was used as the threshold parameter to calculate the cumulated temperatures, hours and radiation.
Correlations between the observed cumulative numbers of pea moth (%) and the four environmental factors (air and soil temperatures, day length, solar radiation) were investigated by nonlinear regression using a simple sigmoid model (Draper & Smith, Reference Draper and Smith1998).
To validate the significance of the agro-climatic factors for the spring emergence of C. nigricana in the Hesse as well as the Saxony study, the values of cumulative solar radiation, day length, air and soil temperatures at the relevant date were determined for: (i) the first pea moth found in pheromone traps; and (ii) the peak of pea moth flight occurring in both pea-growing areas in 2006–2008.
For the different photoperiod-temperature regimes in laboratory experiments, the cumulative air temperatures at the date of the first pea moth eclosion were compared. The cumulative air temperatures were subjected to the Levene test to evaluate the homogeneity of variance. Differences among the photoperiod-temperature regimes were assessed by analyses of variance (ANOVA). Where significant F-values were obtained, means were discriminated using Tukey's test (Sokal & Rohlf, Reference Sokal and Rohlf1995). All statistical analyses were conducted using SAS (SAS Institute, 1999). A significance level of α=0.05 was selected in all analyses.
Results
Pea moth monitoring in the field
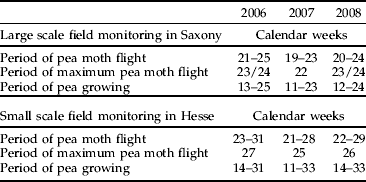
In the small-scale study in Hesse, the annual appearance of the pea moth was recorded from mid-May until the end of July (calendar weeks 21–31). The maximum pea moth flight occurred in calendar weeks 27, 25 and 26 in 2006, 2007 and 2008, respectively (table 1). Due to the cultivation of organic green and grain peas, the pea cultivation period lasted longer in Hesse, at 17, 22 and 19 weeks (2006–2008, respectively), than in the Saxonian commercial pea-growing area (table 1). As the large-scale study was restricted to green peas, the commercial campaign in Saxony lasted only 12 weeks, and the flight observations ended with the pea harvest in calendar weeks 25, 23, 24 for the years 2006–2008, respectively (table 1). In the organic green pea fields in Saxony, the annual appearance of pea moths was consistent between 2006 and 2008 and occurred from the beginning of May until mid-June (calendar weeks 19–25). Peaks in pea moth flight occurred in calendar weeks 24, 22 and 24 in 2006, 2007 and 2008, respectively (table 1).
Table 1. Comparison of the period of pea moth flight, the maximum pea moth flight and the period of pea cultivation for the investigated pea fields in the pea growing areas in Saxony and Hesse for the years 2006 to 2008.
A strong correlation between pea moth emergence and temperature was demonstrated in the small-scale area in Hesse for the years 2006–2008 (figs 1 and 2). Both air and soil temperatures were closely correlated with the emergence of C. nigricana (air temperature: R2=0.96, F=509.26; df=2, 38; P<0.0001; RMS: 63.65; soil temperature: R2=0.89, F=154.11; df=2, 38; P<0.0001; RMS: 194.23). A similar strong correlation was demonstrated for solar radiation and day length (solar radiation: R2=0.94; F=327.78; df=2, 38; P<0.0001; RMS: 96.96; day length: R2=0.89; F=160.39; df=2, 38; P<0.0001; RMS: 187.43) (figs 3 and 4).

Fig. 1. Correlation of the cumulative pea moth occurrence (%) and cumulative air temperature (sum of daily mean temperature,°C, at 2 m) in the small-scale monitoring area (Neu-Eichenberg, Hesse, Germany) for 2006–2008. L:D 14:10 h was used as the threshold parameter to calculate cumulated air temperatures (•, 2006; ▪, 2007; ▴, 2008).

Fig. 2. Correlation of the cumulative pea moth occurrence (%) and cumulative soil temperature (sum of daily mean temperature, °C, at 5 cm) in the small-scale monitoring area (Neu-Eichenberg, Hesse, Germany) for 2006–2008. L:D 14:10 h was used as the threshold parameter to calculate cumulated soil temperatures (•, 2006; ▪, 2007; ▴, 2008).

Fig. 3. Correlation of the cumulative pea moth occurrence (%) and cumulative solar radiation (sum of daily mean solar radiation, W m−2) in the small-scale monitoring area (Neu-Eichenberg, Hesse, Germany) for 2006–2008. L:D 14:10 h was used as the threshold parameter to calculate cumulated solar radiation (•, 2006; ▪, 2007; ▴, 2008).

Fig. 4. Correlation of the cumulative pea moth occurrence (%) and cumulative day length (sum of day length, h) in the small-scale monitoring area (Neu-Eichenberg, Hesse, Germany) for 2006–2008. L:D 14:10 h was used as the threshold value to calculate cumulated day length (•, 2006; ▪, 2007; ▴, 2008).
An overview of the values of cumulative solar radiation, day length, air and soil temperatures on the date on which (i) the first pea moth was trapped in pheromone traps and (ii) the peak of pea moth flight is presented for the small-scale study in Hesse (table 2) and for the large-scale study in Saxony (table 3) for 2006–2008. Based on all three years, the values for the cumulative solar radiation ranged from (i) 10,561.0–12,695.1 W m−2; (ii) 16,968.6–19,265.8 W m−2 in Hesse and from (i) 7068.9–9115.4 W m−2; (ii) 11,307.9–13,190.2 W m−2 in Saxony. The cumulative day length ranged from (i) 737.1–1028.0 h; (ii) 1209.4–1440.4 h and (i) 611.8–816.9 h; (ii) 865.2–1143.3 h in Hesse and Saxony, respectively. The cumulative air temperature ranged from (i) 602.5–724.7°C; (ii) 1070.1–1184.6°C in the small-scale study area and from (i) 515.0–728.8°C; (ii) 883.8–1040.9°C in the large-scale study area. The cumulative temperature in the soil ranged from (i) 537.4–751.6°C; (ii) 934.5–1194.8°C and (i) 489.5–644.1°C; (ii) 905.1–993.8°C in Hesse and Saxony, respectively (tables 2 and 3).
Table 2. Occurrence of the pea moth in the experimental pea growing area in Neu-Eichenberg (Hesse, Germany) in 2006–2008 characterised on the basis of cumulative solar radiation (sum of daily mean solar radiation, W m−2), cumulative day length (sum of day length, h), cumulative air temperature (sum of daily mean air temperature, °C, at 2 m), cumulative soil temperature (sum of daily mean soil temperature, °C, at 5 cm) at the date of the first pea moth caught in pheromone traps and the peak of the pea moths flight curve. L:D of 14:10 h was used as the threshold parameter to calculate the cumulated values.

Table 3. Occurrence of the pea moth in commercial green pea growing area in Lommatzsch (Saxony, Germany) in 2006–2008 characterised on the basis of cumulative solar radiation (sum of daily mean solar radiation, W m−2), cumulative day length (sum of day length, h), cumulative air temperature (sum of daily mean air temperature, °C, at 2 m), cumulative soil temperature (sum of daily mean soil temperature, °C, at 5 cm) at the date of the first pea moth caught in pheromone traps and the peak of the pea moths flight curve. L:D of 14:10 h was used as the threshold parameter to calculate the cumulated values.

Laboratory experiment
A trend for pea moth eclosion under the different photoperiod-temperature regimes is shown in fig. 5. At a temperature of 24°C, the first pea moth emerged 24 (18:6 h L:D) and 27 (6:18 h L:D) days after the start of the experiment. This represents cumulative air temperatures of 576°C (18:6 h L:D) and 648°C (6:18 h L:D) under the two respective day-length regimes (fig. 5a). The first eclosion of C. nigricana at 20°C was recorded after 27 (18:6 h L:D) and 34 (6:18 h L:D) days, corresponding with cumulative air temperatures of 540°C and 680°C for light regimes of 18:6 h L:D and 6:18 h L:D, respectively (fig. 5b).

Fig. 5. Mean cumulative pea moth eclosion (%) over time (days after experimental start, d) under controlled conditions in laboratory, using different photoperiod-temperature regimes: (a) photoperiod of 18:6 h L:D, 6:18 h L:D at air temperature of 24°C (•, 18:6 L:D, 24°C; O, 6:18 L:D, 24°C) and (b) photoperiod of 18:6 h L:D, 6:18 h L:D at air temperature of 20°C (▪, 18:6 L:D, 20°C; □, 6:18 L:D, 20°C).
Significant differences were recorded between the long day and short day treatments in both temperature regimes (F=31.95; df=3, 12; 24°C: P<0.0036; 20°C: P<0.0001). In contrast, the temperature treatments did not differ significantly in either photoperiod regime (F=31.95; df=3, 12; 18:6 h L:D: P<0.1681; 6:18 h L:D: P<0.2448).
In the absence of light (0:24 h L:D), only two pea moths (0.6%) eclosed during the entire experiment, one at 24°C, which eclosed 52 days after the start of the experiment and one at 20°C, which eclosed after 44 days. In the control treatment under semi field conditions, the first pea moth emerged on the 21st of May following a cumulative air temperature of 512.0°C.
Discussion
The pea moth has to endure large variation in environmental conditions from year to year. This includes extreme variability in weather conditions. However, in spite of such variation, the timing of appearance of the pea moth remained relatively constant, occurring from the beginning of May until the end of July (table 1), which is consistent with the literature (Nicolaisen, Reference Nicolaisen1928; Langenbuch, Reference Langenbuch1941; Wright & Geering, Reference Wright and Geering1948; Sarwar, Reference Sarwar1973). Thus, pea moth emergence is evidently determined by more constant environmental cues than fluctuating temperatures only. The photoperiod is a cue for insects to determine upcoming changes in season. The change in day length during the year maintains a regular seasonal pattern, which is more reliable than the patterns of other environmental stimuli such as temperature. Solar radiation is closely linked to changes in day length, but is still a variable ecological factor. Thus, the photoperiod and solar radiation are factors that may control pea moth emergence in spring in addition to temperature. In our long-term pea moth study in the field, air and soil temperature as well as solar radiation and day length were strongly correlated with pea moth emergence in spring. Thus, we hypothesise that these four factors affect post-diapause development of C. nigricana. Due to the cryptic diapause and post-diapause development of C. nigricana, spring emergence in the field and eclosion of the adult moth in the laboratory was investigated in our studies as an indirect indication of pea moth diapause and post-diapause development. Several studies concerning the spring emergence of species have used such indirect information on diapause and post-diapause in insects (e.g. Cross & Crook, Reference Cross and Crook1999; Son et al., Reference Son, Lee and Chung2007).
Temperature is one of the most significant stimuli in controlling the maintenance and termination of diapause and post-diapause development in insects. It has been demonstrated that temperature acts as a control cue for diapause and post-diapause, both in isolation and in conjunction with other stimuli (Tauber & Tauber, Reference Tauber and Tauber1976; Beck, Reference Beck1983; Leather et al., Reference Leather, Walters and Bale1993; Son et al., Reference Son, Lee and Chung2007). Several studies have demonstrated that temperature influences pea moth emergence by cumulating day-degrees (Wheatly & Dunn, Reference Wheatly and Dunn1962; Lewis & Sturgeon, Reference Lewis and Sturgeon1978; Macaulay et al., Reference Macaulay, Etheridge, Garthwaite, Greenway, Wall and Goodchild1985). Similar temperature effects on pea moth emergence were shown in our field studies. In the field studies in both pea-growing areas, the first pea moth emergence in spring was recorded at cumulative air temperature ranging from 515.0–728.8°C (tables 2 and 3). However, our field studies demonstrated additional effects of soil temperature, solar radiation and day length on the flight phenology of the pea moth in spring. Difficulties in separating photoperiod effects from temperature effects on insect development, especially during diapause and post-diapause, have been discussed by several authors (e.g. Chippendale et al., Reference Chippendale, Reddy and Catt1976; Xue et al., Reference Xue, Spieth, Aiqing and Ai2002; Watari, Reference Watari2005). An attempt to separate photoperiod from temperature effects on pea moth emergence was made in our laboratory studies by testing different photoperiod-temperature regimes. The first C. nigricana emergence was recorded at similar cumulative air temperatures irrespective of the temperature treatment using long day conditions (540 and 576°C in 24 and 20°C treatment, respectively) and short day conditions (648 and 680°C at 24 and 20°C, respectively). Thus, the findings under controlled laboratory conditions confirmed that temperature influenced pea moth emergence by cumulating day-degrees. In addition to temperature effects, an overriding effect of photoperiod on pea moth emergence and, thus, on post-diapause development of C. nigricana was indicated in our laboratory study. No pea moth eclosed under dark conditions in the laboratory with the exception of two individuals (0.6%). Thus, the influence of light seems to be a fundamental factor for pea moth emergence. These results showed that temperature alone cannot terminate the post-diapause development of C. nigricana. Moreover, in both temperature variants (24°C and 20°C), the pea moth emerged earlier under long day conditions than under short day conditions, which highlighted the influence of photoperiod on spring emergence. Thus, the interplay between photoperiod and temperature factors on the emergence of C. nigricana and, accordingly, on the diapause and post-diapause development of the moth was demonstrated.
Similar interactions between photoperiod and temperature cues in diapause development have also been found in other Tortricidae. Studies on the termination of diapause in the Codling moth Cydia pomonella (Lepidoptera: Tortricidae) showed that temperatures acted via the cumulation of day-degrees, but their effect was only apparent under long day conditions. In addition, the length of diapause was affected by the photoperiod at the time of diapause induction, with a shorter day length resulting in a longer diapause. Thus, the sum of day-degrees that is required for successful Codling moth emergence is dependent on the photoperiod experienced before and during diapause (Deseö & Briolini, Reference Deseö and Briolini1986).
Based on our findings from laboratory experiments and field studies, we hypothesise that a critical day length of around 14 h L:D is required to initiate temperature sensitivity in the pea moth, these being the two key factors for spring emergence. This empirical finding will need to be confirmed in ongoing experiments. However, the estimated critical day length, which correlates with the 1st of April in our study area, as the threshold parameter for calculating the cumulated temperatures, resulted in relatively consistent cumulative air temperatures for pea moth occurrence in spring of between 515.0 and 728.8°C in our pea-growing areas in Hesse and Saxony in the three experimental years (tables 2 and 3).
Thus, the link between our proposed photoperiodic cues and cumulative temperatures demonstrates a much closer correlation with pea moth occurrence in spring than the solely temperature-based calculations presented by Wheatly & Dunn (Reference Wheatly and Dunn1962), which revealed a less satisfactory variation in cumulative air temperatures of 277.0–660.0°C. Thus, our findings offer a more consistent explanation than the formerly postulated “non-distinguished and gradual transition” for spring emergence in pea moth (Wheatly & Dunn, Reference Wheatly and Dunn1962). An even more explicit correlation between spring emergence of pea moth and photoperiod and temperature cues may be possible if further environmental factors would be included, e.g. the moisture of the soil surface.
Former studies on C. nigricana demonstrated that pea moth monitoring by pheromone traps combined with temperature-based calculations and egg development could be used to forecast optimum spraying dates (Lewis & Sturgeon, Reference Lewis and Sturgeon1978; Macaulay et al., Reference Macaulay, Etheridge, Garthwaite, Greenway, Wall and Goodchild1985). This is analogous to advanced decision support systems for the closely related Codling moth (e.g. Gottwald, Reference Gottwald1996; Samietz et al., Reference Samietz, Graf, Höhn, Schaub and Höpli2007; Trapman et al., Reference Trapman, Helsen and Polfliet2008). Our findings on the control of spring emergence of C. nigricana by photoperiod and temperature cues may contribute to the development of a more refined prediction system for pea moth control in commercial pea-growing areas in the future.
Acknowledgements
We thank the research team of the Saxon State Ministry of the Environment and Agriculture (Dresden), the FRoSTA AG Production facility ELBTAL (Lommatzsch) and the technical staff of the Department of Ecological Plant Protection, University of Kassel (Witzenhausen) for their technical assistance. We are very grateful to Mr Uwe Manzke and Mr Michael Garrett for valuable comments on improving the study and editing the manuscript. The study was funded by the Federal Ministry of Food, Agriculture and Consumer Protection, Germany (Bundesministerium für Verbraucherschutz, Ernährung und Landwirtschaft, BLE/BÖL, 05OE025).


