


Introduction
The optimality models predict that mortality is one of the most crucial factors affecting the developmental time of organisms. Generally, one can expect short life-cycle duration in organisms faced with high mortality pressure and long life-cycle duration when mortality pressure is low (Kozłowski, Reference Kozłowski1992; Stearns, Reference Stearns1992). Insects experiencing low mortality rates could delay their maturity, in some cases for years. An extremely long development time is the norm for wood-feeding insects and can last from a few years (Buprestidae, Cerambycidae; Haack & Slansky, Reference Haack, Slansky, Slansky and Rodriguez1987) to a dozen or so years in the case of cicadas (Karban, Reference Karban1997).
The larvae of wood feeders are distinguished from insects representing other feeding guilds by their life history traits. Apart from a long development time, they have very slow growth and a large body size. Moreover, these traits tend to be more extreme with the decreasing nutritional value of the woody tissue fed by the insects (Haack & Slansky, Reference Haack, Slansky, Slansky and Rodriguez1987). Therefore, the xylem-feeders exemplify the biggest, slowest growing and longest living insects among the wood-borers. It is generally thought that the protracted development of xylem-feeders may be possible due to low parasite and predatory pressure deep in the wood. Yet, it seems that this belief is based on the rough data originating from the very beginning of the 20th century (Haack & Slansky, Reference Haack, Slansky, Slansky and Rodriguez1987). Several attempts at estimating mortality rates for some wood-feeding insects (mostly those of the economic importance) were made, but there is still lack of a general consensus on the mortality rates within this feeding guild as compared to others. Although Cornell & Hawkins (Reference Cornell and Hawkins1995) and Cornell et al. (Reference Cornell, Hawkins and Hochberg1998) made a meta-analysis of the survival curves of insects representing different lifestyles and showed that indeed wood-feeders experience lower mortality than other feeding guilds, these analyses should be treated with caution because they were not based on the age-specific mortality parameter, but on the survival parameter, which is not an independent value (Carey, Reference Carey2001).
The aim of the current study was to estimate the mortality rate in natural conditions for each larval instar of the xylem-feeding Aredolpona (Stictoleptura) rubra (L.) (former name Corymbia rubra; Coleoptera: Cerambycidae). This species bores into coniferous trees, mostly pines. Larvae develop over 1–3 years and moult several times (Dominik & Starzyk, Reference Dominik and Starzyk2004). The exact number of instars is unknown. Therefore, the first step in the analysis was to estimate the number of larval instars, based on the head width distribution for larvae taken directly from the field, in order to ascribe the larval stage to each individual. Then, the age-grouping time-specific life table was constructed (Southwood & Henderson, Reference Southwood and Henderson2000), assuming that the decreasing number of larvae found within the instars reflects the natural mortality. Finally, the achieved mortality values were compared with data available for other wood-feeders, as well as for insects from other feeding guilds, and general conclusions were drawn concerning the mortality pressure in wood.
Materials and methods
Material
The research was carried out in the Niepołomice Forest near Kraków, southern Poland, in 2004–2006. The forest sites most abundant in A. rubra larvae (forestries Dziewin and Hysne) were chosen from published data (Starzyk & Starzyk, Reference Starzyk, Starzyk and Kleczkowski1981). Pine stumps in different stages of decay (3–6 years after tree cuts) were taken to the laboratory. This range of decay stage should cover the habitat demands of all the A. rubra larval instars (J. Starzyk, personal communication). For each stump batch, an even number of stumps (2–6) per tree-cut year were taken. The stumps were carefully split into small pieces in the laboratory. The larvae were removed and their head capsule width was measured using an 8× magnifying glass with a scale of accuracy of 0.1 mm. They were identified according to the characteristics given by Dominik & Starzyk (Reference Dominik and Starzyk2004). The potentially coexisting species, e.g. Criocephalus rusticus L. and Rhagium inquisitor L., are separated from A. rubra by their niche demands in space (e.g. R. inquisitor prefers the subcortical parts of the stem) or time (e.g. C. rusticus prefers the less decayed wood (e.g. Dominik & Starzyk, Reference Dominik and Starzyk2004)). The number of larval instars was estimated from the multimodal distribution of the head capsule width, and the life table was constructed in order to calculate the instar-specific mortality coefficients.
Number of instars
The number of larval instars was determined using cluster analysis based on the head capsule width values. The FASTCLUS procedure in SAS, a non-hierarchical approach, was chosen for this purpose (SAS, 2002–2004). This procedure uses a k-means method and the cluster centres estimation is based on a least-square method. The method of finding the initial cluster seeds is combined here with an iterative algorithm for minimising the sum of squared distances from the cluster mean. Two rules were compared for 4–10 clusters in order to choose the optimal number of clusters: the pseudo-F and cubic clustering criterion (CCC) statistics, both recommended as very efficient criteria for this purpose (Legendre & Legendre, Reference Legendre and Legendre1998). The pseudo-F measures the separation among all the clusters. CCC is based on the assumption that a uniform distribution on a hyperrectangle will be divided into rough hypercube clusters. Ten datasets of random ordering were created to eliminate the effect of data order. One exceptionally big head width value was excluded from this analysis. The final pseudo-F and CCC statistics were averaged over ten datasets, and the number of clusters with their local peaks was chosen as the optimal.
Interspecies comparisons
In comparison analysis, the mortality rate of larvae was the mean q x of a particular species (calculated in the same way as in the case of A. rubra) for all larval stages indicated in the original papers. The names of species included in the analysis are given in table 1. Where possible, the data were averaged over all the life tables given for one species (the data for P. olivacea was based only on the life table from 1957 and those for S. regensteinensis on the one from 1964). The one-way ANOVA for the mean mortality of larvae representing the wood-feeders and other feeding guilds was made in Statistica 7. Finally, the mortality and maximum development time were compared within the wood-feeders (species as in table 1). The nutritional value of the woody tissue was presented as the average nitrogen content per gram of dry mass, for the ranges of data taken from table 15.2 in Haack & Slansky (Reference Haack, Slansky, Slansky and Rodriguez1987). The specific values of %N were then assigned to each species according to its niche inside a tree. The value was averaged over woody tissues if the species inhabits more than one during its development.
Table 1. A list of species used in comparative analyses. The q x value represents the mean mortality calculated for all larval stages indicated in the original papers.

Results
A total of 556 A. rubra larvae were removed from 81 pine stumps brought from the forest. Besides A. rubra, other beetle larvae, C. rusticus and Chalcophora mariana L. (Coleoptera: Buprestidae), were identified. However, the existence of one of these species principally eliminated the others; and, when they coexisted, each of the species was poorly represented. The optimal cluster number was estimated to be six, which was adopted as the modal number of larval instars in the studied species. Figure 1 shows the division into six instars assigned in the statistical analysis, based on the head width distribution (in the figure arbitrarily divided into 20 categories). The final assignment of instar number to individuals was averaged over ten datasets of random ordering.

Fig. 1. The bounds delimiting the instars of A. rubra larvae according to statistical analysis (see text for details), based on the head capsule width distribution (here, arbitrarily divided into 20 categories).
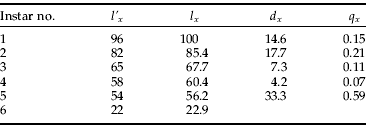
The instar distribution was divided between stumps collected in autumn and spring because different patterns were expected for these two seasons. More newly hatched larvae was predicted in autumn than in spring because of the winter mortality of larvae, while the opposite was anticipated for the oldest instar because of the pupation and eclosion period in summer. The comparison of these two distributions, calculated as the percentage of occurrence of a particular instar within a season (fig. 2), shows that the predictions were correct for the youngest instar but not for the oldest. The percentages of second, fifth and sixth instar larvae were similar for both distributions, while the numbers of third and fourth instars were much lower in autumn. Because the latter seems to be underestimated for some unknown reasons, the life table was constructed using the spring data only, except for the first larval instar. The number of larvae at the first instar was calculated as being proportional to the number of larvae at the second instar in spring, where the proportionality coefficient=1.17 was the ratio of the first instar/second instar for the autumn. The numbers per instar were treated as the l'x value in the life table, and they were recalculated to the percentages of organisms surviving to the beginning of the stadium (l x) by bringing the number of first instar larvae to 100%. Finally, the age-specific mortality q x was calculated as the ratio of the number of larvae dying within an instar (d x) to the number of larvae surviving to the beginning of a stage (l x). Table 2 shows the life table estimation for all instars. The initially low and even value of age-specific mortality rates (column q x) increases rapidly in instar 5.

Fig. 2. The frequency distribution of larvae within A. rubra instars in autumn and spring stumps (percent per season) (▪, autumn; ![]() , spring).
, spring).
Table 2. The life table for A. rubra larvae in pine stumps in the Niepołomice Forest, Poland. The numbers for l' x were derived from vernal stumps except for the number for instar 1, which was calculated from the value for autumnal stumps as described in the text (l' x, number of larvae per instar; l x, proportion surviving at start of the instar (%); d x, number of dying within the instar; q x, mortality per instar).
The results of a one-way ANOVA for the mortality of insect larvae living in wood and those from other feeding guilds show that the mortality of wood-feeders is significantly lower than that of other insects (F=10.364; df=1, 16; P=0.005). Moreover, within the wood-feeders' guild, the mortality of larvae tends to increase with the increasing nutritional value of the woody tissue fed, while the maximal development time of wood-feeders' larvae shows the opposite direction (fig. 3a, b).

Fig. 3. (a) Mortality and (b) maximal development time of wood-feeders' larvae in relation to the nitrogen content in woody tissue fed (%N values after Haack & Slansky, Reference Haack, Slansky, Slansky and Rodriguez1987). Each point represents one species. The arrow indicates direction toward the centre of a tree.
Discussion
The results of the present study show two important points: (i) the inside-wood environment is safer for its inhabitants than other habitats and (ii) this type of environment is not homogenous, i.e. the mortality pressure inside decreases toward the tree centre. The mortality rate values of xylem-feeding A. rubra larval stages (table 2) indicate that the mortality in the early and mid-stages is more or less similar and instar-independent. It increases at a later instar and could be caused by the intensified pressure of parasites specific for big-sized larvae. Generally, the most frequent parasitoid of early A. rubra stages in Poland is Coleocentrus excitator Poda (Hymenoptera: Ichneumonidae), while one of the more common late-larval parasitoids is Ontsira imperator Haliday (Hymenoptera: Braconidae) (J. Hilszczański, personal communication). Both species affect mortality of late instar larvae. In the laboratory culture, some parasitoic Diptera species were observed in large larvae (personal observations).
The value for the first instar in table 2 applies actually to winter mortality only and does not include the mortality of the ‘recruits’, the newly-hatched larvae starting to bore into the wood. According to my observations (unpublished data) and some accessible data for other cerambycids (e.g. Banno & Yamagami, Reference Banno and Yamagami1991, and citations therein), this moment is the most vulnerable in the wood-feeder's life cycle. In my opinion, it could be associated with the difficulty the larva has in achieving a satisfactory cooperation with its endosymbionts facilitating the digestion of barely digestible wood. However, there is a complete lack of data on this subject.
Because the nutritional value of the woody tissue decreases toward the tree centre (Haack & Slansky, Reference Haack, Slansky, Slansky and Rodriguez1987), the results shown in fig. 3 mean that xylem-feeders develop longer than subcortical species due to lower mortality in the former group, which is in accordance with the optimal allocation theory (Kozłowski, Reference Kozłowski1992; Stearns, Reference Stearns1992).
To sum up, therefore, this study is the first attempt at an empirical confirmation of the generally accepted opinion concerning the low mortality pressure inside wood. The comparison of the age-specific mortality parameter made for data available for wood-feeders, supplemented by this author study of a xylem-feeder and contrasted with the values for species from other feeding guilds, shows that wood is indeed safer than other habitats. Moreover, comparing the mortality values and maximal development times of wood-feeders demonstrates that the mortality of larvae decreases while development time increases with horizontal depth of the stem (equals decreasing nutritional value of woody tissue fed). Finally, this could indicate that (i) the limiting factor in the wood-feeders' development is the quality of food and (ii) their prolonged development time is possible given the low mortality pressure.
Acknowledgements
I wish to thank J. Weiner for comments and advice throughout the preparation of this manuscript, J. Starzyk and J. Hilszczański for consultations and two anonymous referees for helpful comments and suggestions on a previous version of this manuscript. The work was supported by the Polish Ministry of Science and Higher Education, grant 2 P04C 083 28.


