


Introduction
Canola, Brassica napus L. (family Brassicaceae), is one of the most important oilseed crops, constituting approximately 41% of the edible oil production in Iran (Fathi et al., Reference Fathi, Bozorg-Amirkalaee and Sarfraz2011). This crop attracts a wide range of pests from seedling establishment to seed development. The cabbage aphid, Brevicoryne brassicae (L) (Hemiptera: Aphididae), is one of the most serious pests of brassicaceous crops worldwide (Bhatia and Verma, Reference Bhatia and Verma1994; Blackman and Eastop, Reference Blackman and Eastop2000; Elhamahmy et al., Reference Elhamahmy, Mahmoud and Bayoumi2016) It causes direct damage while probing plant tissues for nutrition, and increases its population quickly on infested plants because of its high reproductive capacity (McKinley, Reference Mckinley1992), which may result in stunted growth and deformation of the plant (Bonnemaison, Reference Bonnemaison1965; Oatman and Platner, Reference Oatman and Platner1969). In addition, it can also lead to indirect damage by transmitting plant pathogenic viruses such as cauliflower mosaic, cabbage ring spot virus, and B. brassicae virus (BrBV) (Broadbent, Reference Broadbent1954; Blackman and Eastop, Reference Blackman and Eastop2000; Ryabov, Reference Ryabov2007). Growers rely on insecticide applications to control B. brassica infestations (David and Gardiner, Reference David and Gardiner1959). However, chemical control has negative effects on agroecosystems and can result in insect resistance to pesticides (Furk and Hines, Reference Furk and Hines1993). These factors have led to increased interest in finding eco-friendly and inexpensive alternative approaches such as plant resistance for managing pests (Smith, Reference Smith1989).
Plant resistance mechanisms against insects can be classified into antixenosis, antibiosis, and tolerance (Kogan and Ortman, Reference Kogan and Ortman1978). Plant antixenosis negatively influences the processes of an insect's colonization, causing a reduced initial infestation level (Stowe et al., Reference Stowe, Marquis, Hochwender and Simms2000). Antixenosis, also referred to as non-preference, is based on morphological and/or chemical traits that make a plant unattractive to insects for feeding or oviposition (Painter, Reference Painter1941; Kogan and Ortman, Reference Kogan and Ortman1978). In fact, antixenosis causes unfavorable effects on insect behavior (Painter, Reference Painter1951). Antibiosis manifests after a host plant has been attacked. This mechanism is defined as the negative efficacy of a plant on the biological parameters of an insect pest as a result of feeding activity on the resistant host plant. This type of resistance is mainly attributed to plant allelochemicals and results in smaller body size, lower survival, longer development time, and poor fecundity in insects (Smith, Reference Smith2005). High levels of resistance in Brassica fruticulosa Cirillo to the cabbage aphid have been ascribed to a combination of antixenosis and antibiosis (Ellis and Farrell, Reference Ellis and Farrell1995). The tolerance mechanisms include resource allocation patterns, plant architecture, and other traits that lessen the loss of biomass or yield under herbivore injury (Stowe et al., Reference Stowe, Marquis, Hochwender and Simms2000). Therefore, the tolerance mechanism differs from antixenosis and antibiosis mechanisms in how it influences the insect–plant relationship (Teetes, Reference Teetes2007). Antibiosis and antixenosis resistance cause an insect response when the insect attempts to utilize the resistant plant for food, oviposition, or shelter (Teetes, Reference Teetes2007), while plant tolerance involves plant compensatory characteristics, and consequently, the plant can harbor large numbers of herbivores without interfering with the insect pest's physiology or behavior (Koch et al., Reference Koch, Chapman, Louis, Heng-Moss and Sarath2016).
One defense system that plants use to protect themselves against insects is induced resistance. The two most clearly defined forms of induced resistance are systemic acquired resistance (SAR) and induced systemic resistance (ISR), which can be distinguished on the basis of the nature of the elicitor and the regulatory pathways involved, as demonstrated in model plant systems (Pieterse et al., 1996, Reference Pieterse, van Wees, Hoffland, van Pelt and van Loon1998; Knoester et al., Reference Knoester, Pieterse, Bol and van Loon1999). SAR can be activated by exposing the plant to virulent and non-pathogenic microbes, or artificially with chemicals such as salicylic acid (SA) (Sticher et al., Reference Sticher, Mauch-Mani and Métraux1997). SAR is characterized by the accumulation of SA and pathogenesis-related proteins (Pieterse et al., Reference Pieterse, van Wees, Hoffland, van Pelt and van Loon1996). ISR is described as systemic protection of a plant by an inducing factor when used to a single part of the plant (Kloepper et al., Reference Kloepper, Tuzun and Kuć1992). ISR is potentiated by plant growth-promoting rhizobacteria (PGPR), of which the best examples are strains within several species of Pseudomonas that cause no evident damage to the root system of a plant (van Loon et al., Reference van Loon, Bakker and Pieterse1998). ISR relies on pathways regulated by jasmonate and ethylene (ET) (Pieterse et al., Reference Pieterse, van Wees, van Pelt, Knoester, Laan, Gerrits, Weisbeek and van Loon1998; Knoester et al., Reference Knoester, Pieterse, Bol and van Loon1999), but several examples of ISR are related to the production of siderophores or SA by PGPR strains (Maurhofer et al., Reference Maurhofer, Hase, Meuwly, Métraux and Defago1994; Leeman et al., Reference Leeman, van Pelt, Hendrickx, Scheffer and Bakker1995; De Meyer and Höfte, Reference De Meyer and Höfte1997).
The application of PGPR (Zehnder et al., Reference Zehnder, Kloepper, Yao and Wei1997; Stout et al., Reference Stout, Thaler and Thomma2006; Zebelo et al., Reference Zebelo, Song, Kloepper and Fadamiro2016; Rashid and Chung, Reference Rashid and Chung2017) and plant growth regulators including SA (Peng et al., Reference Peng, Deng, Huang, Jia, Miao and Huang2004; Kawazu et al., Reference Kawazu, Mochizuki, Sato, Sugeno, Murata, Seo and Mitsuhara2012) has been shown to induce resistance in plants to some pests. For example, PGPR has induced resistance in corn against corn earworm, Helicoverpa zea Hübner (Bong and Sikorowski, Reference Bong and Sikorowski1991), in cucumber to cucumber beetles, Diabrotica undecimpunctata Barber (Zehnder et al., Reference Zehnder, Kloepper, Yao and Wei1997), and in cotton against cotton bollworm, Helicoverpa armigera Hübner (Qingwen et al., Reference Qingwen, Ping, Gang and Qingnian1998). Moreover, resistance induced by SA has been found in tomato against H. armigera and Macrosiphum euphorbiae (Thomas) (Cooper et al., Reference Cooper, Jia and Goggin2004), and in chili pepper against Frankliniella occidentalis Pergande (Zheng et al., Reference Zheng, Chen, Zhao, Chen, Zheng, Zheng, Mu, Zhao, Gao and Zhang2019).
SA is one of the most important phytohormones that generates a wide range of metabolic and physiological responses in plants and regulates many aspects of plant growth and resistance against various stresses, including phloem-feeding herbivores (Raskin, Reference Raskin1992; Zhao et al., Reference Zhao, Chen, Cheng, Sun, Liu and Tian2009; Kawazu et al., Reference Kawazu, Mochizuki, Sato, Sugeno, Murata, Seo and Mitsuhara2012). In addition, SA induces plant tolerance to various abiotic and biotic stresses (Horváth et al., Reference Horváth, Szalai and Janda2007; Kamel et al., Reference Kamel, Mahfouz, Blal, Said and Mahmoud2016). Elhamahmy et al. (Reference Elhamahmy, Mahmoud and Bayoumi2016) reported that the foliar application of SA (50 mg l−1) was an effective elicitor to reduce the B. brassicae population on canola inflorescence and improve its yield.
PGPR can improve plant growth through the induction of phytohormones such as jasmonic acid (JA), SA, and ET in plants; increased nitrogen and phosphorus uptake; and the enhancement of iron nutrition through iron-chelating siderophores (Bowen and Rovira, Reference Bowen and Rovira1999; Naeem et al., Reference Naeem, Aslam, Khaliq, Ahmed, Nawaz and Hussain2018). Many PGPR are able to induce the defense mechanism in host plants through alterations in the secondary plant compounds, thereby enhancing the resistance in plants against challenging pathogens and insect pests (Vidyasekaran et al., Reference Vidyasekaran, Rabindran, Muthamilan, Nayar, Rajappan, Subramanian and Vasumathi1997; Zehnder et al., Reference Zehnder, Kloepper, Yao and Wei1997; Murphy et al., Reference Murphy, Zehnder, Schuster, Sikora, Polston and Kloepper2000; Ramamoorthy et al., Reference Ramamoorthy, Viswanathan, Raguchander, Prakasam and Samiyappan2001; Mohana Sundaram et al., Reference Mohana Sundaram, Dhandapani, Shiv Sankar and Muthukumar2006; Chung et al., Reference Chung, Hossain, Khan, Kim, Jeon and Chung2015). Several rhizobacteria prompt the SA-dependent SAR pathway by SA production at the root surface (Maurhofer et al., Reference Maurhofer, Hase, Meuwly, Métraux and Defago1994; De Meyer and Höfte, Reference De Meyer and Höfte1997), while other rhizobacteria trigger a distinct signaling pathway independent of SA (van Wees et al., Reference van Wees, Pieterse, Trijssenaar, Van 't Westende, Hartog and Van Loon1997; Pieterse and van Loon, Reference Pieterse and van Loon1999). PGPR was also reported to be involved in the ISR of many plants against aphids (Kempster et al., Reference Kempster, Scott and Davies2002; Boughton et al., Reference Boughton, Hoover and Felton2006; Morkunas and Gabryś, Reference Morkunas and Gabryś2011). The main mechanisms of these bacteria in the process of ISR upon insect infestation include elevated cell wall or apoplastic peroxidase activity, callose deposition, and H2O2 accumulation (Valenzuela-Soto et al., Reference Valenzuela-Soto, Estrada-Hernández, Ibarra-Laclette and Délano-Frier2010; Niu et al., Reference Niu, Liu, Jiang, Wang, Wang, Jin and Guo2011; de Oliveira Araujo, Reference de Oliveira Araujo2015; Rahman et al., Reference Rahman, Uddin and Wenner2015). Pseudomonas putida ATCC12633 (one of the most commonly used PGPR) colonizes the rhizosphere of plants in a mutualistic relationship, resulting in increased plant growth (Kloepper et al., Reference Kloepper, Scher, Laliberte and Zaleska1985; Cray et al., Reference Cray, Bell, Bhaganna, Mswaka, Timson and Hallsworth2013). Furthermore, P. putida can produce allelopathic compounds such as plant growth hormone indole-3-acetic acid (Barazani and Friedman, Reference Barazani and Friedman2001) that can help or hinder plant growth depending on the compound, plant species, and concentration (Cray et al., Reference Cray, Bell, Bhaganna, Mswaka, Timson and Hallsworth2013).
The PGPR-mediated induced resistance in canola against B. brassicae resulted in the increased production of secondary metabolites including glucosinolates, total phenol, and flavonoids (Sattari Nasab et al., Reference Sattari Nasab, Pahlavan Yali and Bozorg-Amirkalaee2018). Furthermore, War et al. (Reference War, Paulraj, Ignacimuthu and Sharma2014) reported induced resistance through the exogenous application of SA and JA in groundnut against H. armigera (Hübner) led to the higher levels of secondary metabolites (total phenol, condensed tannins, and total flavonoids). There are no reports regarding the efficiency of SA integrated with PGPR (P. putida) on secondary metabolites of canola, nor on the behavior/performance of the cabbage aphid. Therefore, the objective of the current study was to investigate the impact of applying integrated SA and P. putida in comparison with the application of each individually on the contents of glucosinolates, total phenol, and flavonoids in canola plants and the resultant effects on antixenosis, antibiosis, and plant growth parameters for managing B. brassicae on this crop.
Materials and methods
Plant sources
The seeds of tested canola plants (cv. Hayola 420) were acquired from Research, Education, Agriculture and Natural Resources of Kerman (Iran). They were surface-sterilized with sodium hypochlorite (0.02%) for 2 min, and afterward were rinsed completely in sterile distilled water. The plants were grown individually in 20 cm-diameter pots filled with a mixture of soil, sand, and manure (2:1:1), and were used for rearing the aphid when they reached the four-leaf stage. They were kept in a greenhouse (20–30°C, 60 ± 5% RH, and natural photoperiod).
Induction treatments
Treatments involved in this study were as follows: (1) the use of an aqueous solution of distilled water for control; (2) application of bacterial suspension containing P. putida ATCC12633 on canola seeds; (3) the spraying of solutions of SA on entire leaves of canola plants at 1 mM concentration; (4) integrated application of both treatments (P. putida + SA).
Insect rearing
The used aphids in the experiments were obtained from the aphid colony reared in the laboratory of the plant protection department of Shahid Bahonar University, Kerman, Iran, in September 2019 and transferred to the potted plants under the above-defined conditions. Aphids were reared on canola plants (cv. Hyola) for four generations before starting the experiments. To maintain a suitable aphid colony, some aphids were transferred from infested plants to new young plants every week. Generally, in this research, 1300 and 200 wingless aphids were considered to determine the behavior and performance of B. brassicae, respectively. To measure secondary metabolites, ten third-instar nymphs, and to determine plant growth parameters, 20 fourth-instar nymphs were taken from the stock culture and transferred to each canola plant potted (N = 10; at the four-leaf stage) inside cylindrical plastic cages (15 cm in diameter, 30 cm in height) to prevent escape or parasitism. These nymphs were allowed to feed on the canola leaves under corresponding treatments for 3 days (to measure secondary metabolites) and 10 days (to determine plant growth parameters) in rearing cages. Then the cages and the aphids in them were removed before experiments.
Preparation of P. putida and seed inoculation procedure
Pseudomonas putida (strain ATCC12633) applied for the experiment was acquired from IROST, Iran (Iranian Research Organization for Science and Technology) and then were stored until use in a glycerol/Luria–Bertani (LB) broth mixture at −80°C. To prepare bacterial inoculums, cells from the glycerol mix were transferred to LB medium (solid) and permitted to grow for 2 days. Bacteria were directly taken from these plates and incubated in a rotary shaker at 110 rpm for 48 h at room temperature (28 ± 2°C). Then, it was suspended in water, and bacterial concentration was estimated by measuring absorbance at 600 nm. For inoculation, canola seeds sterilized were dipped in bacterial suspensions (OD600~1) and incubated for 20 min at 28°C, with shaking (50 rpm). Gum arabic was used as an adhesive in the inoculation of seeds. The reliability of inoculation was confirmed by plate counting (CFU ml−1) in P. putida treatment compared to control (without bacteria). Then seeds were air-dried at room temperature for 30 min, before planting in sterile soil. Autoclaving was used for soil sterilization.
Application of SA
SA was applied based on the method described by HeithIt et al. (Reference HeithIt, Schmidt and Mulrooney2001) with slight modifications. SA solutions (Sigma-Aldrich, St. Louis, Missouri, USA) were provided by mixing this compound in a 0.1% (v/v) aqueous solution comprised of TWEEN® 20 (Sigma-Aldrich), as an emulsifier. Canola plants were sprayed with SA at a concentration of 1 mM nearly 30 days after sowing (fourth leaf stage). They were exposed to cabbage aphids 48 h after the application of SA.
Determination of secondary metabolites
Total glucosinolate content
Spectrophotometric assessment was carried out using methanolic extract prepared from the youngest infested canola leaves under different treatments by homogenizing 0.1 mg leaf in a 2 ml vial with 80% methanol. This homogenate was centrifuged at 3000 rpm for 4 min after being kept overnight at room temperature. The supernatant was gathered after centrifugation and made up to 2 ml with 80% methanol. A total of 100 μl of this extract was applied for evaluation. A total of 0.3 ml double-distilled water and 3 ml of 2 mM sodium tetrachloropalladate (58.8 mg sodium tetrachloropalladate + 170 μl concentrated HCl + 100 ml double-distilled water) was appended to it. After incubation at room temperature for 1 h, absorbance was read at 425 nm using a spectrophotometer (Mawlong et al., Reference Mawlong, Kumar, Gurung, Singh and Singh2017). A blank was set following the same procedure without the extract. This procedure was conducted in ten replicates. Total glucosinolates were calculated by putting the OD of each sample taken at 425 nm into the predicted formula y = 0.9846x + 1.1344.
Total phenol and flavonoid contents
The amount of total phenolic content in the youngest aphid-infested leaves of the canola plants under the studied treatments was determined based on the method described by Ronald and Laima (Reference Ronald and Laima1999) for which a 0.1 mg sample of the leaf was milled in 95% ethanol and allowed to extract for 24–72 h. Then, to 1 ml of sample, 1.5 ml of 95% ethanol was appended and made up to a volume of 5 ml with distilled water. To this combination, 0.5 ml of 50% Folin's reagent and 1 ml of 5% sodium carbonate was added and vortexed. The mixture was reserved in the dark for 1 h. Afterward, the absorbance was measured at 725 nm using a spectrophotometer (Ronald and Laima, Reference Ronald and Laima1999). The concentration of total phenolic content was determined as mg of gallic acid equivalent using an equation obtained from the gallic acid calibration curve. This experiment was carried out in ten replicates.
Total flavonoid content in the youngest aphid-infested leaves of canola plant under the studied treatments was evaluated using the technique of Jia et al. (Reference Jia, Tang and Wu1999). A total of 500 μl sample was mixed with 5% sodium nitrite (75 μl), and thereafter the mixture was shaken and permitted to place for 5 min at room temperature. Afterward, the mixture was sequentially blended with 10% aluminum chloride (150 μl), 1 M NaOH (500 μl), and distilled water (275 μl). The absorbance was determined at 510 nm by a spectrophotometer. Calibration curve was prepared by quercetin at a concentration between 0.01 and 0.5 mg ml−1. Quantification of total flavonoids was performed using a calibration curve of quercetin at concentrations between 0.01 and 0.5 mg ml−1 and expressed as mg quercetin equivalents per gram sample (QE mg g−1). This estimation of total flavonoid content from extracts was conducted in ten replicates.
Data analysis of secondary metabolites
Data of determination of secondary metabolites were tested for significance using the one-way analysis of variance in SPSS for Windows, version 22.0 (SPSS, 2015). The differences among treatment means were compared using the Tukey test with P = 0.05.
Aphid behavior
A free choice test was carried out in a greenhouse (20–30°C, 60 ± 5% RH, and natural photoperiod) using a completely randomized design. One seedling for each treatment was reared and kept randomly at the margin of a large clay pot (40 cm diameter × 7 cm height). Seedlings were spaced equidistantly in a circular pattern. Then starved 130 motile wingless aphids (for 4 h) were released in the center of the pot on paper. Each pot was surrounded with a transparent plastic cylinder (40 cm in diameter and 30 cm in height), the top of which was covered with fine mesh gauze to prevent escape or parasitism of the aphids. This procedure was conducted in ten replicates. Data were recorded after 24 and 48 h according to Wiseman et al. (Reference Wiseman, Gueldner and Lynch1982) and Khan et al. (Reference Khan, Rueda and Caballero1989). Data were assessed for normality with the Kolmogorov–Smirnov test. Variables were evaluated using the one-way analysis of variance in SPSS version 22.0 (SPSS, 2015). The Tukey test was used for multiple comparisons (SPSS, 2015).
Aphid performance
This experiment was conducted using clip cages (6 cm diameter and 1.5 cm depth) established on the leaves of potted canola plants under studied treatments in a growth chamber (25 ± 1°C, 60 ± 5% RH, and 16L: 8D). Apterous adults of the cabbage aphid were placed individually on the lower surface of the same leaves for each plant. Therefore, each plant was considered a replicate, and a total of 50 clip cages were established on canola plants in each treatment. There was one clip cage containing one leaf on each plant (at four-leaf stage). A narrow foam ring had been glued to the cage margin to prevent damage of the leaf. After 24 h, aphid mother and all nymphs except one nymph were removed. Each cage was monitored daily until the maturity of the aphid to determine nymph development period and preadult survival of B. brassicae for each treatment. After maturity, daily observations were continued until each female aphid died. The numbers of nymphs produced per female aphid were calculated in each cage daily, and then all nymphs were removed from the cages.
The raw life-history data of all individuals of the cabbage aphid were analyzed by the TWOSEX-MSChart program (Chi, Reference Chi2017) based on the age-stage, two-sex life table theory (Chi and Liu, Reference Chi and Liu1985). The age-stage-specific survival rate (sxj) (where x is the age and j is the stage), age-stage-specific fecundity (fx j), age-specific survival rate (lx), age-specific fecundity (mx), and age-specific maternity (lxmx) were calculated from the daily records of the survival and fecundity of all individuals in the cohort. Furthermore, the fertility life table parameters including the intrinsic rate of natural increase (r), finite rate of increase (λ), net reproductive rate (R 0), mean generation time (T), and doubling time (DT) were evaluated. The intrinsic rate of increase was determined using the iterative bisection method from the Euler–Lotka formula with age indexed from 0 (Goodman, Reference Goodman1982)
 $$\mathop \sum \limits_{x = 0}^w {\rm e}^{{-}r\lpar {x + 1} \rpar }lxmx = 1$$
The means and standard errors of life table parameters were estimated via the bootstrap technique (Efron and Tibshirani, Reference Efron and Tibshirani1993; Huang and Chi, Reference Huang and Chi2012) with 100,000 resampling. The bootstrap technique is embedded in the computer program TWOSEX-MSChart. The paired bootstrap test was used to assess the differences between treatments.
Measurement of plant growth parameters
We measured the plant growth parameters such as fresh weight, dry weight, and chlorophyll content under the four abovementioned treatments, 10 days after the artificial infestation of seedlings to cabbage aphid. This experiment was carried out at ten replications for each treatment. To determine the fresh weight, the roots of canola seedlings were washed in water to remove soil particles and then the seedlings were dried with tissue towels for about 10 min, and weighed on a microbalance. To determine dry weight, the seedlings were then dried at 60°C for 48 h, and weighed.
In addition, the amounts of chlorophyll a, b and total were measured based on the standard method proposed by Arnon (Reference Arnon1967). Therefore, 1 g leaf sample was crushed with 5 ml acetone 80% in the porcelain mortar. Obtained extract was purified by filter paper. Remained leftovers in the mortar were completely washed by 10 ml of acetone and crossed from filter paper. Obtained samples were as entirely homogenized liquid to 10 ml volume. Then, the absorbance was measured at the wavelengths of 663 and 645 nm using a spectrophotometer. Chlorophyll a, b and total for each sample of treatments were determined following Gu et al. (Reference Gu, Wang, Hu, Zhang, Wang and Wang2016):
 $$\eqalign{& {\rm Chlorophyll}\;{\rm a}\;\lpar {{\rm mg\ }{\rm g}^{{-}1}\;{\rm fw}} \rpar = \lpar {12.7 \times {\rm A}663} \rpar -\lpar {2.59 \times {\rm A}645} \rpar \cr & {\rm Chlorophyll}\;{\rm b}\;\lpar {{\rm mg\ }{\rm g}^{{-}1}\;{\rm fw}} \rpar = \lpar {22.9 \times {\rm A}645} \rpar -\lpar {4.7 \times {\rm A}663} \rpar \cr & {\rm Chlorophyll}\;{\rm total}\;\lpar {{\rm mg\ }{\rm g}^{{-}1}\;{\rm fw}} \rpar = \lpar {8.2 \times {\rm A}663} \rpar + \lpar {20.2 \times {\rm A}645} \rpar } $$
where A663 and A645 are the absorbance evaluated from 663 and 645 nm, respectively.
Data were evaluated for normality with the Kolmogorov–Smirnov test and were analyzed by the one-way analysis. Then, multiple comparisons were done using the Tukey test (SPSS, 2015).
Results
Determination of some secondary metabolites
Total glucosinolate content
Our results showed that studied treatments significantly influenced the amount of total glucosinolate in aphid-infested leaves of canola (F = 28.29; df = 3, 36; P < 0.0001; table 1). The level of total glucosinolate in plants treated with P. putida, SA, and P. putida + SA was significantly higher than control plants (table 1).
Table 1. The mean (± SE) amount of secondary metabolites in aphid-infested leaves of canola plants treated with Pseudomonas putida and salicylic acid (SA)

Total GLs, total glucosinolate, TPC, total phenolic content, TFC, total flavonoid content.
Means followed by a different letter within a column are significantly different (Tukey's HSD test; P < 0.05), N = 10.
Total phenol and flavonoid contents
The level of total phenol and flavonoid contents in aphid-infested leaves of canola varied significantly among different treatments (F = 18.74; df = 3, 36; P < 0.0001 and F = 120.88; df = 3, 36; P < 0.0001; respectively) (table 1). The highest and lowest amounts of these compounds were observed on the treatments of P. putida + SA and control, respectively. Furthermore, the total phenol and flavonoid contents under SA treatment were significantly higher than P. putida treatment (table 1).
Antixenosis test
There were significant differences in the number of aphids attracted to the canola plants under different treatments, 24 and 48 h after the release (F = 15.93; df = 3, 36; P < 0.0001 and F = 24.57; df = 3, 36; P < 0.0001; respectively) (table 2). After 24 and 48 h, the lowest number of aphids was recorded on P. putida + SA treatment (8.80 and 12.20; respectively) and the highest was observed on control (19.60 and 29.00; respectively). Moreover, the number of aphids on SA treatment did not differ significantly from the treatments of P. putida and P. putida + SA (table 2).
Table 2. Mean (± SE) numbers of attracted Brevicoryne brassicae on canola plants treated with Pseudomonas putida and salicylic acid (SA) after 24 and 48 h

Means followed by a different letter within a column are significantly different (Tukey's HSD test; P < 0.05).
Antibiosis test
There was no significant difference in the nymph periods of B. brassicae among treatments (table 3). However, tested treatments significantly influenced longevity, reproductive period, and fecundity of this aphid (table 3). The values of these parameters under the treatments of P. putida + SA, SA, P. putida, and control increased, respectively, at 5% significance level (table 3). Furthermore, the lowest (0.64) and highest (0.84) preadult survival rates of this aphid were recorded on the treatments of P. putida + SA and control, respectively (table 3). The age-stage-specific survival rate (sxj) represents the probability that a nymph of B. brassicae will survive to age x and stage j (fig. 1). The variable development rates among individuals in the cohort resulted in an overlapping of the stage-specific survivorship curves. The probability that a newborn nymph would survive to the adult stage was 0.84 on control, 0.80 on P. putida, 0.76 on SA, and 0.64 on P. putida + SA. Then survival declined gradually with increased age of the aphid. When all stages are pooled, the age-specific survival rate (lx) gives a simplified overview of the survival history of the whole cohort (fig. 2). Death of the last female under the treatments of P. putida + SA, SA, P. putida, and control occurred at days of 15, 18, 20, and 28, respectively. The highest fx 2 peak in the treatments of P. putida + SA, SA, P. putida, and control was 1.48, 2, 3.09, and 5.44, respectively. The age-specific fecundity (mx) and the age-specific maternity (lxmx) of B. brassicae are also shown in fig. 2. The highest peaks of mx and lxmx were recorded as 1.4 and 0.9 on P. putida + SA (at 9 day), 1.88 and 1.24 on SA (at 10 day), 3.03 and 2.3 on P. putida (at 11 day), and 5.07 and 4.26 on control (at 12 day). The age-stage life expectancy (exj) (where x is the age and j is the stage) shows the expected lifespan for an individual of age x and stage j (fig. 3). The life expectancies of B. brassicae at age zero (e 01) were 9.20, 11.52, 13.52, and 18.64 days, on the treatments of P. putida + SA, SA, P. putida, and control, respectively, and at the stage of aphid maturity, 5.18, 7.55, 9.81, and 15.07 days (fig. 3).
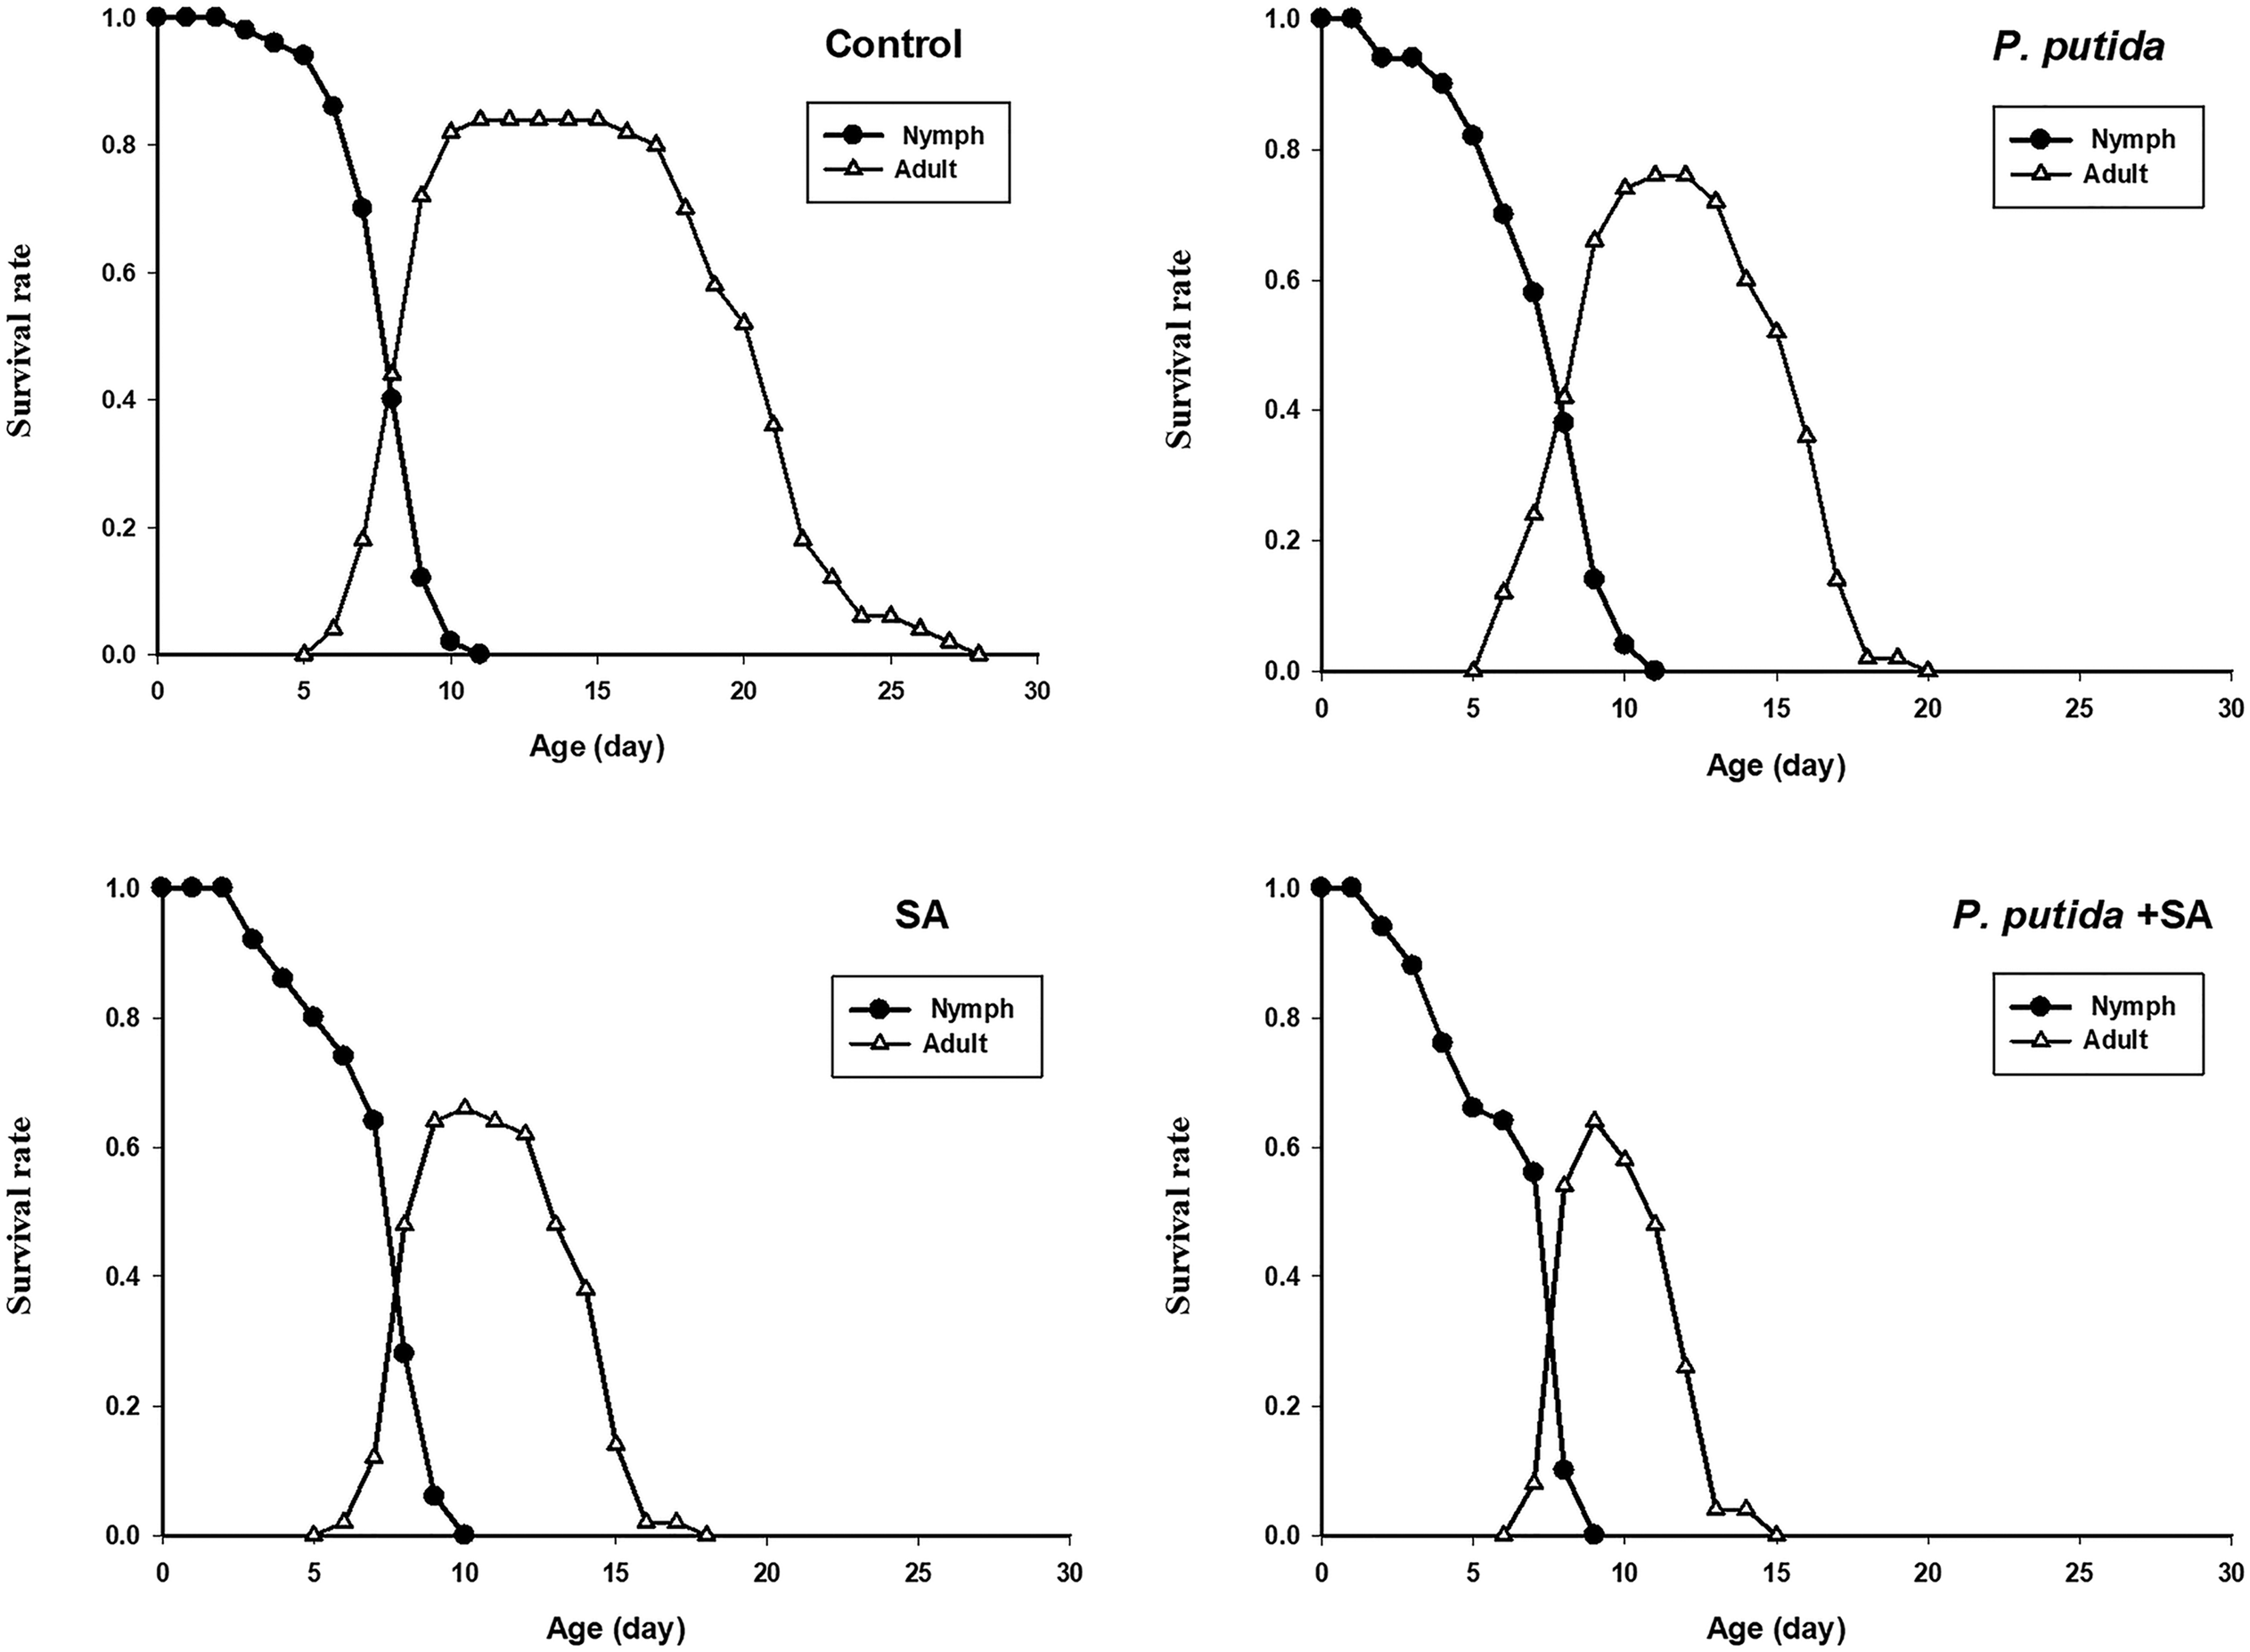
Figure 1. Age-stage specific survival rate (sxj) of Brevicoryne brassicae on canola plants treated with Pseudomonas putida and salicylic acid (SA).

Figure 2. Age-specific survival rate (lx), female age-specific fecundity (fx2), age-specific fecundity (mx), and age-specific maternity (lxmx) of Brevicoryne brassicae on canola plants treated with Pseudomonas putida and salicylic acid (SA).
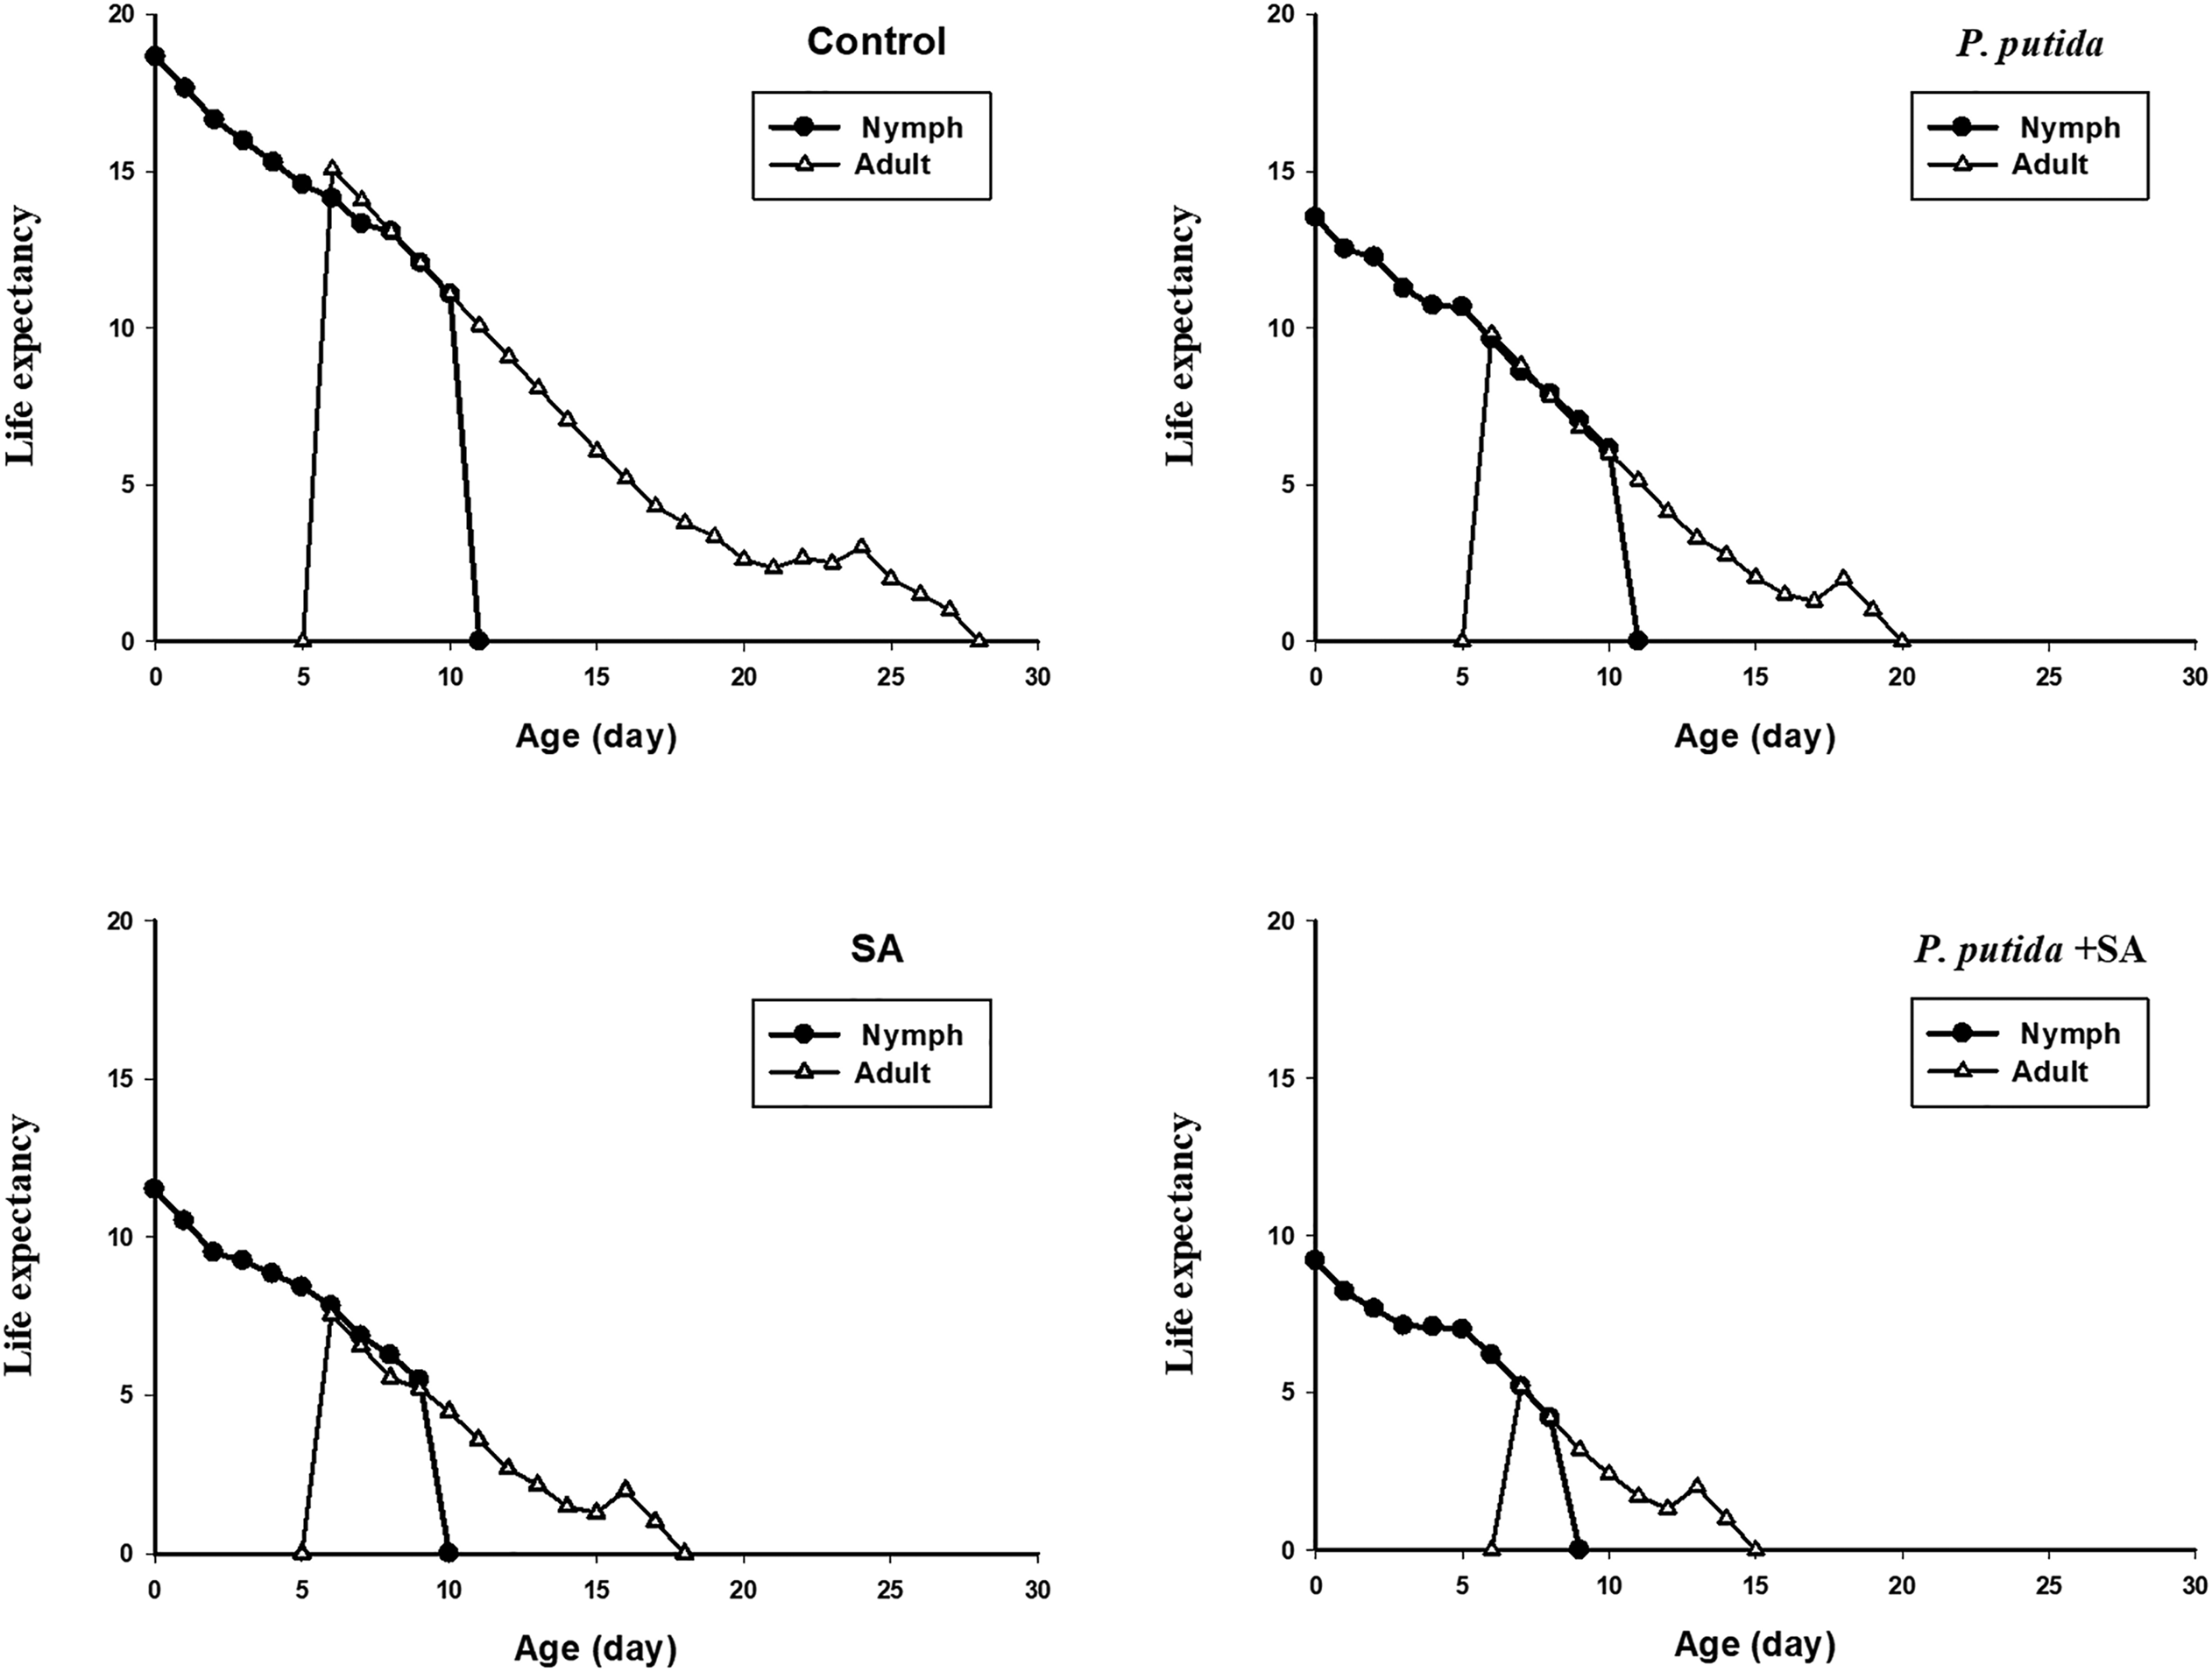
Figure 3. Age-stage specific life expectancy (exj) of Brevicoryne brassicae on canola plants treated with Pseudomonas putida and salicylic acid (SA).
Table 3. Mean (± SE) nymph period, adult longevity, reproductive period, and fecundity of Brevicoryne brassicae on canola plants treated with Pseudomonas putida and salicylic acid (SA)

Means within a column followed by different letters are significantly different according to the paired bootstrap test at 5% significance level.
The population growth parameters of B. brassicae fed on control and treated plants with P. putida and SA are presented in table 4. The values of the net reproductive rate (R 0), the intrinsic rate of population increase (r), and finite rate of increase (λ) of the cabbage aphid decreased significantly in the following order: control (47.19 offspring, 0.293 and 1.340 day−1), P. putida (16.7 offspring, 0.238 and 1.269 day−1), SA (6.37 offspring, 0.163 and 1.178 day−1), and P. putida + SA (3.24 offspring, 0.1121 and 1.119 day−1) (table 4).
Table 4. Mean (± SE) life table parameters of Brevicoryne brassicae L. on canola plants treated with Pseudomonas putida and salicylic acid (SA)

R 0 = net reproductive rate, rm = intrinsic rate of increase, λ = finite rate of increase, T = mean generation time, and DT = doubling time.
Means within a column followed by different letters are significantly different according to the paired bootstrap test at 5% significance level.
In the current study, there were significant differences in the generation time (T) and the doubling time (DT) values of B. brassicae among the tested treatments (table 4). The doubling time (DT) was the longest (6.13 days) in P. putida + SA treatment and the shortest (2.36 days) in control (table 4).
Plant growth parameters
In this study, the analysis of plant growth parameters data indicated significant differences in the amounts of fresh weight (F = 5.54; df = 3, 36; P < 0.0001), dry weight (F = 8.24; df = 3, 36; P < 0.0001), chlorophyll a (F = 21.38; df = 3, 36; P < 0.0001), chlorophyll b (F = 46.45; df = 3, 36; P < 0.0001), and total chlorophyll (F = 123.55; df = 3, 36; P < 0.0001) (table 5).
Table 5. The mean (±SE) fresh weight, dry weight, and chlorophyll content of Brevicoryne brassicae L. on canola plants treated with Pseudomonas putida and salicylic acid (SA)

Means followed by a different letter within a column are significantly different (Tukey's HSD test; P < 0.05).
The maximum fresh weight and dry weight were determined in P. putida + SA treatment (6.59 and 1.61 g plant−1; respectively) and the least in control (3.57 and 0.82 g; respectively) (table 5). The chlorophyll a content was the highest on P. putida + SA treatment (2.30 mg g−1 fresh weight) and the lowest on control (1.82 mg g−1 fresh weight) (table 5). Furthermore, chlorophyll b content under P. putida + SA treatment (4.13 mg g−1) was calculated to be significantly higher compared to P. putida and control treatments (3.30 and 3.24 mg g−1, respectively) (table 5). For all the tested treatments, the amount of total chlorophyll exhibited following pattern in a descending order: P. putida + SA, SA, P. putida, and control (6.46, 5.85, 5.32, and 5.09 mg g−1, respectively) (table 5).
Discussion
In the current study, canola plants treated with P. putida and SA negatively affected the behavior and performance of the aphids compared with the untreated control plants. This research makes a new contribution to the knowledge of the efficiency of the integration of both inducers. Additionally, secondary metabolites including the glucosinolates, total phenol, and flavonoids in canola leaves increased significantly under treatments containing P. putida and SA. Therefore, these inducers can influence the levels of secondary metabolites in canola. In particular, their effects on the amounts of flavonoids and phenolics seem to be significantly additive. The activation of the secondary metabolism in plants, produced by the application of elicitors, incites a series of mechanisms involved in the synthesis of metabolites such as phenolic compounds (Díaz-Rivas et al., Reference Díaz-Rivas, González-Laredo, Chávez-Simental, Montoya-Ayón, Moreno-Jiménez, Gallegos-Infante and Rocha-Guzmán2018). SA elicitor regulates the actions of various enzymes such as polyphenol oxidase, peroxidase, which are the key components of induced plant defense against biotic and abiotic stresses (Hayat et al., Reference Hayat, Hayat, Irfan and Ahmad2009; Zhao et al., Reference Zhao, Chen, Cheng, Sun, Liu and Tian2009; War et al., Reference War, Paulraj, War and Ignacimuthu2011). Díaz-Rivas et al. (Reference Díaz-Rivas, González-Laredo, Chávez-Simental, Montoya-Ayón, Moreno-Jiménez, Gallegos-Infante and Rocha-Guzmán2018) have shown that SA elicitor could enhance the phenylalanine ammonia-lyase activity in salvilla, and this response promotes the phenolic synthesis associated with the enhancement of the defense resistance of the plants. Two basic routes of the shikimic and malonic acid pathways are known in the biosynthesis of phenolic compounds (Díaz-Rivas et al., Reference Díaz-Rivas, González-Laredo, Chávez-Simental, Montoya-Ayón, Moreno-Jiménez, Gallegos-Infante and Rocha-Guzmán2018). SA not only regulates the components of its own signaling pathway, but also is involved in cross-talk with other pathways that mediate plant resistance (War et al., Reference War, Paulraj, War and Ignacimuthu2011). On the other hand, PGPR acts as an effective elicitor for the key enzymes that provoke the biosynthesis of secondary metabolites in plants through the ISR mechanism (Chen et al., Reference Chen, Belanger, Benhamou and Paulitz2000; van Loon and Glick, Reference van Loon, Glick and Sandermann2004). PGPR can stimulate the biosynthesis of JA in plants which acts as a transducer for elicitor signaling pathways, leads to the accumulation of secondary metabolites in plants (Mueller et al., Reference Mueller, Brodschelm, Spannagl and Zenk1993). There is some evidence that PGPR and SA could be related to the production of secondary metabolites. For example, Meena et al. (Reference Meena, Radhajeyalakshmi, Marimuthu, Vidhyasekaran, Doraiswamy and Velazhahan2000) demonstrated that the foliar application of Pseudomonas fluorescens strain Pf1 could enhance the phenolic compounds of peanut plants. In another study, the values of total phenol, flavonoids, and glucosinolates were significantly higher in aphid-infested leaves of canola plants treated with PGPR (foliar spraying) compared with untreated plants and results in increased resistance to cabbage aphid (Sattari Nasab et al., Reference Sattari Nasab, Pahlavan Yali and Bozorg-Amirkalaee2018). The current research also showed that seed inoculation with PGPR is effective on these secondary metabolites and, consequently, the resistance to B. brassicae. Moreover, SA considerably enhanced the phytochemical contents (such as total phenolic and flavonoid) in Chinese cabbage plants (Thiruvengadam et al., Reference Thiruvengadam, Kim and Chung2015) and sweet basil (Koca and Karaman, Reference Koca and Karaman2015). These findings were similar to the current results on canola. Similarly, there are several other reports regarding the positive effects of SA on increasing phenolic levels in Brassica alboglabra Bailey (Sun et al., Reference Sun, Yan, Zhang and Wang2012) and Lactuca Sativa L. (Kim et al., Reference Kim, Fonseca, Choi and Kubota2007). Moreover, it has been previously shown that SA treatment increases glucosinolates in B. napus (Kiddle et al., Reference Kiddle, Kevin and Wallsgrove1994), Brassica rapa L. (Smetanska et al., Reference Smetanska, Krumbein, Schreiner and Knorr2007), and B. alboglabra (Sun et al., Reference Sun, Yan, Zhang and Wang2012). In this research, the total glucosinolates content in aphid-infested leaves was enhanced by the induction of SA alone or in combination with PGPR. The SA signaling pathway is activated to induce resistance in a number of plant species by aphid feeding (Moran et al., Reference Moran, Cheng, Cassell and Thompson2002; Zhu-Salzman et al., Reference Zhu-Salzman, Salzman, Ahn and Koiwa2004; Coppola et al., Reference Coppola, Coppola, Rocco, Digilio, D'Ambrosio, Renzone, Martinelli, Scaloni, Pennacchio, Rao and Corrado2013).
The current findings from the antixenosis experiment showed the significant efficacy of the tested treatments on the number of aphids attracted to B. napus, as plants treated with P. putida + SA displayed strong antixenosis after 24 and 48 h. Furthermore, canola plants treated with SA or P. putida were less preferred by B. brassicae compared with the control plants, which could be related to the higher levels of secondary metabolites in canola leaves under these treatments. The isothiocyanates (catabolites of the glucosinolates) are main components mediating host location for B. brassicae (Nottingham et al., Reference Nottingham, Hardie, Dawson, Hick, Pickett, Wadhams and Woodcock1991). The variation in plant volatiles among canola plants under tested treatments has not been examined. Bruce and Pickett (Reference Bruce and Pickett2011) demonstrated that the perception of blends of plant volatiles plays a key role in host recognition, non-host avoidance, and subsequent behavioral responses. Based on their findings, the behavioral activity elicited by blends of volatiles is stronger than that elicited by individual compounds. In general, the difference in the number of aphids attracted could be attributed to variations in chemical compounds, olfactory, and tactile stimuli in host plants (Mohammadi Anaii et al., Reference Mohammadi Anaii, Pahlavan Yali and Bozorg-Amirkalaee2018). Thiruveni et al. (Reference Thiruveni, Shanthi, Baskaran and Raguchander2011) showed antixenotic resistance induced by the talc-based bioformulation of PGPR (P. fluorescens Pf1 + Beauveria bassiana B2) against Earias vittella (Fabricius) moths. Oluwafemi et al. (Reference Oluwafemi, Bruce, Pickett, Ton and Birkett2011) suggested that the application of methyl salicylate on maize would effectively repel leaf hoppers, Cicadulina storeyi China. Furthermore, Favaro et al. (Reference Favaro, Resende, Gabriel, Zeist, Cordeiro and Júnior2019) verified the antixenosis resistance in strawberry cultivars treated with SA against the two-spotted spider mite. This effect can be due to SAR that results from invader recognition accompanied by the induction of the synthesis of particular materials, such as chitinases and other hydrolytic enzymes, because of the elicitor action as an endogenous signal for triggering the plant defense response (Mandal et al., Reference Mandal, Csinos, Martinez, Culbreath and Pappu2008).
In the current research, some biological characteristics (such as preadult survival, reproduction period, and fecundity) and population growth parameters (such as R 0, λ, and r) of B. brassicae were lowest on the P. putida + SA treatment, representing the minor suitability of canola plants treated with these compounds compared with the others for this aphid. A reduction in total fecundity of the aphid on P. putida and SA-treated plants compared with the control plants appeared to be the result of a reduction in the number of productive days. Since the intrinsic rate of natural increase (r) is a reflection of survival, fecundity, and generation time of the pest, it can be used as the most valuable index to evaluate pest performance under different conditions of the host plant (Carey, Reference Carey1993; Southwood and Henderson, Reference Southwood and Henderson2000). In the present study, the lower value of r of the cabbage aphid (0.112 day−1) under the P. putida + SA treatment could be related to meager fecundity, the shorter reproductive period, and the lower survival rate of this aphid. Moreover, the poor performance of B. brassicae on plants treated with P. putida + SA was associated with the lower age-stage life expectancy (exj) of individuals on this treatment. Therefore, it can be concluded that P. putida + SA leads to antibiosis resistance in canola plants to B. brassicae. Phytohormones like SA are able to regulate symbiosis and mediate ISR prompted by useful microbes in the interactions between plants and non-pathogenic rhizosphere microbes (De Vleesschauwer and Höfte, Reference De Vleesschauwer and Höfte2009; Zamioudis and Pieterse, Reference Zamioudis and Pieterse2012). Similarly, some PGPR-induced biochemical alterations prompt ISR in plants against herbivorous insects (Rajendran et al., Reference Rajendran, Samiyappan, Raguchander and Saravanakumar2007; van de Mortel et al., Reference Van de Mortel, De Vos, Dekkers, Pineda, Guillod, Bouwmeester, van Loon, Dicke and Raaijmakers2012; Wielkopolan and Obrepalska-Steplowska, Reference Wielkopolan and Obrepalska-Steplowska2016; Zebelo et al., Reference Zebelo, Song, Kloepper and Fadamiro2016). Fahimi et al. (Reference Fahimi, Ashouri, Ahmadzadeh, Hoseini Naveh, Asgharzadeh and Maleki2014) showed that the application of P. fluorescens strains UTPF68 and PF169 on cucumber led to a decrease in the average number of progeny produced by A. gossypii adults. In the current life table study, it was found that when B. brassicae is reared on canola plants treated with P. putida alone, its performance is decreased compared with the control, but increased compared with the SA and P. putida + SA treatments, which implies that treatments containing SA were more effective in reducing pest infestation than P. putida. Several studies have documented that SA decreased the population of some aphid species (Pettersson et al., Reference Pettersson, Pickett, Pye, Quiroz, Smart, Wadhams and Woodcock1994; Elhamahmy et al., Reference Elhamahmy, Mahmoud and Bayoumi2016). Filed experiments have shown that methyl salicylate decreases the density of Rhopalosiphum padi L. (Hemiptera, Aphididae) in wheat (Pettersson et al., Reference Pettersson, Pickett, Pye, Quiroz, Smart, Wadhams and Woodcock1994). Elhamahmy et al. (Reference Elhamahmy, Mahmoud and Bayoumi2016) concluded that the foliar application of SA on canola plant results in decreased B. brassicae L. population. Similarly, Thakur et al. (Reference Thakur, Sangha, Arora and Javed2016) indicated that the foliar application of SA was effective on the mustard aphid, Lipaphis erysimi Kalt, through positive modulation in the activities of defense proteins. In another study, the artificial induction of SA-dependent defenses has been shown to reduce population growth of the potato aphid, M. euphorbiae (Thomas) on tomato (Cooper et al., Reference Cooper, Jia and Goggin2004). Also, the exogenous application of SA enhanced the resistance of wild rice plants to the brown planthopper, Nilaparvata lugens (Stål) (Guo et al., Reference Guo, Xu, Wu, Zhao, Qiu, Wang, Ouyang, Cai, Liu, Jing, Shangguan, Wang, Ma, Hu, Wu, Shi, Wang, Zhu, Xu, Chen, Feng, Du and He2018). Those findings were consistent with the current ones, when B. brassicae fed on canola plants treated with SA. However, the current study achieved a new discovery regarding the application of integrated SA and P. putida, that were led to lower population growth of this aphid. It seems that in the current study, the lower performance of the cabbage aphid on canola plants treated with P. putida + SA could be due to the decreased quality of the plant, which was caused by increasing the levels of secondary metabolites such as glucosinolates, total phenol, and flavonoids in canola leaves. Earlier reports indicated a significant negative relationship between the glucosinolates contents of Brassica species and the invasion of some aphids feeding on them (Labana et al., Reference Labana, Ahjua, Gupta and Brar1983; Malik et al., Reference Malik, Anand and Srinivasachar1983). The glucosinolate content of brassicaceous crops can be altered as a systemic response to plant signaling molecules such as SA (Kiddle et al., Reference Kiddle, Kevin and Wallsgrove1994). Moreover, phenolics are biologically effective secondary metabolites, negatively impacting the development, reproduction, and population growth parameters of aphids (Wójcicka, Reference Wójcicka2010). These effects were clear in the current research. Negative correlations between phenolic compounds presence in host plant and aphid populations have been demonstrated for some aphid species such as Metoplophium dirhodum (Walker) (Havlíčková, Reference Havlíčková1995), Schizaphis graminum (Rondani), Diuraphis noxia Kurdjumov (Sandström et al., Reference Sandström, Telang and Moran2000), Sitobion avenae (Fabricius) (Czerniewicz et al., Reference Czerniewicz, Sytykiewicz, Durak, Borowiak-Sobkowiak and Chrzanowski2017), and Myzocallis coryli Goetze (Gantner et al., Reference Gantner, Najda and Piesik2019). According to Taiz and Zeiger (Reference Taiz and Zeiger2002), flavonoid compounds can mediate plant growth and defense response against insects and microbes. Kuśnierczyk et al. (Reference Kuśnierczyk, Winge, Jørstad, Troczyńska, Rossiter and Bones2008) demonstrated that a wide range of defense responses in Arabidopsis thaliana (L.) Heynhold to B. brassicae attack is dependent upon SA signaling. Activation of the SA pathway can be a general mechanism of antibiosis or aphid repellence in resistant host plants, with limited effectiveness in susceptible ones (Hardie et al., Reference Hardie, Issacs, Pickett, Wadhams and Woodcock1994; Morkunas and Gabryś, Reference Morkunas and Gabryś2011).
The current research indicated that the application of treatments containing SA and P. putida compared with the control resulted in the enhancement of plant growth parameters. Also, Cakmakci et al. (Reference Cakmakci, Erat, Erdo.an and Donmez2007) reported the significant effects of PGPR on plant growth parameters like plant height, leaf area, and shoot fresh weight in spinach and wheat. Cheng et al. (Reference Cheng, Park and Glick2007) showed that the inoculation of P. putida strain UW4 comprising the ACC deaminase enzyme in the presence of salt considerably enhanced canola growth. In addition, various studies have reported that PGPR inoculation increases the photosynthetic pigments in different plant species (Kohler et al., Reference Kohler, Hernándezb, Caravaca and Roldán2009; Bhattacharyya and Jha, Reference Bhattacharyya and Jha2012). Similarly, this study also found higher chlorophyll content in canola plants treated with PGPR than untreated control plants. Furthermore, chlorophyll content was enhanced when plants were treated with SA in the current research, which is consistent with the results of Yildirim et al. (Reference Yildirim, Turan and Guvenc2008), who demonstrated that the foliar application of SA stimulated plant growth and chlorophyll content. The positive effects of SA application on chlorophyll accumulation in Wolffia arrhiza (L.) have also been reported by Czerpak et al. (Reference Czerpak, Dobrzyn, Krotke and Kicińska2002). Moreover, glucosinolates, phenolics, and flavonoids in B. rapa were responsive to phytohormone elicitor-mediated enhancement (Thiruvengadam et al., Reference Thiruvengadam, Kim and Chung2015). Increases in the chlorophyll content of the leaves of PGPR- and SA-treated plants could be due to the greater availability of nutrients and augmented organic matter in the rhizosphere (Esitken et al., Reference Esitken, Pirlak, Turan and Sahin2006; Nadeem et al., Reference Nadeem, Zahir, Naveed and Arshad2007). However, some studies have shown that the long-term treatment of plants with SA decreased the chlorophyll content in barley (Pancheva et al., Reference Pancheva, Popova and Uzunova1996) and basil (Karalija and Parić, Reference Karalija and Parić2017). The efficiency of exogenous application of SA can differ depending upon the plant species, growth stage, application technique, and SA concentration (Borsani et al., Reference Borsani, Valpuesta and Botella2001). In addition, the helpful effect of the combined P. putida and SA application on plant growth indices was significantly obvious in the current research. Khan et al. (Reference Khan, Zandi, Ali, Mehmood, Shahid and Yang2018) demonstrated that the integrated application of PGPR and SA considerably increased the leaf phenolics compounds and chlorophyll contents. In fact, their findings showed that SA combined with PGPR acted synergistically for the elimination of heavy metals and plant growth. Several studies have demonstrated that PGPR/SA in canola plant resulted in multiple benefits on plant growth and yield due to its role in integrated nutrient management and root proliferation plus exopolysaccharide production (Khan et al., Reference Khan, Zandi, Ali, Mehmood, Shahid and Yang2018, Reference Khan, Bano, Rahman, Rathinasabapathi and Babar2019; Naseem et al., Reference Naseem, Ahsan, Shahid and Khan2018). Elhamahmy et al. (Reference Elhamahmy, Mahmoud and Bayoumi2016) have also shown that SA at low concentrations had positive effects on decreasing aphid population on inflorescence and increasing the growth and productivity of canola.
In summary, canola plants treated by P. putida + SA with the highest levels of glucosinolates, total phenol, and flavonoids in leaves were more resistant to the cabbage aphid. Furthermore, the separate application of P. putida and SA treatments can be recommended on canola because of the lower performance of the aphid on these treatments compared with the control. These results will be helpful in finding ways to induce resistance in canola against B. brassicae and, as a result, might cause reduced reliance on synthetic insecticides for pest control. Because elicitors may change the chemical composition of the treated plant material, there are risks of altered crop quality by the increased level of some secondary metabolites (Holopainen et al., Reference Holopainen, Heijari, Nerg, Vuorinen and Kainulainen2009). Therefore, similar wide safety testing for pesticides will be required for the application of elicitors in the programs of crop management. However, the advantages of using elicitor treatments based on growth chamber and greenhouse experiments or small-scale field trials could include: (1) reduced damage from herbivorous pests and fungal infection (De Meyer and Höfte, Reference De Meyer and Höfte1997; Cooper et al., Reference Cooper, Jia and Goggin2004; Peng et al., Reference Peng, Deng, Huang, Jia, Miao and Huang2004; Elhamahmy et al., Reference Elhamahmy, Mahmoud and Bayoumi2016); (2) the lower environmental hazards of elicitors compared with pesticides (Holopainen et al., Reference Holopainen, Heijari, Nerg, Vuorinen and Kainulainen2009); (3) attraction of some natural enemies of pest insects by inducing plant volatiles (De Boer and Dicke, Reference De Boer and Dicke2004; James and Grasswitz, Reference James and Grasswitz2005; Degen et al., Reference Degen, Bakalovic, Bergvinson and Turlings2012); (4) the lower ecological risks of applying elicitors compared with the genetically modified plants (Poppy and Wilkinson, Reference Poppy and Wilkinson2005).
The current study is evidence that SA elicitor and PGPR could be considered in the future as an alternative to conventional pesticides for the control of the cabbage aphid. Further research, including field experiments, is required to achieve more accurate results for the effective and sustainable management of canola pests.
Acknowledgements
We appreciate Shahid Bahonar University (Iran) for the financial support of this research.


