


Introduction
Globally, aphids (Hemiptera: Aphididae) are among the most economically important insect pests of crops (Emden & Harrington, Reference Emden and Harrington2007). Aphids also rank high as invasive pests due to their ease of transport and parthenogenetic mode of reproduction (Foottit et al., Reference Foottit, Maw, Von Dohlen and Hebert2008). They are known to cause 70–80% of yield losses on different crops worldwide (Aslam et al., Reference Aslam, Razaq, Ahmad and Mirza2007). These losses are due to direct feeding damage on plant sap that results in stunted growth, distortion, wilting, yellowing of plants consequently leading to severe crop production losses (Aslam et al., Reference Aslam, Razaq, Ahmad and Mirza2007). Indirect damages results from transmission of plant viruses and their related diseases, plant deformation arising from toxic salivary secretions and excretion of honey dew that favours the growth of sooty mold fungus (Blackman & Eastop, Reference Blackman and Eastop2000). Other than causing a reduction in photosynthetic activity, honey dew and sooty mold contaminate the quality of crops which in turn reduce both the aesthetic appeal and marketability of these crops (Worf et al., Reference Worf, Heimann and Pellitteri1995).
Considering their economic importance, timely and accurate identification of aphid species is crucial for effective pest management strategies and phytosanitary management (Miller & Foottit, Reference Miller, Foottit, Foottit and Adler2009; Lee et al., Reference Lee, Kim, Lim, Choi, Kim, Kim, Ji, Foottit and Lee2011). Traditionally, aphid species have been identified based on their morphological characters (Emden & Harrington, Reference Emden and Harrington2007). However, their small size and reduction or loss of key morphological characteristics poses a serious problem in morphological identification (Miller & Foottit, Reference Miller, Foottit, Foottit and Adler2009). Aphids have complex lifecycles involving parthenogeneticity and high polymorphisms, and within a single species, there are different morphs with distinct morphological characters, which may colonize different host plants, further complicating species identification (Foottit et al., Reference Foottit, Maw, Von Dohlen and Hebert2008). Additionally, aphids are prone to morphological plasticity due to environmental and host plant effects making identification very difficult (Miller & Foottit, Reference Miller, Foottit, Foottit and Adler2009). Moreover, identification of immature stages, cryptic species and damaged specimens by morphological means is problematic due to the absence of key morphological characteristics (Armstrong & Ball, Reference Armstrong and Ball2005; Lee et al., Reference Lee, Kim, Lim, Choi, Kim, Kim, Ji, Foottit and Lee2011). Usually, closely related species with similar morphological characteristics have been identified on the basis of their host plants association (Coeur d'acier et al., Reference Coeur d'acier, Cruaud, Artige, Genson, Clamens, Pierre, Hudaverdian, Simon, Jousselin and Rasplus2014), which is again complicated by the polyphagous species. The recognition of these difficulties has signalled the need for novel detection methods to supplement morphology.
Several molecular techniques have been explored to assist in aphid species identification and overcome the limitations of morphological identifications. Polymerase chain reaction-restriction fragment length polymorphism (PCR-RFLP) is based on digestion of PCR amplicons with appropriate restriction enzymes to produce distinct polymorphic fragments, visualized as markers for species identification. Several studies have utilized PCR-RFLP for species identification of various pests of economic importance (Armstrong et al., Reference Armstrong, Cameron and Frampton1997; Brunner et al., Reference Brunner, Fleming and Frey2002; Masahiro et al., Reference Masahiro, Kotsubo, Tajima and Hinomoto2008). In the family Aphididae, RFLPs have also been used to distinguish several aphid species (Raboudi et al., Reference Raboudi, Marrakchi and Makni2002; Valenzuela et al., Reference Valenzuela, Hoffmann, Malipatil, Ridland and Weeks2007, Reference Valenzuela, Eastop, Ridland and Weeks2009).
Increasingly, DNA barcoding is being widely employed due to its accuracy in species identification and delineation. DNA barcoding is based on the principle that a short standardized DNA sequence can characterize species in a myriad of taxonomic groups in the animal kingdom (Hebert & Gregory, Reference Hebert and Gregory2005). The 5′ end of mitochondrial cytochrome c oxidase subunit I (COI) gene has been adopted as the global barcoding gene (Hebert et al., Reference Hebert, Cywinska, Ball and deWaard2003a ), and has demonstrated effectiveness in identification of most pest species of economic importance (Armstrong & Ball, Reference Armstrong and Ball2005; Ball & Armstrong, Reference Ball and Armstrong2006; Khamis et al., Reference Khamis, Masiga, Mohamed, Salifu, de Meyer and Ekesi2012). In the family Aphididae, not only has DNA barcoding facilitated species identification (Foottit et al., Reference Foottit, Maw, Von Dohlen and Hebert2008; Kim et al., Reference Kim, Hoelmer, Lee, Kwon and Lee2010; Lee et al., Reference Lee, Kim, Lim, Choi, Kim, Kim, Ji, Foottit and Lee2011; Wang et al., Reference Wang, Jiang and Qiao2011; Coeur d'acier et al., Reference Coeur d'acier, Cruaud, Artige, Genson, Clamens, Pierre, Hudaverdian, Simon, Jousselin and Rasplus2014), but has also proved as a potential tool in pest management by identifying aphids at any stage of their lifecycle; adult, nymphal, larval, and the various morphs within a species; colour morphs, winged and wingless morphs (Foottit et al., Reference Foottit, Maw and Pike2009). Furthermore, DNA barcoding has enabled identification of cryptic species and discovery of new aphid species (Foottit et al., Reference Foottit, Maw and Pike2009; Rebijith et al., Reference Rebijith, Asokan, Krishna, Kumar and Ramamurthy2012).
In tropical Africa, the melon/cotton aphid, Aphis gossypii Glover (reported from 40 countries in Africa) is one of the most important pests of vegetables in the continent. For example in Kenya, yield losses due to insect pest problems on okra in Nguruman and Muhaka (for which A. gossypii is regarded as among the key pests) was estimated at 24–40 and 15–24%, respectively (Sithanantham et al., Reference Sithanantham, Nyarko, Ogutu, Chongoti, Kibata, Ouko, Mukindia, Agong, Seif and Loehr1998). A. gossypii can transmit more than 50 plant viruses causing symptoms that impair vegetable quality and yield but the true impact on crop losses have not been quantified. Two less polyphagous aphids, the cabbage aphid Brevycorine brassicae (L.) – restricted to mid- and high-altitude agro-ecologies, and the turnip aphid Lipaphis pseudobrassicae Davis – restricted to lowland agro-ecologies, are found largely on cruciferous plants of which cabbage and kale are the most affected (Nyambo & Löhr, Reference Nyambo, Löhr and Hoddle2005; Sæthre et al., Reference Sæthre, Godonou, Hofsvang, Tepa-Yotto and James2011). The cabbage aphid is most widely distributed (22 countries in Africa) and is known to transmit 23 plant viruses, of which Cauliflower mosaic virus (CaMV) and Turnip mosaic virus (TuMV) are known to occur in tropical Africa and can cause substantial reduction in cabbage production (Spence et al., Reference Spence, Phiri, Hughes, Mwaniki, Simons, Oduor, Chacha, Kuria, Ndirangu, Kibata and Marris2007).
One of the most important pests of cowpea is Aphis craccivora Koch. Infestation by this aphid species can result in yield losses of up to 35% (Singh & Allen, Reference Singh, Allen, Summerfield and Bunting1980) and in extreme cases in complete crop failure (Ansari et al., Reference Ansari, van Emden and Singh1992). Apart from direct feeding damage, A. craccivora also vectors the cowpea aphid-borne mosaic virus (Bock & Conti, Reference Bock and Conti1974). The black bean aphid, Aphis fabae Scopoli is a significant insect pest of common beans in tropical Africa and particularly in the higher altitudes regions (Karel & Autrique, Reference Karel, Autrique, Schwartz and Pastor-Corrales1989). A. fabae is very polyphagous, causing direct physical damages on a wide range of agricultural crops and an important vector of over 30 plant viruses including the bean common mosaic virus (Emden & Harrington, Reference Emden and Harrington2007).
No molecular identification tools have been developed to separate these aphid species in Kenya and Africa at large. The current study was undertaken to identify a rapid tool for separation of aphid species collected from different agro-ecological zones of Kenya. Emphasis was placed on the aphid species listed above but additional aphid species including Myzus persicae Sulzer and Acyrthosiphon pisum Harris which are equally damaging to various crops were also added to the investigation. The overall goal is to avail tools that will contribute to timely and accurate identification of these pests, which should in turn facilitate quicker and effective implementation of pest management and strengthening of the quarantine systems in countries affected by the aphid species.
Materials and methods
Sample collection and processing
Adult aphids and late instar nymphs were collected from various agro-ecological zones of Kenya (fig. 1), preserved in 95% ethanol and brought to the laboratory for processing. Aphids were collected from the leaves of their host plants using a camel brush. Twenty samples from each site were randomly selected, identified and photographed dorsally, laterally and ventrally at x25 with a Leica LAS EZ4D stereo microscope with an integral digital camera (Leica Microsystems Limited, Switzerland) before DNA extraction. Voucher specimens from each collection are deposited at Arthropod pathology unit molecular laboratory in the International Centre of Insect Physiology and Ecology (icipe).
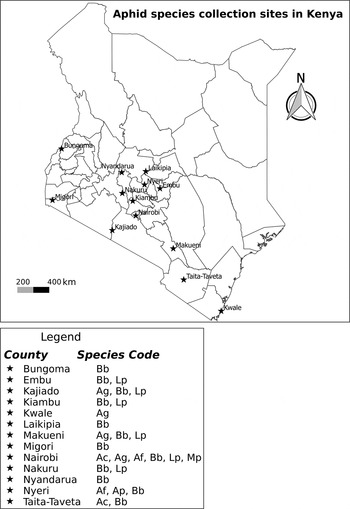
Fig. 1. Map of Kenya showing the sampling sites for aphid species between February and September 2013. Ac, Aphis craccivora; Af, Aphis fabae; Ag, Aphis gossypii, Ap, Acyrthosiphon pisum; Bb, Brevicoryne brassicae; Lp, Lipaphis pseudobrassicae and Mp, Myzus persicae.
DNA extraction
Each individual photographed sample was surface-sterilized using 3% bleach and rinsed three times with distilled water. Genomic DNA was extracted using proteinase K buffer extraction protocol. Each aphid sample was put into a sterile 1.5 ml Eppendorf tube and 100 µl 1 × proteinase K buffer (10 × proteinase K buffer composed of 25 mM KCl, 10 Mm Tris-HCl at pH 9.0 at 25°C and 10 mM Triton X-100) and 0.5 µl of 20 mg ml−1 proteinase K (Thermo Scientific, USA) were added. The sample was homogenized using a sterile pestle and incubated overnight at 37°C in a water bath. The homogenate was then heated at 95°C in a water bath for 5 min to inactivate proteinase K. The sample was centrifuged at 15,000 g for 5 min and 40 µl of supernatant was aliquoted into a sterile Eppendorf tube. The extracted DNA was then stored at −20°C for downstream processes.
PCR-RFLP
A 1540 bp region of mitochondrial COI gene was amplified by PCR using the primers A-pissum Fwd TCAACTAATCATAAAGATATTGGAA and A-pissum Rv TATAAATGAATTTTAAGTTC. The primers were generated from a sequence that was retrieved from a complete genome of mitochondrion of Acyrthosiphon pisum Harris in the National Center for Biotechnology Information (NCBI) database (FJ411411.1), using sequence manipulation suite software and were tested in silico for their ability to amplify the different species under study. The primers were synthesized at a commercial facility (Macrogen Inc., Europe). PCR was carried out in a 20 µl volume containing 5 × My Taq Reaction Buffer (Bioline, London, UK) composed of 5 mM dNTPs, 15 mM MgCl2, stabilizers and enhancers, 10 µM of each primer, 1.25 mM MgCl2, 6.25 units My Taq DNA polymerase (Bioline, London, UK) and 15 ng µl−1 of DNA template. PCR thermo cycling conditions of 1 min at 95°C, followed by 35 cycles of 15 s at 95°C, 1 min at annealing temperature of 49.1°C and 1 min at 72°C, then a final elongation step of 10 min at 72°C were used. The reaction was set up in Arktik thermal cycler (Thermo Fisher Scientific Inc., USA). Amplified products were analyzed by electrophoresis on 1% agarose gel with ethidium bromide and O’ Gene Ruler 1 kb Plus DNA ladder (Thermo Fisher Scientific Inc., USA) incorporated. The program NEB cutter V2.0 (New England BioLabs Inc., MA, USA) (http://tools.neb.com/NEBcutter2/index.php) was used to predict the potential restriction sites. Three restriction enzymes; RsaI, AluI and HinfI were selected based on the size of the resulting fragments and the ability to distinguish the species studied. Restriction digest was done in 18 µl volume containing 10 µl nuclease-free water, 2 µl fast digest buffer (Thermo Fisher Scientific Inc., USA), 1 µl restriction enzyme and 5 µl PCR product. PCR products were digested separately and incubation conditions of 37°C for 14 h, enzyme inactivation at 65°C for 5 min and a hold temperature of 10°C were used. Restriction products were resolved through a 2% agarose gel with O’ Gene Ruler 1 kb Plus and 100 bp DNA ladders (Thermo Fisher Scientific Inc., USA). Electrophoresis was set at 70 V for 90 min, followed by visualization of DNA under ultraviolet (UV) transilluminator in a KETA gel documentation imaging system (Wealtec Corp., Nevada, USA).
DNA barcode region amplification and sequencing
PCR was carried out using universal primers, LCO 1490 5′-GGTCAACAAATCATAAAGATATTGG-3′ and HCO 2198 5′-TAAACTTCAGGGTGACCAAAAAATCA-3′ (Folmer et al., Reference Folmer, Black, Hoeh, Lutz and Vrijenhoek1994) to amplify an approximately 680 bp fragment of the COI gene. Amplification was carried out in a 20 µl volume containing 5 × My Taq Reaction Buffer (Bioline, London, UK) composed of 5 mM dNTPs, 15 mM MgCl2, stabilizers and enhancers, 10 µM of each primer, 1.25 mM MgCl2, 6.25 units My Taq DNA polymerase (Bioline, London, UK) and 15 ng µl−1 of DNA template. PCR thermo cycling conditions of 1 min at 95°C, then 35 cycles of 15 s at 95°C, 1 min at annealing temperature of 48.3°C and 1 min at 72°C, followed by a final elongation step of 10 min at 72°C were used. The reaction was set up in Arktik thermal cycler (Thermo Fisher Scientific Inc., USA). Amplified PCR products were resolved through a 1% agarose gel. Electrophoresis was set at 100 volts for 1 h, followed by visualization of DNA under UV-illumination in a KETA gel documentation imaging system (Wealtec Corp., Nevada, USA). PCR products were purified using Isolate II PCR and Gel Kit (Bioline, London, UK) according to the manufacturer's instructions. Purified DNA samples were bi-directionally sequenced using ABI 3730xl DNA sequencer (Applied Biosystems, Foster City, California) at a commercial sequencing facility (Macrogen Inc., Europe).
Data analysis
Sequences were assembled and edited using Chromas v2.1.1 (Technelysium Pty Ltd, Queensland, Australia). For conclusive identifications, sequences were queried via basic local alignment search tool (BLAST) at the GenBank database hosted by NCBI (http://www.ncbi.nlm.nih.gov/). Megablast (for highly similar sequences) program was used for all the sequences. Alignment was done using MUSCLE v3.8.31 (Edgar, Reference Edgar2004). Unaligned sequence ends were trimmed and gaps removed in Jalview v2.8.2 (Waterhouse et al., Reference Waterhouse, Procter, Martin, Clamp and Barton2009). The program jModeltest v2.1.7 (Darriba et al., Reference Darriba, Taboada, Doallo and Posada2012) was used to determine the appropriate substitution model for phylogenetic analyses. The best-fit model TIM1 + G was selected by the four different criteria (AIC, AICc, BIC and DT). Maximum likelihood (ML) estimates were obtained using the TIM1 + G model under a general time reversible GTRGAMMA substitution model with 1000 bootstrap replicates in RAxML v8.2.0 (Stamatakis, Reference Stamatakis2014). Generated trees were viewed and edited in Fig Tree v1.4.2 (http://tree.bio.ed.ac.uk/software/figtree). Genetic divergences were determined at the species, genus and family levels using pairwise distance model as generated by the distance summary tool available in Barcode of Life Data systems (BOLD) (http://www.boldsystems.org/). Evolutionary divergence over sequence pairs between groups were estimated using the p-distance model in MEGA 6.0 (Tamura et al., Reference Tamura, Stecher, Peterson, Filipski and Kumar2013). To further infer relationships among the aphid species, principal component analysis (PCA) was conducted. A table of genetic distances generated by MEGA 6.0 (Tamura et al., Reference Tamura, Stecher, Peterson, Filipski and Kumar2013) was used to create principal component plots using GenAlEx 6.41 (Peakall & Smouse, Reference Peakall and Smouse2006). The program DnaSP 5.0 (Librado & Rozas, Reference Librado and Rozas2009) was used to analyze DNA polymorphism in the nucleotide sequences within and between populations. In this program, DNA sequence variation generated a haplotype file which was used to construct a phylogenetic network using the haplotype median-joining algorithm in Network 4.6.1.1 (Fluxus Technology Ltd, Suffolk, England). Finally, COI sequences were submitted to the BOLD database and deposited in GenBank (Accession numbers are found in table 1).
Table 1. Collection data of aphid samples collected from different agro-ecological zones of Kenya with species name, host plant, global positioning system (GPS) coordinates of the sampling locations and GenBank accession numbers.

Samples were collected from February to September 2013. Sample name corresponds to the name of the species as used during the experiments and analysis.
Results
PCR-RFLP
In silico restrictions predicted a specific profile for each species except A craccivora and A. fabae. These predictions were checked on several aphid species collected from different agro-ecological zones of Kenya. Amplified 1540 bp fragment (fig. 2) was subjected to restriction digests and the products ranged from 1000 to less than 75 bp. Fragments less than 100 bp were not considered as diagnostic. Restriction profiles exhibited by these enzymes corresponded to in silico predictions. RsaI yielded fragments of 500 and 1000 bp in A. gossypii, M. persicae, B. brassicae and A. pisum and therefore, failed to differentiate the four species. RsaI also ruled out L. pseudobrassicae, A. craccivora and A. fabae (fig. 3).

Fig. 2. PCR products of 1500 bp fragment amplified from genomic DNA of aphid species on a 1% agarose gel. M1: O’ Gene Ruler 1 kb Plus DNA ladder, Lane 1: Aphis gossypii, Lane 2: Myzus persicae, Lane 3: Lipaphis pseudobrassicae, Lane 4: Brevicoryne brassicae, Lane 5: Acyrthosiphon pisum, Lane 6: Aphis craccivora, Lane 7: Aphis fabae, Lane 8: Aphis fabae and Lane 9: Negative control.

Fig. 3. PCR-RFLP analysis of aphid species on a 2% agarose gel. DNA was digested with RsaI. M1: O’ Gene Ruler 1 kb Plus DNA ladder, Lane 1: Aphis gossypii, Lane 2: Myzus persicae, Lane 3: Lipaphis pseudobrassicae, Lane 4: Brevicoryne brassicae, Lane 5: Acyrthosiphon pisum, Lane 6: Aphis craccivora, Lane 7: Aphis fabae, Lane 8: Aphis fabae and M2: O’ Gene Ruler 100 bp DNA ladder.
AluI digestion profile gave informative results for A. gossypii and A. pisum and allowed accurate discrimination of the two species (fig. 4). AluI yielded fragments of 150, 250, 450 and 550 bp in A. gossypii whereas fragments in A. pisum were 150, 350, 400 and 500 bp. AluI also provided a clear distinction between M. persicae and L. pseudobrassicae and B. brassicae. AluI yielded fragments of 150, 300, 500 and 600 bp in M. persicae and fragments of 150, 250, 500 and 600 bp in L. pseudobrassicae and B. brassicae. Finally, AluI digestion yielded fragments of 250, 500 and 700 bp in A. craccivora and A. fabae and could not therefore discriminate between the two species.

Fig. 4. PCR-RFLP analysis of aphid species on a 2% agarose gel. DNA was digested with AluI. M1: O’ Gene Ruler 1 kb Plus DNA ladder, Lane 1: Aphis gossypii, Lane 2: Myzus persicae, Lane 3: Lipaphis pseudobrassicae Lane 4: Brevicoryne brassicae, Lane 5: Acyrthosiphon pisum, Lane 6: Aphis craccivora, Lane 7: Aphis fabae, Lane 8: Aphis fabae and M2: O’ Gene Ruler 100 bp DNA ladder.
Digestion with HinfI allowed effective differentiation of five of the species studied (fig. 5). HinfI digestion of A. gossypii resulted in fragments of 300, 450 and 600 bp, while those of M. persicae were 100, 200, 300 and 1000 bp. HinfI fragments of L. pseudobrassicae were 250, 400 and 500 bp, whereas those of B. brassicae were 300, 400 and 1250 bp. HinfI digestion of A. pisum yielded fragments of 200, 500 and 700 bp. However, it was quite a challenge to distinguish between the cowpea specialist A. craccivora and the bean specialist A. fabae because they yielded fragments of equal sizes (250, 400 and 1000 bp) upon digestion with HinfI enzyme.

Fig. 5. PCR-RFLP analysis of aphid species on a 2% agarose gel. DNA was digested with HinfI. M1: O’ Gene Ruler 1 kb Plus DNA ladder, Lane 1: Aphis gossypii, Lane 2: Myzus persicae, Lane 3: Lipaphis pseudobrassicae Lane 4: Brevicoryne brassicae, Lane 5: Acyrthosiphon pisum, Lane 6: Aphis craccivora, Lane 7: Aphis fabae, Lane 8: Aphis fabae and M2: O’ Gene Ruler 100 bp DNA ladder.
Barcode data analyses
COI sequences were generated for 175 aphid samples collected across Kenya. BLAST hits between our sequence dataset and those from the NCBI Genbank database ranged from 95 to 100%. Genetic sequence divergences were analyzed at the species, genus and family level, and as expected genetic divergences increased with higher taxonomic levels. Sequence divergence within species ranged from 0 to 1.04% with an average of 0.08% (table 2) and all species displayed intraspecific genetic distances of less than 2%. Mean sequence divergence between species of the same genus was 6.63%, with a range of 5.67–7.91% and comparison of all species pair revealed that all species showed genetic distances greater than 2%. The sequence divergence between different genera of the same family ranged from 5.01 to 9.89% with a mean of 6.90%. Less interspecific divergences were found between L. pseudobrassicae and B. brassicae (0.052) whereas M. persicae and A. craccivora were the most genetically divergent species (0.098) (table 3). Mean nucleotide frequencies were T = 0.4377, A = 0.3440, C = 0.1149 and G = 0.1035, with a bias towards thymine and adenine composition and no stop codons were observed within the sequences. Negative log likelihood was 1751.1144 and ML estimate of the gamma shape parameter was 0.0820.
Table 2. Genetic sequence divergence of mitochondrial COI gene region between different taxonomic levels of Aphididae with minimum (min), maximum (max), mean and standard error (SE) distance values as determined using pairwise distance model.

Table 3. Estimates of evolutionary divergence of mitochondrial COI gene region over sequence pairs between groups as determined using p-distance model in Mega 6.0 (Tamura et al., Reference Tamura, Stecher, Peterson, Filipski and Kumar2013).

Ag, Aphis gossypii; Ac, Aphis craccivora; Af, Aphis fabae; Bb, Brevicoryne brassicae; Lp, Lipaphis pseudobrassicae; Ap, Acyrthosiphon pisum and Mp, Myzus persicae. Numbers in bold indicate the lowest (Lp and Bb) and the highest (Mp and Ac) values between the species.
Phylogenetic analyses
The phylogenetic tree was generated from 175 samples belonging to different species and populations. The tree separated into two major groups that were supported by high bootstrap values of 92% (fig. 6). The first group had the clustering of Aphis species, in which A. gossypii formed a sister group with strong support of 92% bootstrap value with the cluster containing the two clades of A. craccivora and A. fabae. The second group had the clustering of four species with robust support of 100% bootstrap values. L. pseudobrassicae and B. brassicae branched from the same node, whereas M. persicae formed a clade with A. pisum. Aphid samples of B. brassicae were collected from 18 different regions, some from cabbages and others from kales (Brassicaceae) (table 1). It was noted that these populations clustered together irrespective of their host plants and geographic origins. This clustering was also evident in L. pseudobrassicae, A. gossypii and A. craccivora and could suggest the existence of the same populations within a species. However, samples of A. fabae were clustered into two clades based on their host plants.

Fig. 6. Maximum likelihood tree inferred from COI sequences of 175 samples using TIM1 + G model of molecular evolution (-lnL = 1751.1144 and gamma shape = 0.0820) under GTRGAMMA model for seven aphid species. Support values designated at the nodes (next to the branches) represent percentage bootstrap values after 1000 replications. Bootstrap values less than 50% are not indicated. The tree was drawn to scale, and the branch lengths are denoted by the rate of substitution per nucleotide position.
The PCA clearly separated the seven species into distinct clusters (fig. 7). The cluster belonging to B. brassicae was shown to be much closer to the cluster consisting of L. pseudobrassicae than it was to the cluster consisting of A. pisum. Consistently, the PCA results revealed a close relationship between A. fabae, A. craccivora and A. gossypii. Haplotype network patterns further confirmed the previous results by positioning the species into distinct nodes (fig. 8). Aphis craccivora and A. fabae diverged from the same median vector, suggesting a close relationship between these species. Moreover, A. craccivora, A. fabae and A. gossypii were found to be related as they all split from a common median vector. The two sub groups of A. fabae were distinctly clustered, confirming the results obtained from the phylogenetic tree. Also, a close relationship was confirmed between B. brassicae and L. pseudobrassicae, whose median vectors split from a common median vector. Finally, it was observed that A. pisum and M. persicae formed separate clusters which were derived from the central median vectors independently.

Fig. 7. Plots of the principal component analysis (PCA) for seven aphid species calculated using GenAlEx. The first and second principal components were 25.91 and 21.28, respectively.

Fig. 8. Phylogenetic network showing evolutionary relationships among seven aphid species. Eight distinct haplotypes were detected with a haplotype diversity, Hd = 0.6822. All sites containing gaps and missing data were excluded and the number of variable sites was 122. There were a total of 650 sites in the final dataset. The black full nodes represent the sampled sequences and the size of each node is proportional to the corresponding haplotype (sequence) frequency. The small empty nodes represent the median vectors. The size of the branch is proportional to the number of mutations that occurred.
Discussion
In this study, RFLPs were first developed from the COI region to detect sequence variation among seven aphid species and based on the results B. brassicae, L. pseudobrassicae, A. pisum, M. persicae and A. gossypii were distinguished successfully. A single restriction enzyme was not sufficient to distinguish the species and therefore, three restriction enzymes were combined to produce a profile that could serve as a molecular diagnostic key for species identification. A similar study by Valenzuela et al. (Reference Valenzuela, Hoffmann, Malipatil, Ridland and Weeks2007) demonstrated the utility of restriction analysis of PCR-amplified COI region for the identification of immature stages of 25 aphid species. Similarly, the technique has been used to separate four Rhopalosiphum Koch species (Yeh et al., Reference Yeh, Ko, Hsu and Shih2005) and differentiate between aphid haplotypes (Raboudi et al., Reference Raboudi, Marrakchi and Makni2002; Shufran, Reference Shufran2003). PCR-RFLP provides a simple, fast and cost effective diagnostic tool for aphid species identification. It is a relatively sound technique that could be beneficial in low budget situations. It is also applicable in situations where there may be no access to sequence analysis software and skills to analyze sequence data. However, RFLPs depends on a few informative DNA sequence positions and thus, only a fraction of sequence variations is detected (Brunner et al., Reference Brunner, Fleming and Frey2002). For example, A. craccivora and A. fabae could not be distinguished and the two subgroups of A. fabae could not be separated. In addition, RFLPs depends on the selection of specific restriction enzymes that require previous knowledge of the samples to be analyzed.
In DNA barcoding, sequences were retrieved from 175 aphid samples collected from different agro-ecological zones of Kenya. COI sequences gave a high resolution of all species and two subgroups of A. fabae. These results are consistent with previous studies carried out in Europe, North America, Korea and India that demonstrated DNA barcoding based on COI gene as a potentially useful tool for identification of species within Aphididae (Foottit et al., Reference Foottit, Maw, Von Dohlen and Hebert2008; Lee et al., Reference Lee, Kim, Lim, Choi, Kim, Kim, Ji, Foottit and Lee2011; Rebijith et al., Reference Rebijith, Asokan, Kumar, Krishna, Chaitanya and Ramamurthy2013; Coeur d'acier et al., Reference Coeur d'acier, Cruaud, Artige, Genson, Clamens, Pierre, Hudaverdian, Simon, Jousselin and Rasplus2014). Also, by providing quantitative data with sequence divergence and bootstrap values as a measure of reliability (Armstrong & Ball, Reference Armstrong and Ball2005), DNA barcoding presented a more accurate and robust approach towards separation of the aphid species and defining their identity as compared with PCR-RFLPs. Virgilio et al. (Reference Virgilio, Backeljau, Nevado and Meyer2010) reported that intraspecific sequence divergences of DNA barcodes belonging to 1995 insect species ranged from 0.0 to 7.64% and aphids were reported to lie at the lower ranges. In our study, the mean intraspecific sequence divergence obtained was as low as 0.08% and is therefore within the ranges reported by previous authors. COI sequence divergences among species can vary among different groups of animals ranging from 0.0 to 53.7% among 13,320 species pairs (Hebert et al., Reference Hebert, Ratnasingham and deWaard2003b ). In our study, the mean interspecific sequence divergence was 6.63%, and significantly greater than the mean intraspecific divergence. This created a substantial barcode gap that enabled accurate discrimination of all the species. Our results are within the expected limits and fall within the range of variation exhibited in previous studies within Aphididae (Foottit et al., Reference Foottit, Maw, Von Dohlen and Hebert2008, Reference Foottit, Maw and Pike2009; Lee et al., Reference Lee, Kim, Lim, Choi, Kim, Kim, Ji, Foottit and Lee2011; Wang et al., Reference Wang, Jiang and Qiao2011) and demonstrate that COI DNA barcode region is a reliable marker for separating aphid species. Clustering of species on the phylogenetic tree was in accordance with the results obtained from the PCA plot and phylogenetic network. Moreover, the close relationship between B. brassicae and L. pseudobrassicae and between A. gossypii, A. craccivora and A. fabae was confirmed.
Clades belonging to B. brassicae, L. pseudobrassicae, A. craccivora and A. gossypii consisted of populations collected from various agro-ecological zones of the country. COI sequences revealed that no genetic variation existed between populations belonging to the same species, despite different geographical locations as they were all grouped together within a cluster. Genetic uniformity was also observed among populations of B. brassicae collected from kales and cabbages. These results concur with previous studies on aphid species in the family Lamiaceae and Brachycaudus helichrysi Kaltenbach, where the clustering of populations was not related to their geographic locations (Piffaretti et al., Reference Piffaretti, Vanlerberghe-Masutti, Tayeh, Clamens, Cœur d'Acier and Jousselin2012; Cocuzza & Cavalieri, Reference Cocuzza and Cavalieri2014). Genetic uniformity has also been observed in the genus Hyalopterus Koch, where populations of each species clustered together irrespective of the widespread geographical sampling (Lozier et al., Reference Lozier, Foottit, Miller, Mills and Roderick2008). Similarly, COI sequences belonging to A. gossypii and M. persicae, which are both cosmopolitan and highly polyphagous species, revealed that there was no significant genetic variation among populations collected from different geographical locations and different host plants (Rebijith et al., Reference Rebijith, Asokan, Krishna, Kumar and Ramamurthy2012).
The great morphological similarity between A. craccivora and A. fabae makes it very difficult to separate them based on morphological characters. However, previous studies have presented DNA barcoding as a very useful tool in separation of the two species (Coeur d'acier et al., Reference Coeur d'acier, Jousselin, Martin and Rasplus2007; Lee et al., Reference Lee, Kim, Lim, Choi, Kim, Kim, Ji, Foottit and Lee2011). In the current study, not only were the species identified, but DNA barcoding was able to reveal that both aphids are sister species in a clade that also formed a sister group relationship with A. gossypii. This relationship is also evident in the PCA plot and the median joining haplotype network, where the three species formed neighbouring clusters. The study also distinctly separated two subgroups of A. fabae collected from black night shade (Solanum nigrum L.) and rose coco beans (Phaseolus vulgaris L.). All sequences of A. fabae displayed very high BLAST hits between 98 and 100% with a Genbank sequence assigned to the same species. However, these results could not separate the two subgroups and only tended to be diagnostic at the species level. It has been reported that A. fabae species constitutes a complex of six morphologically inseparable subspecies, whose identification is based on host plants affiliations (Zhang et al., Reference Zhang, Huang, Jiang and Qiao2010). Our results are in agreement with previous studies on Aphis species that distinctly clustered A. fabae into four highly supported subspecies (Coeur d'acier et al., Reference Coeur d'acier, Jousselin, Martin and Rasplus2007). The results were further confirmed by the phylogenetic network, which positioned the two subgroups as distinct haplotypes with a very close relationship.
Complex life cycles of aphids associated with parthenogeneticity and polymorphism including colour morphs, winged, unwinged, sexual and asexual morphs is a common trait among aphids (Foottit et al., Reference Foottit, Maw, Von Dohlen and Hebert2008). In our study, no genetic variation was observed in the DNA sequences obtained from samples of the yellow and black morphs of A. gossypii. Based on these results, we conclude that morphological variations that occur among species populations in response to environmental factors and host plant effects are not reflected in their genetic makeup. The immature stages of the various aphid species must be reared to adult stages to allow for morphological identification – a process that is laborious and time consuming. The current study have shown that both RFLPs and DNA barcoding could be used reliably for the identification of immature stages, different morphs and various life stages within a species (Valenzuela et al., Reference Valenzuela, Hoffmann, Malipatil, Ridland and Weeks2007; Foottit et al., Reference Foottit, Maw and Pike2009; Shufran & Puterka, Reference Shufran and Puterka2011).
RFLP markers were developed for the identification of five aphid species, which are among the most damaging pest of vegetables in Kenya. However, the restriction enzymes used in the study could not separate A. craccivora and A. fabae. Our DNA barcoding results contribute to the growing database of DNA barcodes of aphid species of the world. Nevertheless, extensive sampling is needed in future studies to generate a more comprehensive barcode database for aphids attacking crops in Kenya. Additional work is also necessary to investigate the occurrence of A. fabae subspecies on the basis of their host plants. Overall, the study has presented both PCR-RFLP and DNA barcoding as diagnostic tools to distinguish among Aphididae species. With the availability of quick and accurate identification tools, monitoring and detection of potentially invasive species could be heightened, facilitating successful pest management strategies and contributing to effective phytosanitary management systems in Kenya and beyond.
Acknowledgements
The study was funded by the Swedish International Development Cooperation Agency (SIDA) through icipe's dissertation research internship programme (DRIP) for MSc. We are grateful to Peterson Nderitu, Sarine Adhiambo, Valentina Migani, Jane Gathage and Chris Barak for assisting in aphid samples collection.


