


Introduction
Helicoverpa armigera Hübner (Lepidoptera: Noctuidae) is a major old world agricultural pest of cotton and vegetable crops (Fitt, Reference Fitt1989). In Australia, Scott et al. (Reference Scott, Lange, Scott and Graham2004) developed microsatellites for H. armigera and used these to test for genetic structure among H. armigera populations from multiple locations in several states. Strong structure was found to exist among locations (Scott et al., Reference Scott, Wilkinson, Merritt, Scott, Lange, Schutze, Kent, Merritt, Grundy and Graham2003, Reference Scott, Lawrence, Lange, Scott, Wilkinson, Merritt, Miles, Murray and Graham2005a,Reference Scott, Wilkinson, Lawrence, Lange, Scott, Merritt, Lowe and Grahamb) and crops (Scott et al., Reference Scott, Lawrence, Lange, Graham, Hardwick, Rossiter, Dillon and Scott2006) although genetic differences were not always found. This was thought to reflect movement patterns of the moth, with localised structure in some years and extensive movement in others.
These findings have implications for pest control and the evolution of resistance to pesticides and toxins in genetically modified crops. Genetic structure implies that the suppression of moth populations in one region or crop might occur independently of suppression in other genetically distinct regions, and spread of resistance alleles should be less likely across populations that are distinct genetically. Scott et al. (Reference Scott, Lawrence, Lange, Scott, Wilkinson, Merritt, Miles, Murray and Graham2005a) proposed that genetic markers can even be used to define the geographic origin of moths and assist in targeted control programs at a local and regional level.
However, other researchers have failed to find genetic structure among Australian H. armigera populations. Both allozyme (Daly & Gregg, Reference Daly and Gregg1985) and mitochondrial (Spackman & McKechnie, Reference Spackman and McKechnie1995) data suggest high levels of gene flow among populations. Moreover, Endersby et al. (Reference Endersby, Hoffmann, McKechnie and Weeks2007) found no genetic differences among H. armigera populations from Australian locations when characterized with microsatellites. Microsatellite markers can be particularly problematic in lepidopteran species because of a high level of redundancy and a very low frequency of single copy loci (Zhang, Reference Zhang2004).
Endersby et al. (Reference Endersby, Hoffmann, McKechnie and Weeks2007) suggested several reasons for the lack of consistency among studies. These included problems in scoring alleles, the presence of null alleles and moth sampling issues. Here, we test problems with allele scoring by characterizing microsatellite variation in two sets of moths with both the manual scoring system of Endersby et al. (Reference Endersby, Hoffmann, McKechnie and Weeks2007) and the automated scoring system of Scott et al. (Reference Scott, Wilkinson, Merritt, Scott, Lange, Schutze, Kent, Merritt, Grundy and Graham2003). We show that allele scoring rather than null alleles or other factors are likely to account for differences between the studies and find no evidence for geographic differences between samples when markers are scored manually.
Methods
Four microsatellite loci developed by Ji et al. (Reference Ji, Zhang, Hewitt, Kang and Li2003) (HarSSR1, HarSSR2, HarSSR3 and HarSSR4) and four microsatellite loci developed by Scott et al. (Reference Scott, Lange, Scott and Graham2004) (HaB60, HaC14, HaC87 and HaD47) were used to screen 100 specimens of H. armigera from the study by Endersby et al. (Reference Endersby, Hoffmann, McKechnie and Weeks2007) and 100 specimens derived from samples collected at the same time as those in Scott et al. (Reference Scott, Lange, Scott and Graham2004) (table 1). Both sets of samples were screened by the Centre for Environmental Stress and Adaptation Research (CESAR) laboratory at the University of Melbourne, Victoria, Australia and at the School of Integrative Biology, the University of Queensland (UQ), Queensland, Australia.
Table 1. Origin of samples of Helicoverpa armigera genotyped at eight microsatellite markers by the CESAR and UQ laboratories.

The UQ genomic DNA samples were extracted with a modified salting out protocol developed by Miller et al. (Reference Miller, Dykes and Polesky1988), and DNA aliquots were diluted 1:20 for Polymerase Chain Reactions (PCR). UQ and CESAR DNA samples were first confirmed as H. armigera DNA using the internal transcribed spacer (ITS) PCR confirmation assay (Amornsak et al., Reference Amornsak, Gordh and Graham1998). All positive samples were then screened for the eight microsatellite loci in a final volume of 10 μl containing: 1× PCR Buffer (Fisher Biotech, Wembley, WA, Australia), 2 mM MgCl2, 0.5 mM dNTPs (Fisher Biotech, Wembley, WA, Australia), 0.5 μM forward (Hex labelled) and reverse primer, 0.5 units Taq F1 DNA Polymerase (Fisher Biotech, Wembley, WA, Australia), and the final volume was adjusted with sterile water to a volume of 10 μl. For loci HarSSR1, HarSSR2, HarSSR3, HarSSR4 and HaB60, 5 μg of Bovine Serum Albumin (BSA, New England Biolabs, Ipswich, MA, USA) was also added to the PCR mix. PCR cycling conditions were: denaturation (4 min, 94°C), 35 cycles of 94°C (30 s), annealing (30 s) (59°C: HarSSR1, HarSSR3 and HarSSR4; 53°C: HarSSR2; 50°C: HaB60, HaC87, HaC14 and HaD47), and 72°C (45 s), with final extension at 72°C (5 min). PCRs were performed using a Palm Cycler (Corbett Research, Mortlake, NSW, Australia). Microsatellite PCR fragments and Genescan-500 (Tamra) standards (Applied Biosystems, California, USA) were separated electrophoretically on 5% non-denaturing polyacrylamide 0.1 mm thick gels (native gels) and digitally captured using the GS2000 Genetic Analyser (Corbett Research, Mortlake, NSW, Australia) at 1200V and 40°C. All microsatellite alleles were each examined and sized with ONE-Dscan V2.05 (Scanalytics, Fairfax, VA, USA).
At CESAR, amplification of microsatellites by PCR took place in a volume of 10 μl with 2 μl of genomic DNA extracted using a Chelex® 100 Resin (BioRad, Hercules, CA) method (Endersby et al., Reference Endersby, McKechnie, Vogel, Gahan, Baxter, Ridland and Weeks2005). Primer concentrations of 0.03 μM (forward primer end-labelled with [γ33P]-ATP), 0.1 μM (unlabelled forward primer) and 0.4 μM (reverse primer) were used. The PCR reagent mix contained 2.0 mM MgCl2, 0.1 mM dNTPs, 0.5 mg ml−1 purified bovine serum albumin (New England Biolabs, Ipswich, MA), 2.5 μl 10×PCR amplification buffer and 0.4 units of Taq polymerase (New England Biolabs, Ipswich, MA). PCR cycling conditions were: denaturation (4 min, 94°C), 35 cycles of 94°C (30 s), annealing (30 s) (59°C: HarSSR1, HarSSR3 and HarSSR4; 55°C: HaB60; 53°C: HarSSR2 and HaC87; 51°C: HaC14 and HaD47) and 72°C (45 s), with final extension at 72°C (5 min). Fragments derived from PCR were separated through 5% denaturing polyacrylamide gels at 65 W for 2.5–3.5 h and exposed for 15 h to autoradiograph film. Allele sizes were derived from manual comparisons with λgt11 ladders (fmol® DNA Cycle Sequencing System, Promega, Madison, WI, USA).
Bands taken from four of the loci (HarSSR2, HarSSR3, HaB60 and HaC87) were excised from the polyacrylamide gel, rehydrated and subjected to a second PCR with the same microsatellite primers. The resulting products were sequenced in the forward and reverse directions by Macrogen Inc. (Seoul, Korea) to obtain accurate sizes (bp). Sequences were manipulated with Sequencher v4.8 (Gene Codes Corporation, Michigan, USA).
Data analysis
A comparison of the results obtained from two microsatellite allele scoring methods (manual at CESAR vs. automatic at UQ) was made with respect to number of alleles in the sample, allele size range and size of most common allele. The mean allele size of each individual scored manually was plotted against the mean allele size of each individual scored using an automated system. F statistics (F ST) were calculated with the program Fstat (Goudet, Reference Goudet2001).
Results and discussion
Contrasting patterns of allele numbers, size distributions and allele frequencies were found between the laboratories for the samples of H. armigera derived from the Endersby et al. (Reference Endersby, Hoffmann, McKechnie and Weeks2007) and Scott et al. (unpublished) studies (table 2). To compare the results, we undertook two types of comparisons. The first involved plotting the mean allele size of the individual between the studies. These were expected to match across studies given that at least rank order should be preserved across laboratories. If the allele sizes are a little different in the labs, as can happen when different techniques and equipment are used, we would not expect these analyses to be affected. The graphs (fig. 1) indicate that the consistency in the results is poor. In no case was agreement observed. Rank correlation coefficients varied from 0 to 0.9 and numerous correlations were lower than 0.5.

Fig. 1. Mean allele size of each Helicoverpa armigera individual scored manually plotted against the mean allele size of each individual scored using an automated system at eight microsatellite loci for samples extracted in the CESAR and UQ laboratories.
Table 2. Characteristics of Helicoverpa armigera microsatellites in samples from Victoria and Queensland scored using two different methods (manual and automated).

The second approach involved looking at the number of heterozygotes in the studies. Again, one would expect that these would match, ideally without any errors. When patterns were examined, we found that mismatches constituted a significant proportion of cases. Averaged across the two collections, percentage mismatches were 43, 55, 22 and 22% for the HarSS1 to HarSS4 markers, respectively, and 55, 9, 32 and 27% for HaC14, HaC87, HaB60 and HaD47 markers, respectively.
Both these results indicate that the alleles do not line up, and scoring is therefore presumably most likely to reflect the different results in studies by the two groups (Scott et al., Reference Scott, Wilkinson, Merritt, Scott, Lange, Schutze, Kent, Merritt, Grundy and Graham2003, Reference Scott, Lange, Scott and Graham2004, Reference Scott, Lawrence, Lange, Scott, Wilkinson, Merritt, Miles, Murray and Graham2005a,Reference Scott, Wilkinson, Lawrence, Lange, Scott, Merritt, Lowe and Grahamb; Endersby et al., Reference Endersby, Hoffmann, McKechnie and Weeks2007). We strongly suspect that manual scoring is accurate, whereas the automated system used by Scott and colleagues is not, and this is likely due to the different gel chemistry systems used (denaturing vs. non-denaturing) combined with the scoring method. Allele sizes from manual scoring match up with those published in the independent and unrelated paper by Ji et al. (Reference Ji, Zhang, Hewitt, Kang and Li2003), who developed the HarSSR primers (on an automated system, but with denaturing), whereas the automated allele sizes do not match. The automated allele sizes do, however, appear similar to Scott et al. (Reference Scott, Lange, Scott and Graham2004) for HaC14, HaC87, HaB60 and HaD47.
Similarly, when we look at the distribution of alleles in the automated scoring system, these do not match expectations for microsatellites. The alleles have bimodal distributions in some cases (e.g. SSR3, HaC14), whereas unimodal distributions are expected. Moreover, there are occasional alleles that are outliers with respect to allele sizes (e.g. SSR4).
Also, when we only compare the samples from Queensland and Victoria, the manual allele scoring does not produce population genetic differences, whereas the automated scoring system produces such differences between these populations (e.g. HaD47, SSR2). F ST values between Queensland and Victoria were an order of magnitude higher when the automated scoring system was used (0.0716) compared with the manual method (0.0035). The values reflect the differences found between the Endersby et al. (Reference Endersby, Hoffmann, McKechnie and Weeks2007) study and the Scott et al. (Reference Scott, Wilkinson, Merritt, Scott, Lange, Schutze, Kent, Merritt, Grundy and Graham2003, Reference Scott, Lawrence, Lange, Scott, Wilkinson, Merritt, Miles, Murray and Graham2005a,Reference Scott, Wilkinson, Lawrence, Lange, Scott, Merritt, Lowe and Grahamb) studies.
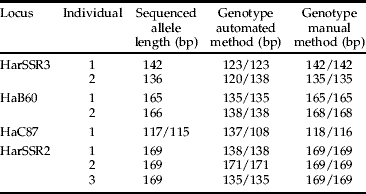
To directly determine the accuracy of the scoring methods, we sequenced alleles from four loci (HarSSR3, HaB60, HaC87 and HarSSR2) for several individuals that differed in allele sizes between the laboratories (table 3). Stark differences were apparent between the methods. For instance, for locus HarSSR3, the manual scoring method for one individual was a homozygote with an allele length of 142 bp, whereas the automated method scored that same individual as a homozygote with an allele length of 123 bp; sequencing revealed this allele to be 142 bp in length. Similarly, for another individual at the same locus, the manual method scored a homozygote with an allele length of 135 bp, whereas the automated method scored this as a heterozygote with alleles 120 bp and 138 bp in length; sequencing showed that the correct allele size was 136 bp (homozygote). This pattern was reflected across each of the four loci (table 3). Clearly, the manual scoring method consistently sizes alleles at the same or approximately the same size as direct sequencing, whereas the automated scoring method, combined with the use of non-denaturing polyacrylamide gels, is consistently inaccurate and can be out by over 30 bp. This is not surprising given that non-denaturing polyacrylamide gels can vary in fragment mobility by more than 10% compared with denaturing polyacrylamide gels (Sambrook & Russell, Reference Sambrook and Russell2001).
Table 3. Allele sizes at four loci determined by direct sequencing, and manual and automated genotyping methods.
There are undoubtedly problems in developing suitable microsatellite loci for evaluating population structure in Lepidoptera, including H. armigera (Zhang, Reference Zhang2004). In particular, primers may amplify families of loci rather than single loci. However, there are several reasons why we think that this is not a large issue with the loci used here. Firstly, if the presence of similar flanking regions had meant that multiple microsatellite loci were being amplified and scored, we would have expected ‘alleles’ to be present at a locus with very different sizes and odd (multimodal) distributions. While these patterns were occasionally seen with the automated system, the manual approach always provided a distribution of allele sizes that matched expectations typical for microsatellite loci. We also directly confirmed allele sizes by sequencing the actual alleles identified. Secondly, in all of the individuals genotyped in Endersby et al. (Reference Endersby, Hoffmann, McKechnie and Weeks2007) and the present study (over 700 individuals), we have never encountered an individual that has more than two bands at any locus. If loci were being amplified from a family of loci, then we would expect that some individuals would have more than two bands amplified for a locus (reflecting alleles from multiple ‘loci’ being amplified). Finally, the patterns of population differentiation found using the manual method for scoring microsatellites matches patterns observed previously based on allozymes (Daly & Gregg, Reference Daly and Gregg1985).
These results indicate that genetic structure does not exist among Australian H. armigera populations. Instead H. armigera appears to comprise one panmictic population. This result matches what is found in Plutella xylostella, another lepidopteran pest species that inhabits a similar area in Australia (Endersby et al., Reference Endersby, McKechnie, Vogel, Gahan, Baxter, Ridland and Weeks2005). This means that population structure should not be considered when developing control strategies, as has previously been advocated (Scott et al., Reference Scott, Wilkinson, Merritt, Scott, Lange, Schutze, Kent, Merritt, Grundy and Graham2003, Reference Scott, Lawrence, Lange, Scott, Wilkinson, Merritt, Miles, Murray and Graham2005a,Reference Scott, Wilkinson, Lawrence, Lange, Scott, Merritt, Lowe and Grahamb).
In summary, investigators need to be very cautious when scoring genetic markers, particularly on automated systems or non-denaturing polyacrylamide systems. The results here are specific to the studies performed by Scott and colleagues; however, they also highlight potential problems that may be encountered in other studies. Ideally, genotypes need to be validated and often this is best performed on a manual system as described above. Automated systems have many benefits in terms of speed; however, this may come at a cost. Also, it is important for investigators to provide information on allele sizes when describing patterns of genetic differentiation. In an ideal world, inheritance patterns of markers should be tested through family studies (Endersby et al., Reference Endersby, McKechnie, Vogel, Gahan, Baxter, Ridland and Weeks2005).
Acknowledgements
We thank Gary Fitt for help initiating this study to help resolve inconsistencies in the literature and the Grains Research and Development Corporation for providing funding for this research through the National Invertebrate Pest Initiative. This research was supported by the Australian Research Council via their Special Research Centre Scheme.


